
After a sub-par March maximum, by end of May 2025 Arctic ice closed the gap with the 19-year average. Then in June the gap reopened and in July the melting pace matched the average, abeit four days in advance of average.
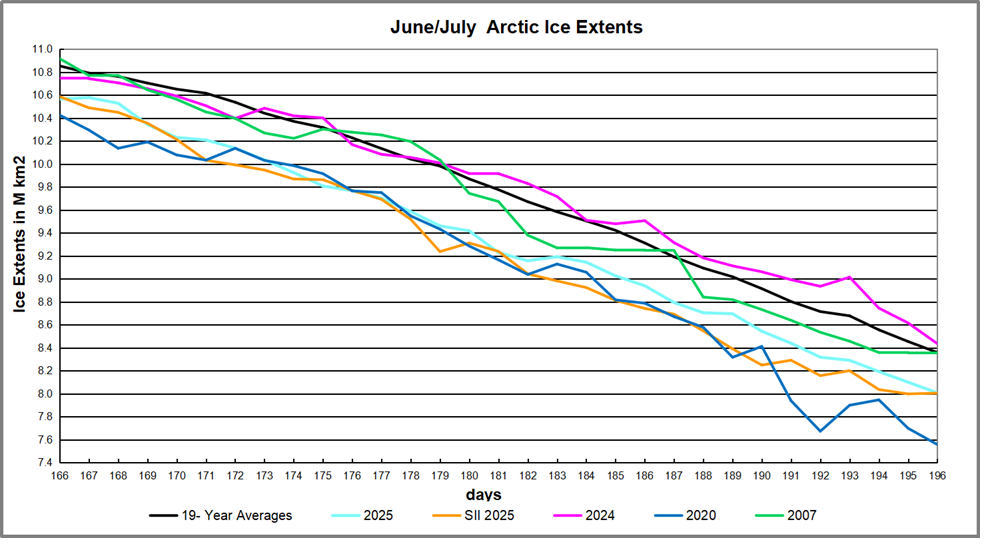
During this period the average year loses ~2.5M km2 of ice extent. MASIE on day 166 was ~300k km2 down, and the gap increased to almost 550k km2 by June 30 (day 181). The deficit to average then reduced to ~350k km2, which persisted over the last 12 years including yesterday, day 196. The graph shows MASIE 2025 matching the average on day 192, four days in advance.
The regional distribution of ice extents is shown in the table below. (Bering and Okhotsk seas are excluded since both are now virtually open water.)
| Region | 2025196 | Day 196 | 2025-Ave. | 2020196 | 2025-2020 |
| (0) Northern_Hemisphere | 8007061 | 8358377 | -351316 | 7556873 | 450188 |
| (1) Beaufort_Sea | 1022304 | 866531 | 155773 | 931056 | 91248 |
| (2) Chukchi_Sea | 718615 | 643869 | 74745 | 612932 | 105683 |
| (3) East_Siberian_Sea | 976061 | 921340 | 54721 | 659117 | 316945 |
| (4) Laptev_Sea | 645741 | 559270 | 86471 | 174286 | 471454 |
| (5) Kara_Sea | 153545 | 360645 | -207100 | 159679 | -6134 |
| (6) Barents_Sea | 14342 | 56080 | -41738 | 39446 | -25105 |
| (7) Greenland_Sea | 387402 | 402761 | -15359 | 400498 | -13096 |
| (8) Baffin_Bay_Gulf_of_St._Lawrence | 268783 | 311662 | -42878 | 232167 | 36616 |
| (9) Canadian_Archipelago | 630633 | 711293 | -80660 | 733866 | -103233 |
| (10) Hudson_Bay | 155460 | 349275 | -193815 | 520027 | -364567 |
| (11) Central_Arctic | 3032353 | 3171652 | -139299 | 3093040.21 | -60687 |
The table shows the two largest deficits, the Atlantic Kara basin combined with Hudson Bay, exceed the total difference from average. In addition are lower ice extents in Central Arctic and Canadian Archipelago, offset by surpluses in Beaufort Sea and other Eurasian shelf basins. Note that Hudson Bay with 350k km2 average ice extent yesterday will have less than 100k in three weeks.

Why is this important? All the claims of global climate emergency depend on dangerously higher temperatures, lower sea ice, and rising sea levels. The lack of additional warming prior to 2023 El Nino is documented in a post NH and Tropics Lead UAH Temps Lower May 2025.

The lack of acceleration in sea levels along coastlines has been discussed also. See Observed vs. Imagined Sea Levels 2023 Update
Also, a longer term perspective is informative:


via Science Matters
July 16, 2025 at 10:31AM
