
0 out of 10 based on 0 rating
via JoNova
November 17, 2024 at 08:53AM

54.53845 -2.58223 Met Office Assessed CIMO Class 5 Data adopted from 1/8/2015
This weather station raises many of the same recurring issues with Met Office weather station standards and locations that are worsening over time. It also raises questions over actual equipment used and motivations.
Data is archived from 2015 though I have been unable to ascertain when it was actually installed and even exactly what was installed back then. Furthermore, if you rely on the Met Office supplied co-ordinates you would struggle to find this site which is over 120 metres from their indicated point. So what are these issues?
Data from this site starts August 2015. Around this same time a major international scandal was breaking where German car manufacturer Volkswagen was found to be “not adhering” to internationally agreed standards relating to emissions. Volkswagen were held to account for these effective crimes and it cost them very dearly.
Just prior to the above scandal, in 2014, the World Meteorological Organisation (WMO) in conjunction with the International Standards Organisation ISO (following extensive consultation with and input from the UK Met Office) produced a set of standards for the siting of weather stations. I refer to this standard in every weather site review but for the first time reader it is detailed here:
The above classification indicates inaccuracies of 1, 2 and up to 5 degrees celsius for sites classified as 3, 4, and 5 accordingly. Now consider exactly what the WMO states on their heading page above:

………“every fraction of a degree” This begs the question – how many fractions of a degree is 5°C inaccuracy?
What does the ISO choose to headline given its exceptionally wide ranging standards remit?

With a strong presence at the conference, ISO will showcase how International Standards are key to transform ambitious climate commitments into concrete, measurable actions.”
Seems 100% conclusive to me from both parties……so what does the Met Office say? Here is their web page on the subject. {n.b. my bold}
“The Met Office operates hundreds of weather stations at locations the length and breadth of the United Kingdom.
We do this in order to capture the state of the atmosphere in and around the environments we all work and live in, both in the here and now and also in terms of the long-term climate record. Met Office observations produced at these stations are underpinned by a rigorous quality management system including a longstanding and well-honed site inspection methodology, ensuring that data produced at a site is as accurate and reliable as it can be.
The Met Office inspection scheme assesses a station for each meteorological element in terms of its suitability for use in meteorological and climatological products. This assessment has 4 categories: Excellent, Good, Satisfactory or Unsatisfactory. The scheme looks at instrument conformance, installation, exposure, and observer competence (if applicable). For example, when assessing temperature in a Stevenson Screen, if a screen is mounted too high or too low or if it is too shaded or the opening screen door is not facing north, then the inspection assessment for temperature at site would be classed as Unsatisfactory. The Met Office quality management system has been in use for a long time and the criteria, working practices and inspection procedures have been fine-tuned over the decades. There are minimum siting and exposure standards to adhere to, to ensure conformance and data validity, and this system is designed to minimise data uncertainty.
The WMO Siting Classification for Surface Observing Stations on Land was formally introduced from 2014, enabling us to make broad comparisons of our weather and climate stations with those around the world. These WMO classifications focus on the exposure of an observed element at a site, with a Class 1 assessment being the highest standard and Class 5 the lowest. These classifications were added to the existing Met Office inspection process, complementing existing assessments around exposure, such as shading and heat sinks/sources, and are now routinely reviewed and updated as part of Met Office site inspection visits.
WMO Siting Classifications were designed with reference to a wide range of global environments and the higher classes can be difficult to achieve in the more-densely populated and higher latitude UK. For example, the criteria for a Class 1 rating for temperature suits wide open flat areas with little or no human influenced land use and high amounts of continuous sunshine reaching the screen all year around, however, these conditions are relatively rare in the UK. Mid and higher latitude sites will, additionally, receive more shading from low sun angles than some other stations globally, so shading will most commonly result in a higher CIMO classification – most Stevenson Screens in the UK are class 3 or 4 for temperature as a result but continue to produce valid high-quality data. WMO guidance does, in fact, not preclude use of Class 5 temperature sites – the WMO classification simply informs the data user of the geographical scale of a site’s representativity of the surrounding environment – the smaller the siting class, the higher the representativeness of the measurement for a wide area. Indeed, it should be noted that WMO Class 5 is not the same as a Met Office ‘Unsatisfactory’ inspection assessment, which ultimately determines the ongoing use of a site. We use the Met Office grading system to determine record verification because; it has historical relevance, covering a wide range of long-standing criteria at UK observation sites, the equipment, and the exposure in a holistic manner and has clear meaning to what is acceptable or not. It tells us how much confidence we have in the data and permits comparisons.
Here is my interpretation of the above.
So what has all this to do with Maulds Meaburn? Well firstly, the Met Office chose to “adopt” this site AFTER the implementation of ISO/WMO standard 19289:2014(E). This site falls into CIMO Class 5 with an inaccuracy margin by siting of 5°C……does the Met Office not acknowledge that claim “every fraction of a degree” being so critical? They proceeded regardless of internationally agreed standards.
Now a close up of this station and the very odd way in which its readings are broadcast. n.b. this is an official Met Office site detailed on this listing.

The goggle aerial image indicates the Screen is in very close proximity (under 3 metres hence the Class 5 rating ) to the rear garden hedge. This close up image indicates (from the rear angled fencing) that the site is quite obviously significantly sloping. But what is that mounted on a pole to the north of the screen? It is a “ Davis Vantage Pro2 ” automatic amateur weather station. These are most certainly not considered acceptable for climate data reporting by the WMO and even the Met Office (for now at least) do not accept readings from them as “accurate” enough. Only the readings taken in the Stevenson screen (no matter how badly sited) are deemed acceptable. This raises the question of what audit trail of quality control ensures that only readings taken at the appropriate time in the Stevenson screen are being used for this manual reporting station. The Youtube video interview in my review of Whitechurch raised the issue of automation and not having to go outside in all weathers. Can the Met office actually prove all readings are taken from the appropriate instrumentation……
…..because this is where potential confusion starts – this is a manually reporting station not an automatic one….or is it?


The Met Office has a Weather Observations Website (abbreviated WOW) which shows both some of its official sites and a large number of private weather stations. It appears almost anyone can contribute to it regardless of any site quality control. It may possibly be more of a “fun” education site but it does show much official data giving the site credibility as a reliable information source. It also allows direct historic data interrogation of some stations such as Leconfield below.

As shown above, the automatic hourly transmitted data can be searched by dates, periods, and choice of parameters. Leconfield clearly identifies itself with the Met Office website link in the bottom right.
Here is the page for Maulds Meaburn.

It shows the Met Office logo and clearly states
“Maulds Meaburn in the Lyvennet Valley (part of the Eden valley). Shap lies 4 miles to the west and Appleby 4 miles to the north-east. A standard site using standard instruments with a Davis VPro2 AWS in support and part of the official Met’ office climatological Observing Network”
Leaving aside quite what “a Davis VPro2 AWS in support” is actually supposed to mean, the page adds the link to the private website where hourly data is available. The Met Office “seal of approval” appears to have been granted to data from a source (a Davis VPro2) not officially approved.
https://mauldsmeaburnweather.co.uk/

This may seem “nit picking” but every one I ran this by simply assumed the hourly data was from an approved Stevenson screen site, was official Met Office data and, by assumption, reliable and accurate. It is not.
So far with Maulds Meaburn the Met Office have knowingly chosen to site a Screen in a sub standard location only ever able to produce at best unrepresentative data and most likely hugely inaccurate. International high standards have been ignored. In addition, they have effectively given an unwarranted level of credibility to data from non-approved equipment.
What was the imperative to open this location and use its data to contribute to climate recording? There already is the Class 1 Shap weather station just 4.1 miles to the west. There is also Class 1 Warcop Range just 7 miles to the east. Indeed, very few parts of the UK were already so well endowed with weather stations as Cumbria which boasted 13 prior to the advent of Maulds Meaburn – 4 of them were Class 1. The county was vastly better represented than elsewhere in the UK so what possible meteorological reason was there for adding Maulds Meaburn? Surely the inevitable expense involved in establishing and continuing to run this site could have been more beneficially used in improving the existing network rather than worsening it.
via Tallbloke’s Talkshop
November 17, 2024 at 08:51AM
By Paul Homewood
h/t Philip Bratby
They’re preparing for the inevitable blackouts:

Russia’s invasion of Ukraine and its impact on global energy markets mean the UK and Europe face a challenging winter. The energy industry is prepared and has well-established procedures in place if there is a national energy shortage.
One part of these procedures is planned emergency power cuts, called ‘rota disconnections’. These are very rare and temporary.
If needed, customers would lose power for around three hours per day during the emergency, on an area-by-area basis. This would ensure power supplies are shared fairly with customers, and everyone has power for most of the day.
Customers would know when they would be without power by entering their postcode at powercut105.com to find their rota. The rota would only be published once emergency power cuts have been approved to take place.
Rota disconnections would only be used after all other options, such as turning down industrial demand and voltage reduction, have failed to restore stability to the power system.
If required, the electricity system operator National Grid Electricity System Operator (ESO) would legally instruct distribution network operators to disconnect power supplies. They would follow established procedures set out by the government in the Electricity Supply Emergency Code.
The Code ensures power is shared fairly across all customers during a national energy emergency.
National Grid ESO take several steps to protect customers before any emergency planned power cut instruction is given. These include:
While the winter is expected to be challenging, there is no guarantee emergency measures will be necessary. National Grid ESO’s central view remains that there will be adequate electricity supplies through the winter to ensure Great Britain remains within the reliability standards set by Ofgem.
Some sites are protected from emergency planned power cuts. These include critical national infrastructure, like air traffic control centres and some major hospital facilities with accident and emergency departments.
Exemptions aren’t automatic and organisations have to apply for protected status. Residential customers, including those on the Priority Services Register and businesses without backup generation that are not listed as ‘protected’ by the government, would be part of an planned power cut rota.
Organisations would need to apply for protected status, following the Electricity Supply Emergency Code procedures.
If you depend on medical equipment that requires power, and don’t already have a power cut plan, you should speak to your healthcare provider now. Power cuts can happen all-year-round so it’s important you are prepared, make a plan and know what to do.
https://www.nationalgrid.co.uk/rota-load-disconnections
.
They say that these power cuts are “very rare and temporary”, and up to now they are. But the timing of this announcement, which according to Wayback was last winter, is a strong signal that they will be very common in future. After all, the Ukraine war might have tightened gas supplies, but under Net Zero plans, we won’t have any gas at all!
The cuts can be up to 3 hours at a time, they say. And the system has been set up to share the pain across the network.
I also like the reference to “emergency planned power cuts” – if they are an emergency, they can hardly be planned!
We can know that this is far from a once in a blue moon event, when the National Grid even have a website where you can check which particular rota you house is on!

https://www.powercut105.com/en/
And all of this is being smuggled in under the radar, so the public do not notice until it is too late.
via NOT A LOT OF PEOPLE KNOW THAT
November 17, 2024 at 08:14AM
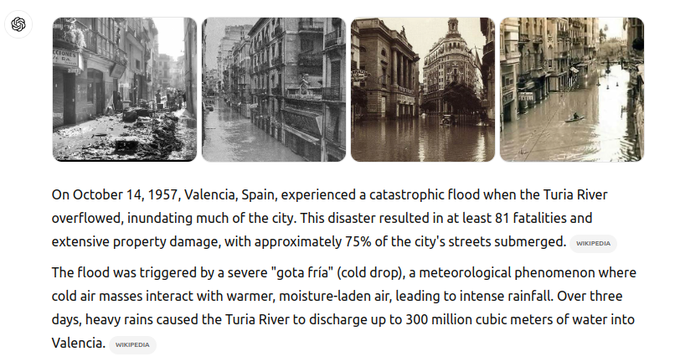
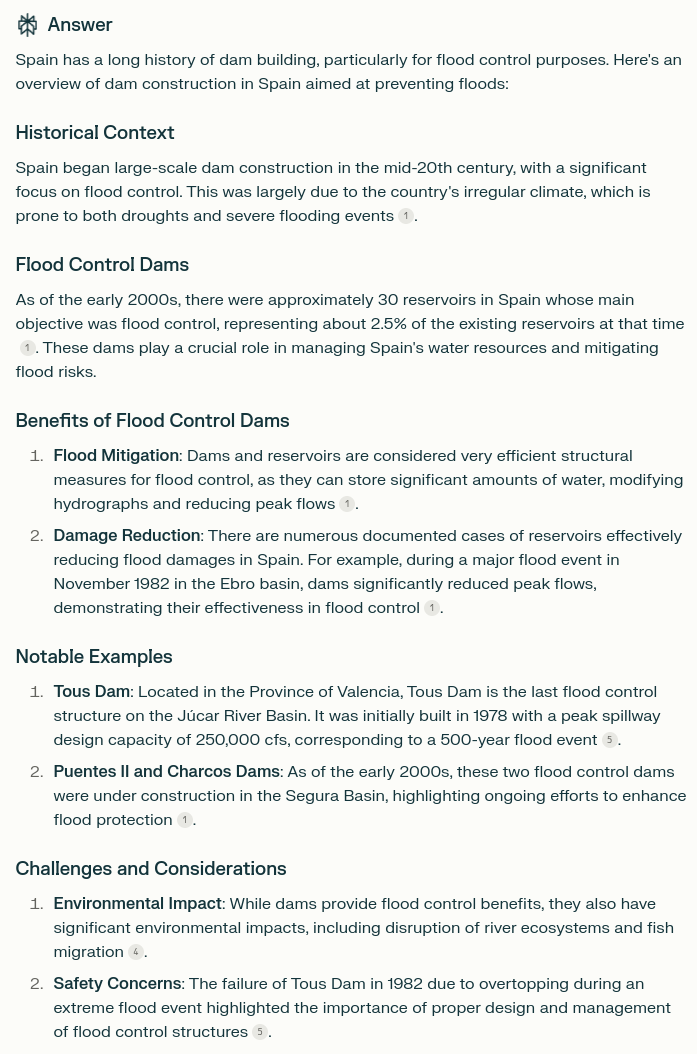
Spain has a long history of catastrophic flooding. After the 1957 Valencia flood which had three-fourths of the city underwater, the Spanish government built a lot of dams for flood control. But recently they have been tearing the dams down, and now blame flooding on “climate change.”
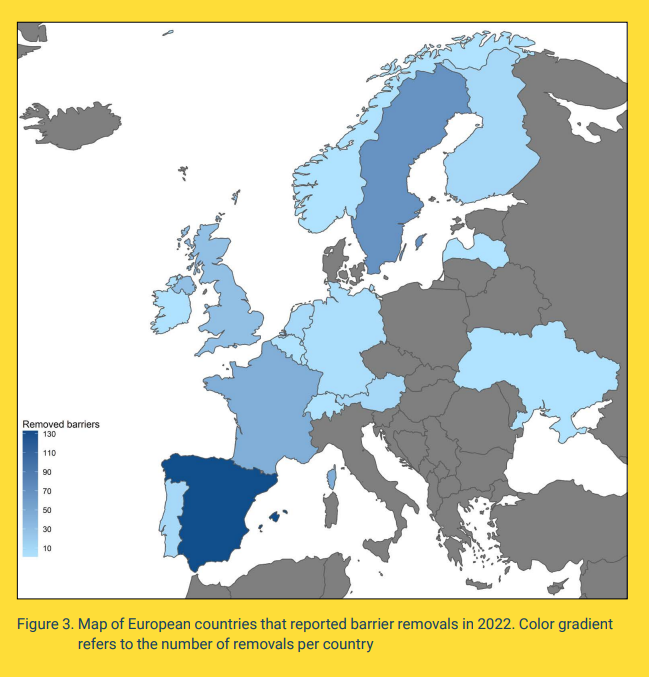
Spain affirming its place as the European leader in dam removal,
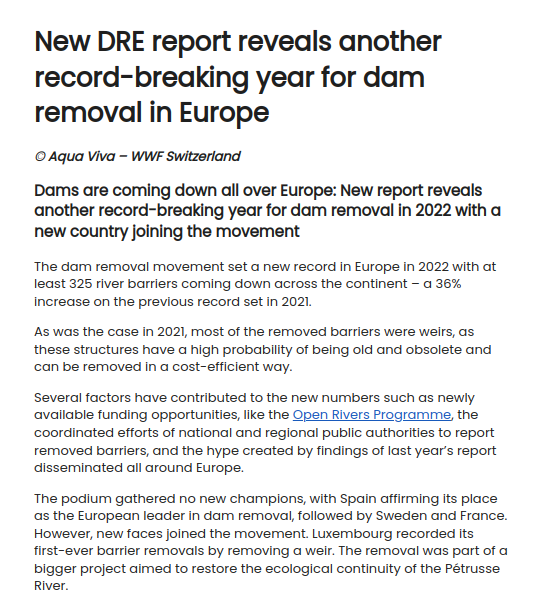
New DRE report reveals another record-breaking year for dam removal in Europe – Dam Removal Europe
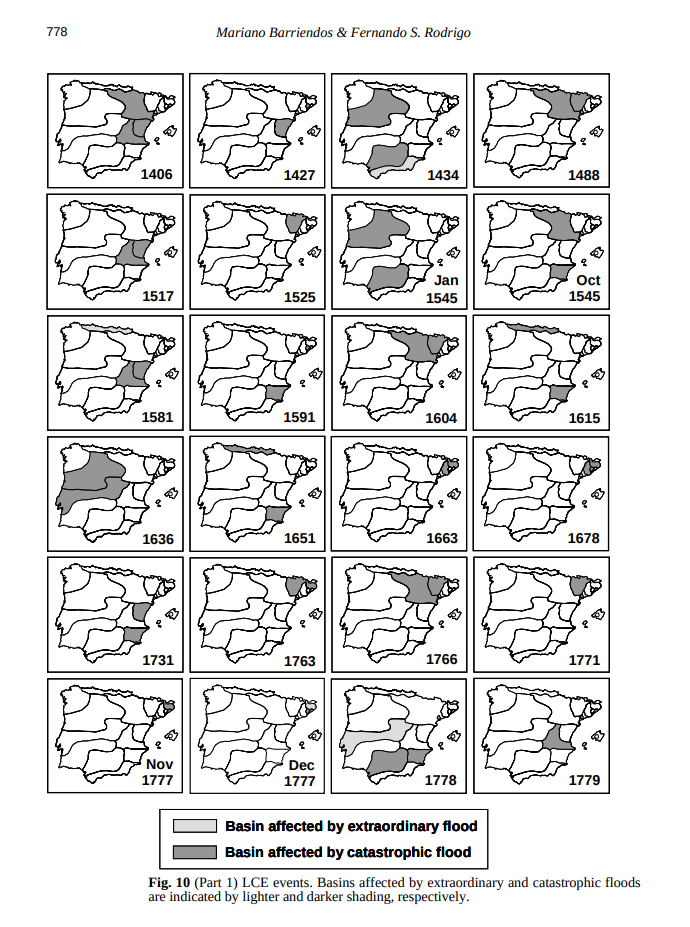
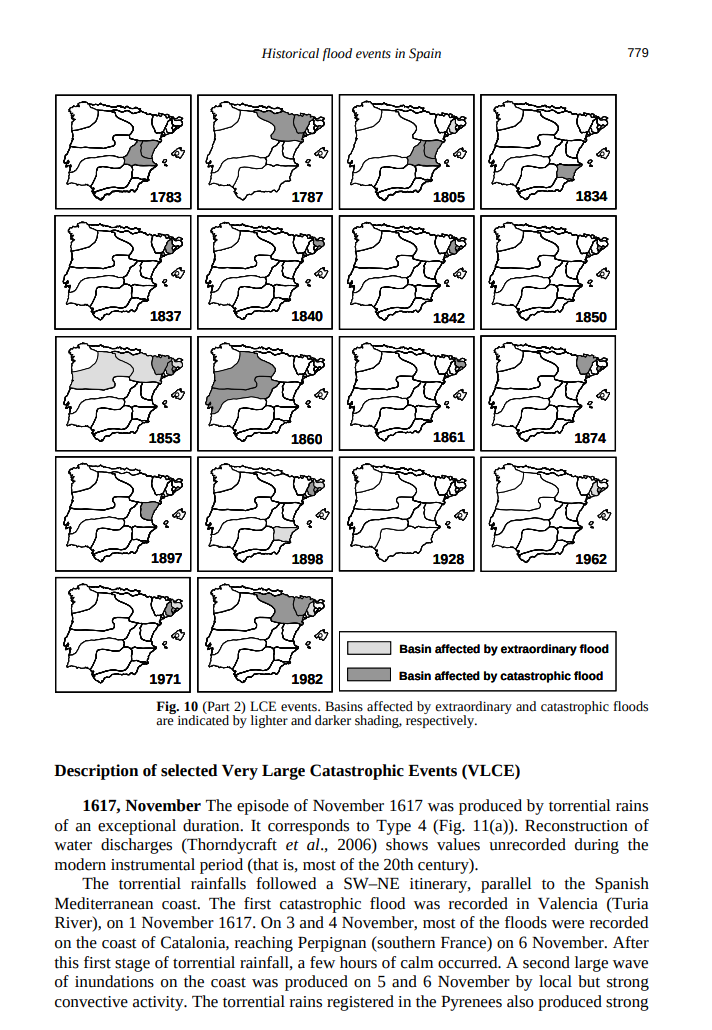
Study of historical flood events on Spanish rivers using documentary data
“On October 14, 1957, Valencia, Spain, experienced a catastrophic flood when the Turia River overflowed, inundating much of the city. This disaster resulted in at least 81 fatalities and extensive property damage, with approximately 75% of the city’s streets submerged”
“Spain has a long history of dam building, particularly for flood control purposes. Here’s an overview of dam construction in Spain aimed at preventing floods”
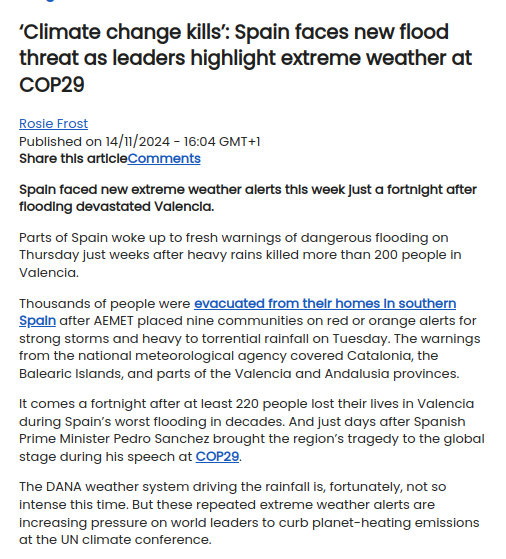
“‘Climate change kills’: Spain faces new flood threat as leaders highlight extreme weather at COP29
It comes a fortnight after at least 220 people lost their lives in Valencia during Spain’s worst flooding in decades. And just days after Spanish Prime Minister Pedro Sanchez brought the region’s tragedy to the global stage during his speech at COP29.”
Just having fun
This entry was posted in Uncategorized. Bookmark the permalink.
via Real Climate Science
November 17, 2024 at 08:10AM

