COP 29: another round of UN-sponsored pickpocketing of national treasuries on the grand scale, with the usual excuse that 0.04% of the Earth’s atmosphere being carbon dioxide is somehow a diabolical (but correctable – pay up) problem.
– – –
UN Climate COPs have always been about big money but until now there was a facade of emission reductions to hide it behind, says David Wojick @ CFACT.
This time the money is the big thing and it is amazingly crazy. They want many trillions from us starting next year.
That people take this nonsense seriously speaks volumes about the unreality of the UN climate program. But it will be great fun to watch them hit the NO WAY wall.
There are actually three big money issues to watch fail.
First is the annual money for nothing from developed countries to developing ones that is supposed to jump from a measly $100 billion a year to a trillion a year and quickly growing to almost two trillion. I am not making this up.
Second is the as yet untold trillions we are supposed to pay the developing countries to make up for their bad weather. Which of these two is crazier is hard to say and I welcome suggestions.
Third is perhaps the most fun. People want China, one of the strongest economies in the world, to stop pretending to be a developing country and put big money into these two pots. By some measures China is by far the strongest economy. For example they produce and use more electricity than the US and EU combined.
. . .
Here’s a bit more on the jargon so you can follow the action. First the astronomical annual payment issue is called the New Collective Quantified Goal or NCQG which strikes me as unpronounceable. Suggestions welcome. At least there is an interior rhyme with C and G.
For purpose of discussion the starting value of the NCQG is $1.1 trillion in 2025 rising to $1.8 trillion in 2019. Yes it is a 5 year plan. No surprise there, right?
The second big money issue is called Loss and Damage. This bad weather pot is just getting off the ground or trying to which may not happen so there is a lot to watch.
The problem is there is more bad weather than money in the world so even possible funds are limited. Thus the basic issue is who gets how much and for what?
There are no actual funds at this point. So the debate is entirely academic which diplomats love.
NOTE:Since he has done extensive investigation into some implausibly hot temperatures reported in Death Valley, I asked Bill Reid to comment on my previous blog post where I maintain that the world record 134 deg. F highest recorded air temperature was likely biased warm by about 10 deg., and should not be accepted as a world record. What follows are Bill’s initial thoughts on the subject. Also, based upon his comments, I will likely update the charts found in my previous blog post with more realistic temperature lapse rate values in the early 20th Century when insufficient stations were available to determine accurate lapse rates.
by William T. Reid
A big thank you to Dr. Spencer for investigating the current (very dubious) world high-temperature record and for bringing attention to my Death Valley climate research. There are a handful of ways, both climatologically and meteorologically, to show that Greenland Ranch’s reported maximum of 134F on July 10, 1913, is likely not valid.
Dr. Spencer’s methodology here (comparing the Death Valley maximums to those the closest surrounding stations, with adjustments for station elevation) is indeed a devastating blow to the authenticity of the suspect observations. What it basically demonstrates is that the lower troposphere was not hot enough to support temperatures much above 125F in July, 1913. I have compared regional maximums for all of the hottest summertime events since 1911. In practically all instances (in which the Greenland Ranch and Death Valley reports appear reasonable), ALL of the maximums at the closest surrounding stations lend support to the maximums for Death Valley.
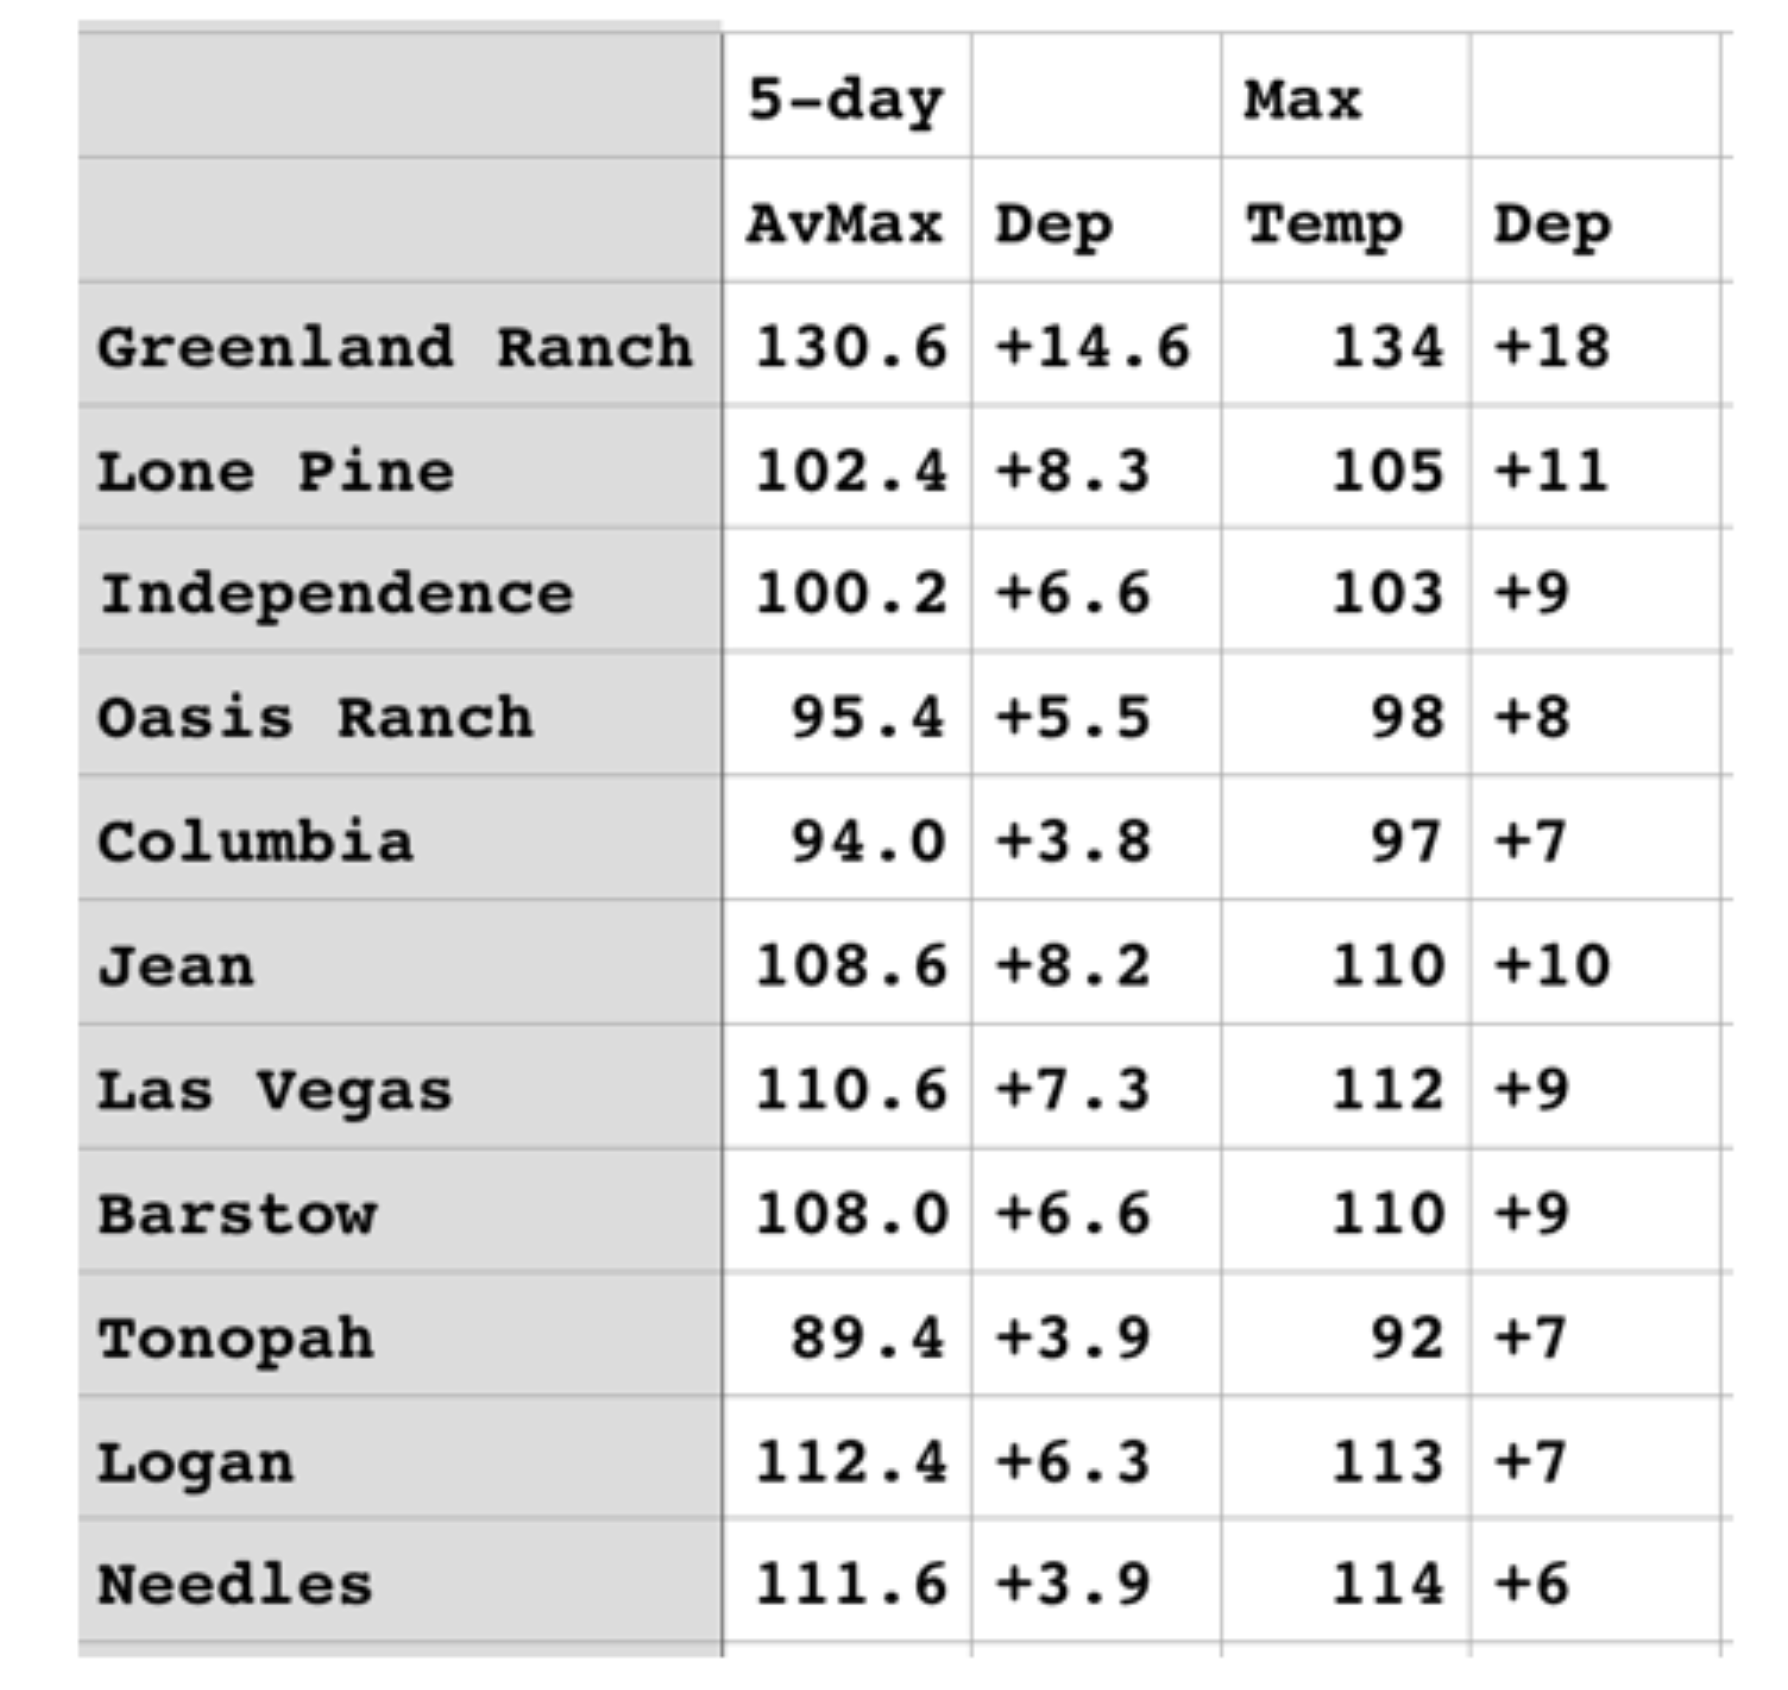
From July 7 to 14 of 1913, when eight consecutive afternoons had reported maximums of 127, 128, 129, 134, 129, 130, 131 and 127F in Death Valley, NONE of the maximums from the closest surrounding stations supported the Greenland Ranch maximums! The departures from average for maximums for the hottest five-day stretch were about +4 to +8 at the closest stations, while maximums at Greenland Ranch were nearly 15 degrees F above the average for July. (see table)
Annual maximums at Greenland Ranch from 1911 to 1960 ranged from 120F to 127F, except for the 134F in 1913. If the reported maximums at Greenland Ranch in July, 1913, were authentic, then the maximums at the closest surrounding stations in that month would have been much higher than reported. In addition, numerous regional heat waves have been hotter than the one during the first half of July, 1913. Why have Death Valley maximums failed to exceed 130F in the interim when three days in July 1913 purportedly reached 134, 130 and 131F?
In his “bias” chart, Dr. Spencer notes the “substantial warm biases in the temperatures reported at Greenland Ranch in the first 10-15 years.” And, he mentions that the observer(s) may have been relying to some extent on thermometers other than the official instrumentation. I do think that the observer was comparing “household thermometer” readings with the official equipment on occasion from spring to summer of 1913. Higher readings off of the poorly-exposed thermometers near the ranch house and under the veranda were probably (and inappropriately) entered onto the official climate form. But, I have not uncovered much evidence of this particular type of deviation from standard observational procedures outside of 1913.
I would contend that the generally higher “bias” numbers from the early years comparably are due primarily to changes at the closest area weather stations which promoted cooler maximums early on and warmer maximums later. For example, two of the closest stations to Greenland Ranch in 1913 were Independence and Lone Pine, in Owens Valley. In 1913, Owens River water was diverted to Los Angeles, and the Owens Valley gradually dried up. Summer maximums increased as Owens Lake evaporated, irrigation was not possible and farmland was abandoned, and desert-like conditions developed. (Roy’s note: The early years had very few stations within 100 miles of Death Valley, and the temperature lapse rates I computed from those few stations appear to be biased as a result. I will correct this in a future blog post, and will provide what should be better estimates of average July daily maximum Death Valley temperatures.)
Also, in the early decades of the 20th century, thermometer shelters were (almost invariably) sited above grass. This resulted in very conservative (i.e., coolish) maximums at desert stations. Low humidities promoted cooling due to evapotranspiration effects. In the early decades of the 20th century, desert weather stations were generally in towns, amidst shade trees and lawns. The resulting maximum temperature reports were very conservative. By mid-century and thereafter, the town weather stations were more likely to be at the airport or at a municipal utility site, fire station or equipment yard. Grass cover and shade trees were usually absent at these locales. Today, desert weather stations in towns and cities are (almost invariably!) above bare ground.
You can imagine the difference in maximums between desert stations above oft-irrigated grass and those above bare ground. (Roy’s note: In my experience, unless the vegetation area is rather large, and there is almost no wind, a weather station’s daily maximum temperature will still be largely determined by air flowing from the larger-scale desert surroundings. But note… this is different from, say a poorly sited thermometer next to a brick wall or heat pump where hot air from an isolated source can elevate the daily maximum temperature recorded).
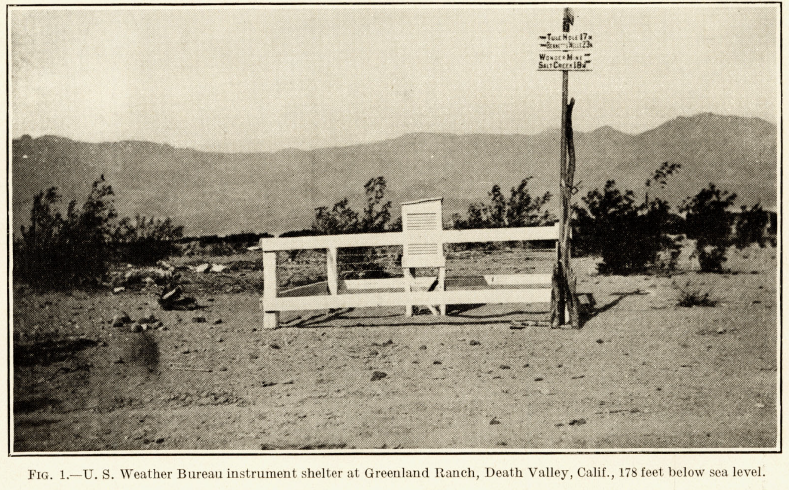
The Greenland Ranch station was originally sited above a patch of alfalfa grass, immediately adjacent to forty acres of cultivated and irrigated land. It is my belief that the new observer in 1913 (Oscar Denton) was rather disillusioned with the conservative maximums from the official station above grass and next to the evaporatively-cooled farmland. I think he felt compelled to fudge the maximums upwards in 1913. Photographs of the Greenland Ranch weather station show that it was above bare ground by about 1920 (see example photo at the top of this post).
So let us look at this tweet reaction from Dr Michael Mann:f The problem is it used to be a whole lot worse. Check this out So can the tweeter a monster in 1932 that ran up almost half the ace points (71) of what this season is now ( a bit over 150) or […]
I used to be a landlord about 20 years ago and I had to have my properties inspected by the local council to see if they conformed to the fire regulations and they were in a fit state of repair. Since I sold them there has been a steady increase in the demands placed on landlords, including the requirement to have an Energy Performance Certificate giving a rating from A to F. Now they have been told that they must reach a level C or above, but as you can see from the link below it is a bit of a lottery to achieve this. I expect a number of landlords will be quitting the business. Things will get a lot worse in the mad pursuit of net zero!