Donald Trump’s massive landslide victory in Tuesday’s presidential election has climate activists around the world melting down. Trump called measures to control climate change “one of the great scams” of the world, and said at one of his final rallies “who the hell cares?” if the sea levels rise. Trump will immediately get America out of the Paris Climate Agreement, and promised in his acceptance speech this week to get as much “liquid gold” out of ground in the United States as possible. Climate Clown Michael Mann is apoplectic, of course. Climate activists in the UK vandalized the US embassy in London with orange paint. And X, formerly Twitter, was full of climate loonies losing their minds. We’ll go over all of that, and have a little schadenfreudic fun at their expense.
On Episode #134 of The Climate Realism Show, we welcome the Carbon King, Jason Isaac CEO of the American Energy Institute to discuss the future of climate and energy policy in the restoration of the Trump administration. Heartland’s Anthony Watts, H. Sterling Burnett, Linnea Lueken, and Jim Lakely will also cover some of the Crazy Climate News of the week. Join us LIVE at 1 p.m. ET so you can leave your questions and comments for the show in the chat.
This panel discussion will be archived and available at our WUWT Climate TV page, a collection of over six hundred videos, featuring new interviews and analysis, and covering dozens of media sources discussing, debating and analyzing the latest in climate science, climate politics, and energy policy, including topics concerning temperature, sea level, polar bears, ocean acidification, extreme weather, censorship, wild fires, and more.
UCP members voted in favor of a resolution to “recognize the importance of CO2 to life and Alberta’s prosperity.” Credit: Danielle Paradis [Participants numbered over 6000]
Joe Oliver explains at National Post We’re at a climate policy turning-point. Excerpts in italics with my bolds and added images. Much as the term “tipping-point” is overused regarding physical and natural systems, it is relevant to socio-political systems. Oliver’s article was written before the US election vote between two candidates with completely opposite climate/energy positions. It was a few days after an important vote in energy rich Alberta affirming the vital role of hydrocarbons. [See Alberta: “CO2 Gas of Life, Not Pollutant!” Media Outrage Ensues]
Across Europe and North America, voters are increasingly skeptical of climate alarmism and worried about the high cost of net-zero policies
Climate alarmism is facing daunting scientific, economic and political challenges to its credibility with the public and its influence on government policy in Europe, the United States and Canada. It may finally have reached an historic turning point.
The public is constantly warned about a dangerous surge in warming since the late 1970s due to increased man-made GHG emissions. But a recent peer-reviewed article by five academicians with expertise in oceanography, mathematics and statistics contradicts that conventional wisdom. They find no statistically significant change in the warming rate beyond the 1970s— even though emissions have risen 121 per cent since then, from 24 billion metric tonnes in 1970 to 53 billion in 2023.
They are not alone. John F. Clauser, 2022 winner of the Nobel Prize for physics, is one of 1,960 scientists and professionals from around the world, including 146 Canadians, who have signed the Clintel World Climate Declaration, whose central message is that there is no climate emergency.
These results pose two basic challenges to the core beliefs of climate alarmists.
If warming has not accelerated in the past half century, where is the crisis? And, If a doubling of GHG emissions is supposed to directly impact temperatures, why have temperatures not shot up?
The latter question also applies to the 1970’s, when go-to experts and the mainstream media were hyperventilating about a return to an Ice Age, though GHG emissions had doubled in the previous 30 years.
Meanwhile, European economic growth has stalled, in large part due to the high cost of energy, which makes industry uncompetitive and drives energy-dependent companies to the United States. Germany, now the sick man of Europe, is de-industrializing, a direct result of former chancellor Angela Merkel’s reckless abandonment of nuclear energy and her country’s consequent reliance on Russian gas. The German automotive sector is also in crisis, the loser in a failed bet on EVs.
Tellingly, the issue of climate change has been virtually absent
from the American presidential campaign, even though the
two candidates have opposing views on the subject.
Donald Trump has made some headway condemning Kamala Harris for senseless green policies that damage the economy and hurt American workers. The one climate issue that has been high-profile is fracking. In a dramatic reversal from her position in 2019, Harris now supports it, which is important in Pennsylvania, a state crucial to her election chances. If she wins, she will back subsidies for renewables and discourage fossil fuel development. If Trump wins, it will be “Drill, baby, drill,” a rejection of climate alarmism and a retreat from the so-called Inflation Reduction Act, all of which would reverberate globally.
Although most Canadians claim to be concerned about global warming, it is no longer high on their priority list and they were never prepared to pay much to deal with it, in any case. Axing Ottawa’s key climate policy, the carbon tax, has become a powerful vote-winner for Conservatives across the country. Ontario Minister of Energy and Electrification Stephen Lecce has come out in favour of every source of energy to produce electricity, including nuclear for base load and natural gas to back up wind and solar. Without gas, the province would suffer from brownouts and blackouts, ballooning costs and an uncompetitive industrial sector.
Despite all this, Canadian politicians are not yet ready to acknowledge publicly three increasingly evident realities that contradict climate orthodoxy:
Net zero is unattainable without devastating economic and social costs — and may be unattainable, period.
Canada cannot on its own make a discernible difference to the global climate. And, therefore,
Climate policies are mainly an extremely expensive form of virtue-signaling.
The federal Liberals, blinded by catastrophism and the appeal of big-government solutions, will not retreat from their crushingly costly climate program. But they almost certainly will be gone within a year, though their death throes seem interminable. A new Conservative government should focus on adaptation and research, which are effective and affordable ways to deal with extreme weather and moderately rising temperatures.
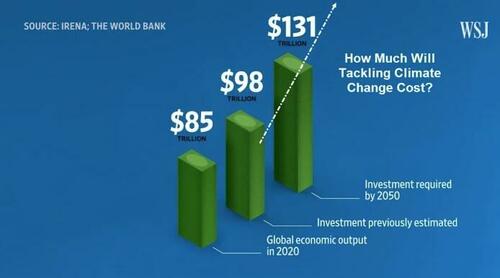
Yes, those are Trillions of US$ they are projecting to spend.
Though the signs are encouraging it is still too early to be sure we have reached peak climate alarmism. But the time is coming when common sense and rationality re-emerge — first gradually and then probably suddenly. One day we will look back with deep regret and wonder how collective madness captured the Western world and caused it to sacrifice hundreds of trillions of dollars to a false idol.
Over the years, a few commentators have have argued that the world record highest temperature of 134 deg. F at Death Valley, CA recorded on July 10, 1913 is physically implausible.
Here I show quantitatively that the 134 deg F temperature is biased high, by about 10 deg. F.
Extensive historical research by William T . Reid has suggested the person making the temperature observations at Greenland Ranch likely replaced the official measurements from a thermometer in a Stevenson screen shelter with other measurements made next to the adobe living quarters.
Background
The “official” world record highest near-surface air temperature is 134 deg. F, recorded in Death Valley, California on July, 10, 1913 at Greenland Ranch, California an isolated location with no similarly sited stations with which to compare. Greenland Ranch was a manmade oasis created by the Borax people around the turn of the 20th Century, with water piped in from the nearby mountain. It has a rich history, but always against a backdrop of oppressive summer heat that few visitors (and even workers) could endure.
As part of my new analyses of GHCN daily high and low temperatures, John Christy suggested I take a look at the Death Valley temperature data, and the record 134 deg. temperature in particular. Several people over the years have expressed concerns that the 134 deg. reading is implausibly high, but this has been difficult to prove. Both the World Meteorological Organization and NOAA’s National Weather Service continue to recognize 134 deg. F as the world record. It is quite likely that Death Valley remains the hottest location in North America; it’s the world record value that is in question here.
The most extensive meteorological and historical arguments against the record I’m aware of come from a series of blog posts by storm chaser William T. Reid, re-posted at Weather Underground here, which I did not read until after I did the calculations which follow. I have since read some of what Bill has written, and I encourage anyone with an interest in history to read his extensive summaries (along with old photos) of Greenland Ranch, where the world record temperature was recorded. He has done considerable library research and he found a letter from the ranch foreman who expressed disappointment that the measurements from the instrumented shelter provided by the U.S. Weather Bureau in 1911 were so much lower than what he measured under his veranda. Bill suspects (and I agree) that the reported values for some period of time might well have not been from the instrumented shelter.
The method I will use to demonstrate the near-certainty of a high bias was also included in a limited fashion in Reid’s blog post (which contains a variety of meteorological arguments). I will apply the method to all years since 1911, and will show that the 134 deg. F record was approximately 10 deg. higher than what it should have been. The analyses I present are based upon the NOAA GHCN daily temperatures, with basic NOAA quality control procedures applied, thus they are from an “official” source. The GHCN dataset includes the 134 deg. F record high temperature from Death Valley.
How Can One Quality-Check the World Record Highest Temperature?
The main reason that the world record hottest temperature cannot be easily “fact-checked” is that there were no other weather stations in Death Valley at the time, and the low elevation (below sea level) of Greenland Ranch is routinely tens of degrees F hotter than at the mountain stations, which are tens of miles away and thousands of feet higher.
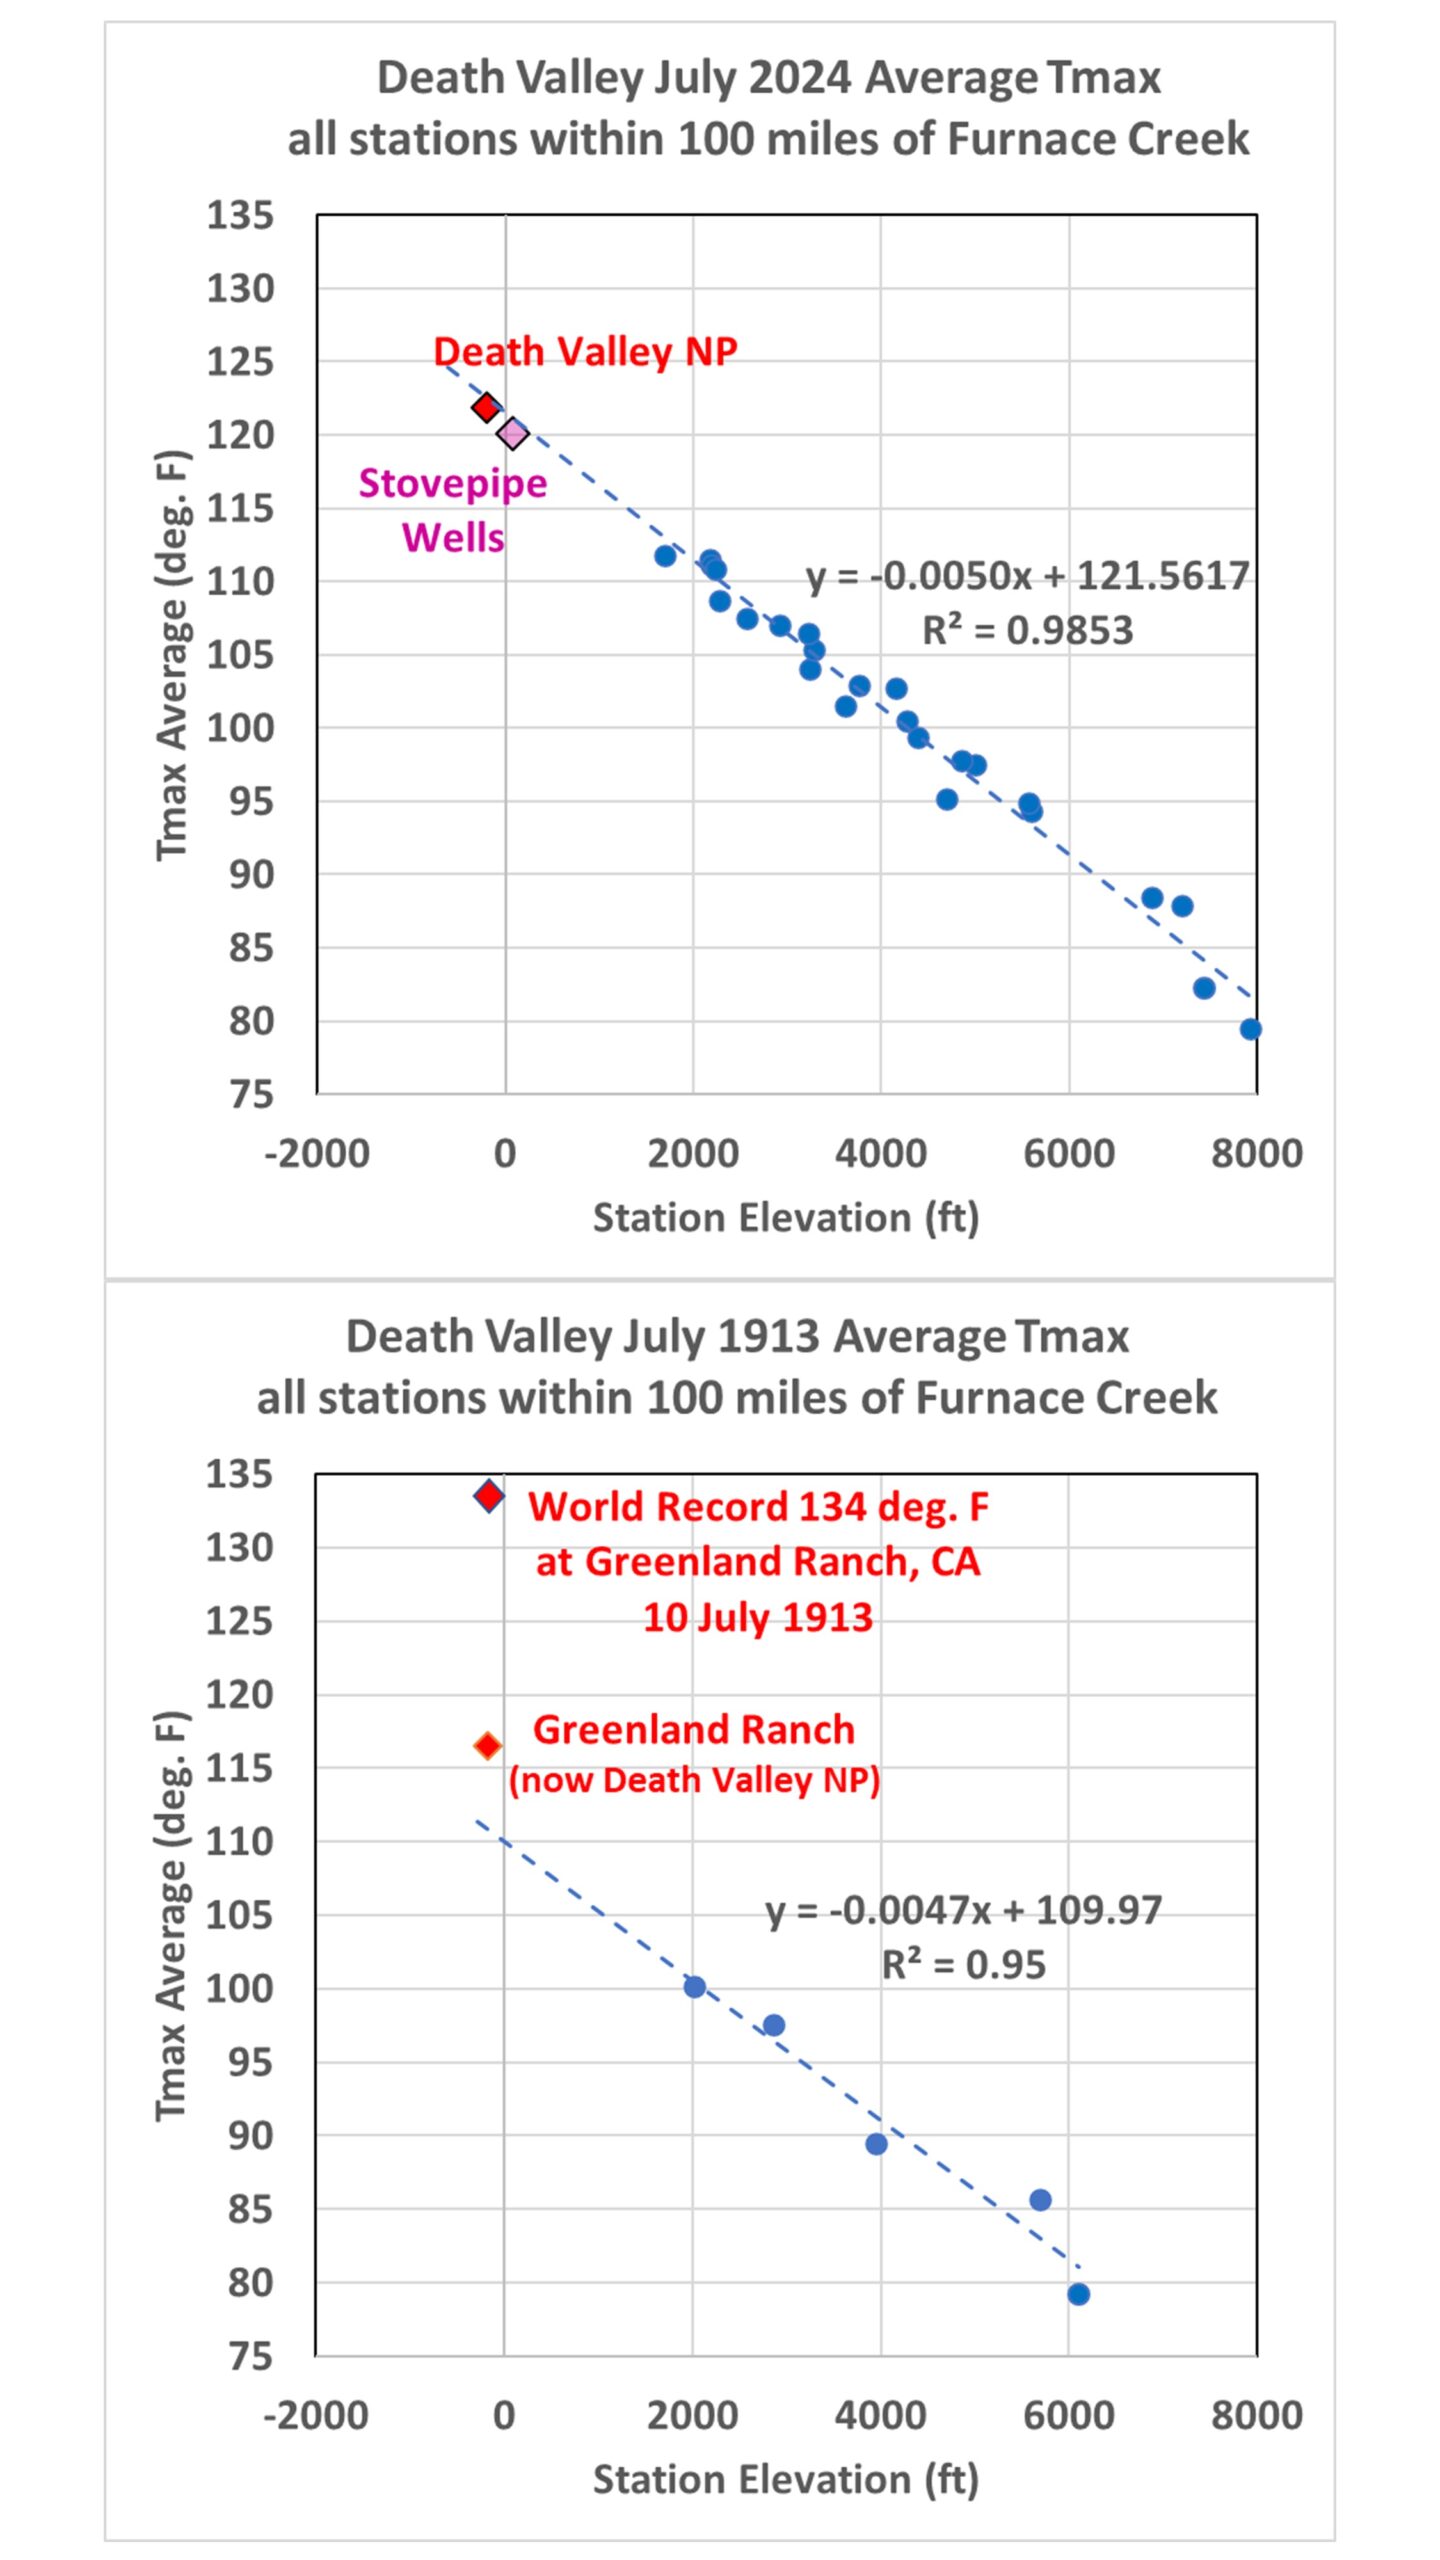
Yet, from a meteorological standpoint, Death Valley in the summer is the perfect place to quality check those hot temperatures from distant, mountain stations. Before I explain the reasons why, let’s first look at how Death Valley air temperatures compare to high-elevation stations during July of this year (2024, which had near-record high temperatures), as well as during July of 2013. Following is a plot (Fig. 1) of July-average high temperatures (Tmax) for all stations within 100 miles of the Furnace Creek station (previously “Greenland Ranch”, and today called Death Valley National Park [NP] station). Importantly, I’m plotting these average temperatures versus station elevation:
Fig. 1. July average maximum temperatures at stations within 100 miles of Furnace Creek, CA in 2024 (top) and 1913 (bottom), plotted against station elevation. The regression lines are fit to all stations except those near Greenland Ranch/Furnace Creek/Death Valley N.P.
Note the strong relationship between station elevation and temperature, something William Reid also noted. Significantly, the two lowest-elevation stations (in Death Valley) in 2024 have temperatures which are very close to the regression line that relates how the July-average high temperatures vary with station altitude (the two Death Valley stations, located below sea level, are not included in the regression).
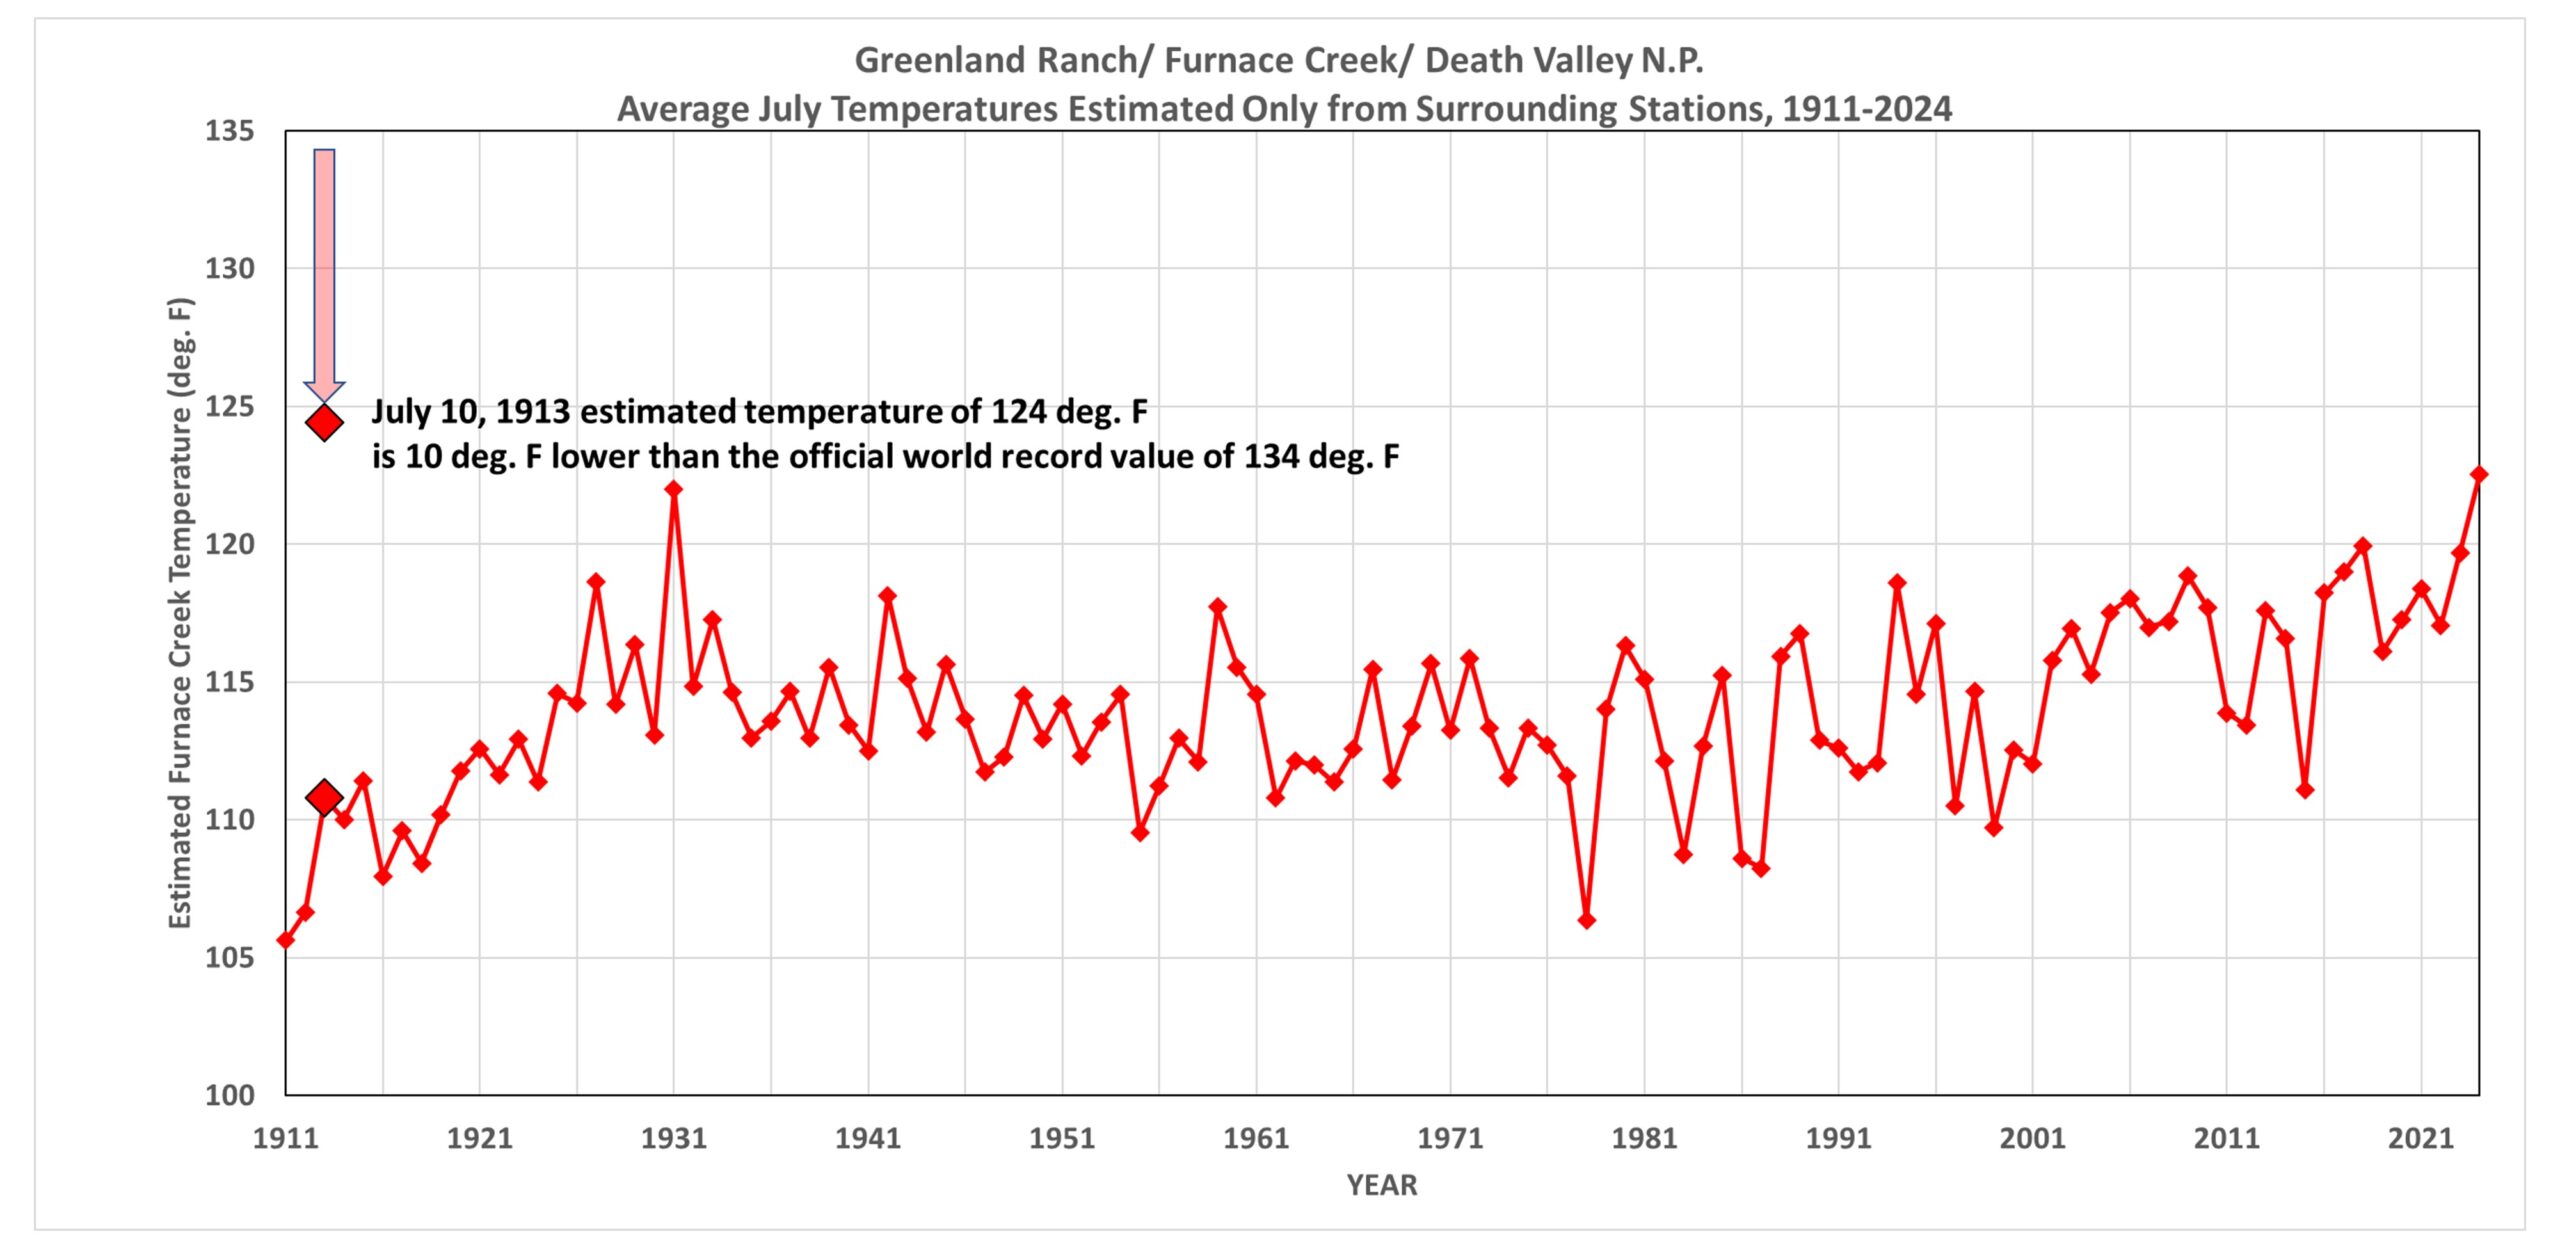
The regression line can be computed in the other years, too, and used to statistically estimate what temperature the Furnace Creek station in Death Valley should have measured, based upon the surrounding, higher-altitude stations. This method allows us to estimate the Death Valley temperatures in each year, which is shown next in Fig. 2.
Fig. 2. Yearly estimates of July average temperature at Furnace Creek, CA based upon all available GHCN stations within 100 miles of Furnace Creek. Each yearly estimate is based upon upon the station data from that year. The indicated estimate on July 10, 1913 (the date of the world record 134 deg. F reported reading) is 10 degrees cooler than the world record, at 124 deg. F. This 1-day estimate is based upon the surrounding stations only on that date. Note the 2024 value is about 0.5 deg. F above the value in 1931.
Meteorological Justification for the Methodology
There are solid meteorological reasons why one can use fairly distant, high-elevation stations to check Death Valley temperatures in July. (Remember, my formal training is as a meteorologist… I only work in climate because it pays better. I actually took some of the temperature measurements contained in the GHCN dataset during summers in the late 1970s when I interned at the National Weather Service Office in Sault Ste. Marie, Michigan).
In simple terms, daytime temperatures during the warm season in dry, semi-desert or desert climates vary with altitude in a predictable and repeatable manner, and with little change over substantial distances. Evidence of this is shown in Fig. 1. This is much less true during the cool season, at night, or during cloudy (or even rainy) weather. This makes Death Valley in July one of the best places on Earth for fact-checking of very warm temperature values. This applies very well to the southwestern U.S. in the summer (at least before monsoon rains arrive), where a semi-permanent high pressure ridge in May-July gets set up every year, with slowly subsiding (sinking) air producing mostly clear skies. This kind of weather feature has a large and uniform regional extent (unlike low pressure troughs, which can be sharp with strong horizontal temperature changes; that’s related to something called the “Rossby radius of deformation“.)
In simple terms, the warm, high pressure airmasses that settle in over the SW U.S. in July are spatially uniform, with strong daytime vertical mixing producing temperature lapse rates approaching the dry adiabatic value. This allowing comparisons between temperature at stations up to (for example) 100 miles away. The big differences in temperatures between neighboring stations, then, are primarily due to altitude. Daytime temperatures in the summer in dry climates decrease rapidly with height (see the plot above), providing the most perfect meteorological conditions for doing the kind of comparison I’m describing here.
Estimated July Biases in the Greenland Ranch/Furnace Creek/Death Valley N.P.
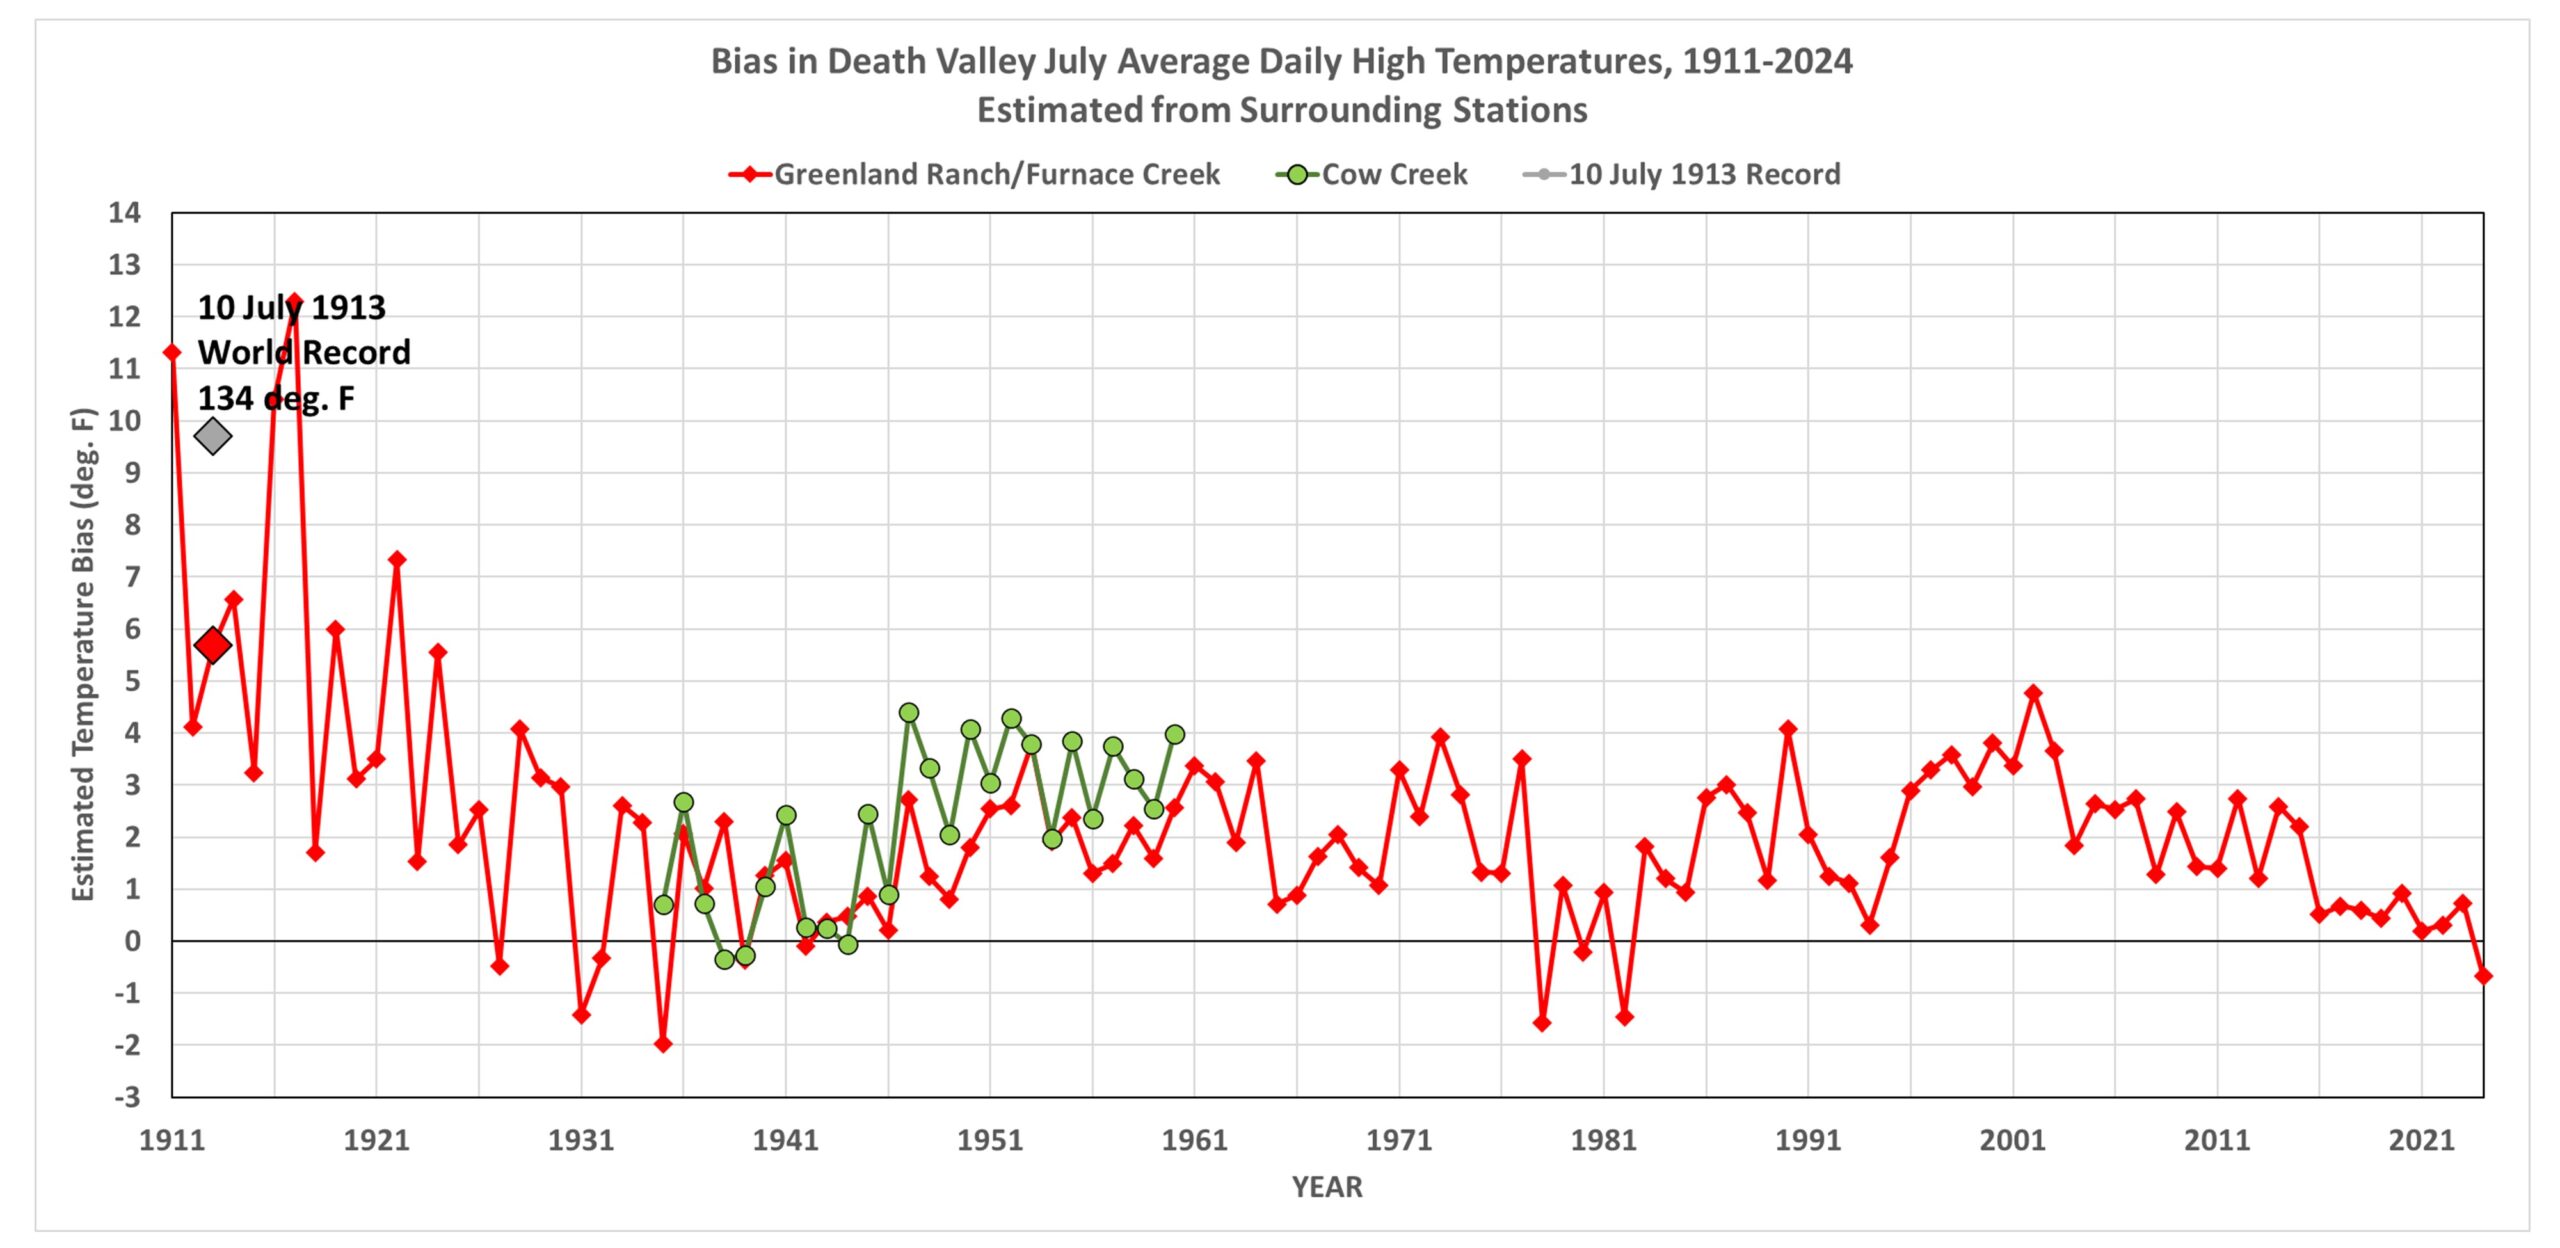
Finally, we can examine the difference between the reported July average temperatures in Death Valley from the GHCN data and the estimates from the surrounding stations (Fig. 3).
Fig. 3. Estimated biases in the official GHCN July-average temperatures in Death Valley, CA based upon comparison to Death Valley estimates made from all stations within 100 miles of Furnace Creek. The 1-2 deg. F average bias over most of the record might well not be an actual bias in the official measurements, but instead a bias in the method described.
Note the substantial warm biases in the temperatures reported at Greenland Ranch in the first 10-15 years after the USWB installed the instrumented shelter. Again, as Bill Reid surmises, the ranch foreman was likely reporting values from a different thermometer that had poor exposure, next to a building. Also shown in green are data from a nearby station (5 miles away, at essentially the same elevation) called Cow Creek. Note that in the most recent decade, the Death Valley temperature estimates from surrounding stations agree with those measured at the current Death Valley N.P. observation site.
The bottom line is that I believe there to be sufficient quantitative evidence to say that the 134 deg. F world record hottest temperature, still recognized by the WMO and NWS, is as much as 10 deg. F too warm, likely due to observer error. Again, for those interested in the history of Greenland Ranch (which includes the stories of those who died trying to escape the oppressive summer heat), read the fascinating history uncovered by Bill Reid, starting here.




 If warming has not accelerated in the past half century, where is the crisis? And,