
0 out of 10 based on 0 rating
via JoNova
July 26, 2025 at 10:00AM

Joe Oliver writes at Financial Post And suddenly, climate change hysteria is gone. Excerpts in italics with my bolds and added images.
Only 4% of Canadians think climate change is our top problem.
But many of them are hard-core activists ready to block projects.
Over the past several months, public concern about climate change has declined dramatically, replaced by newfound enthusiasm for the development of Canada’s vast oil and gas reserves. The federal government is now under mounting political pressure to expedite the construction of pipelines to tidewater that will bring economic growth, employment, energy security and funding for social programs or tax relief.
What caused the sharp reversal in public opinion?
And will the government actually deliver?
Prime Minister Mark Carney has long championed climate catastrophism and a commitment to net zero, both in his various jobs on the world stage and in his 2021 book, Values. After entering politics, however, he has embraced fossil fuels, and the legacy media have joined him in a head-spinning abandonment of its obsessive focus on global warming’s alleged existential threat to humanity. Whether Carney’s transformation reflects transitory political expediency or is an overdue acknowledgment of economic and scientific reality is now key to Canada’s economic prospects.

Over the past four decades, incessant advocacy from the scientific establishment, media and opinion leaders made first global warming and then climate change the consensus view. Deviation jeopardized reputations and careers, especially for scientists and academics, who risked losing funding or even their jobs. It was no surprise, then, that in 2022, 73 per cent of Canadians believed we were confronting a climate emergency. But now, according to a recent Leger poll, only four per cent say climate change is the number one issue facing Canada.

President Donald Trump’s shocking tariffs and 51st-state talk have diverted Canadians’ attention from climate change. And so have the exorbitant costs of green policies, the growing realization that nothing Canada does can measurably impact global temperatures, and the fact that green policies either weren’t adopted in many countries or have became politically toxic in countries where they were. Despite literally trillions of dollars being spent globally on reducing emissions, hydrocarbons still account for over 80 per cent of the world’s primary energy.
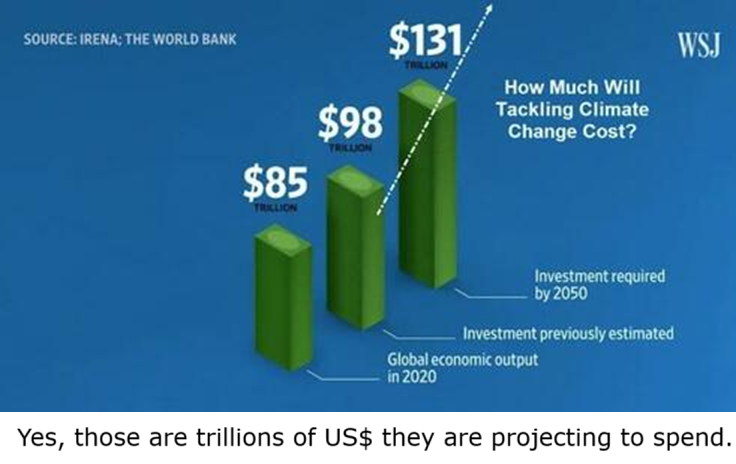
According to McKinsey, achieving net zero globally by 2050 would cost the Western countries a prohibitive $275-550 trillion. That makes it politically untenable.

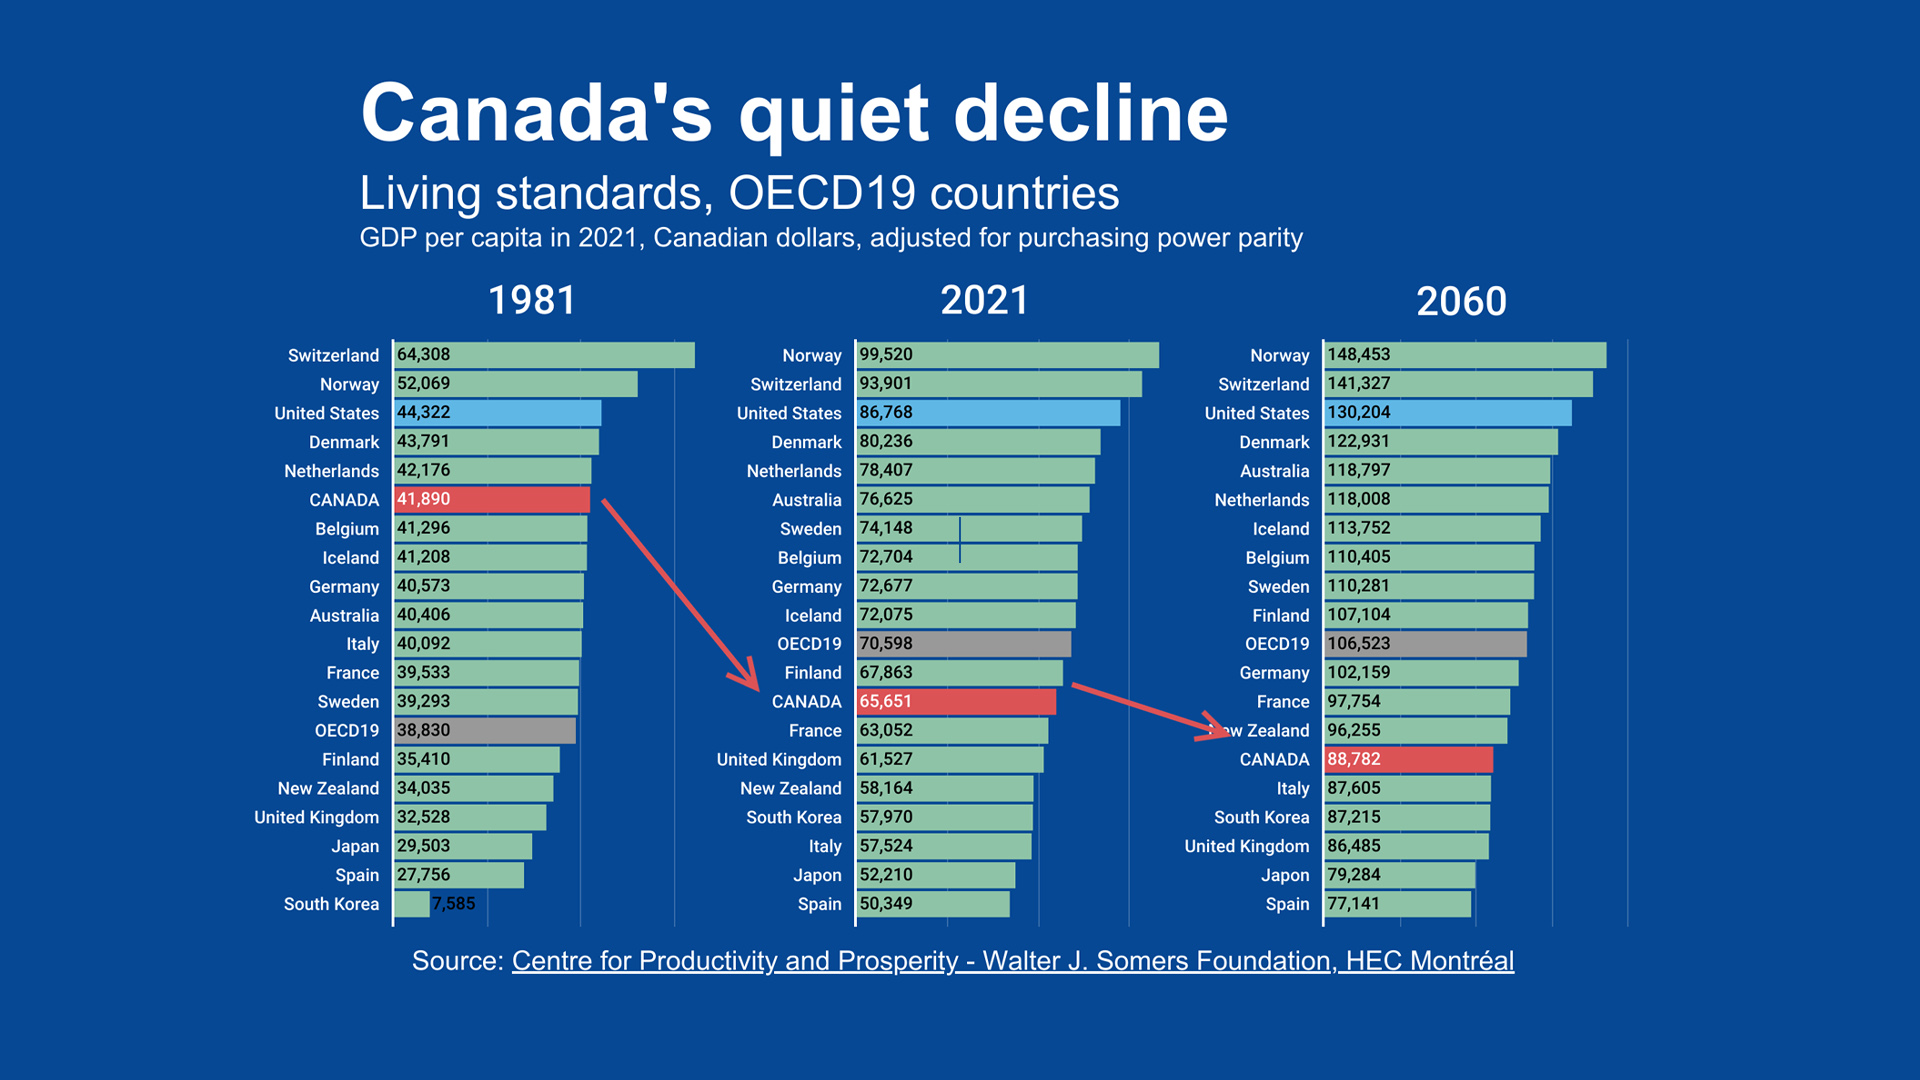
Wall Street Journal columnist Andy Kessler recently argued that green policies are largely responsible for European GDP falling from equal to American in 2008 to just two-thirds of it today. Soaring energy prices have led to de-industrialization, compounding the effects of high taxes and social spending, intrusive regulations and a protected workforce. Canada also, and for similar reasons, suffered a lost decade: growth of just half a per cent in real GDP per capita — compared with 20.7 per cent in the U.S.
And maybe the public has finally become skeptical of endless prophecies of impending disasters: “endangered” polar bears almost tripled in the past 50 years; hundreds of Pacific islands have increased in land size; death from extreme weather decreased by 99 per cent in the past 100 years; nine times as many people die from the cold as the heat; and so on. The Little Ice Age ended in the late 19th century with a gradual rise in temperatures — if not, we would still be in an ice age. Yet just 14 months ago, UN Climate Change Executive Secretary Simon Stiell said we had only two years to save the planet.

Future psychologists, economists and historians will examine the early 21st-century phenomenon of collective climate hysteria, what drove it, what ended it (if it has ended) and what damage it wrought. One thing is all but certain: there will be no admission of guilt for the enormous harm inflicted on Canada and other economies. Although the public has moved on, a hard-core group of climate militants is prepared to exploit every legal and regulatory impediment to resource development in Canada. The federal government will have to use all its legislative and executive authority to push the new energy projects it says it favours through to completion. Only then will Canadians know whether Mark Carney has truly changed his core beliefs.

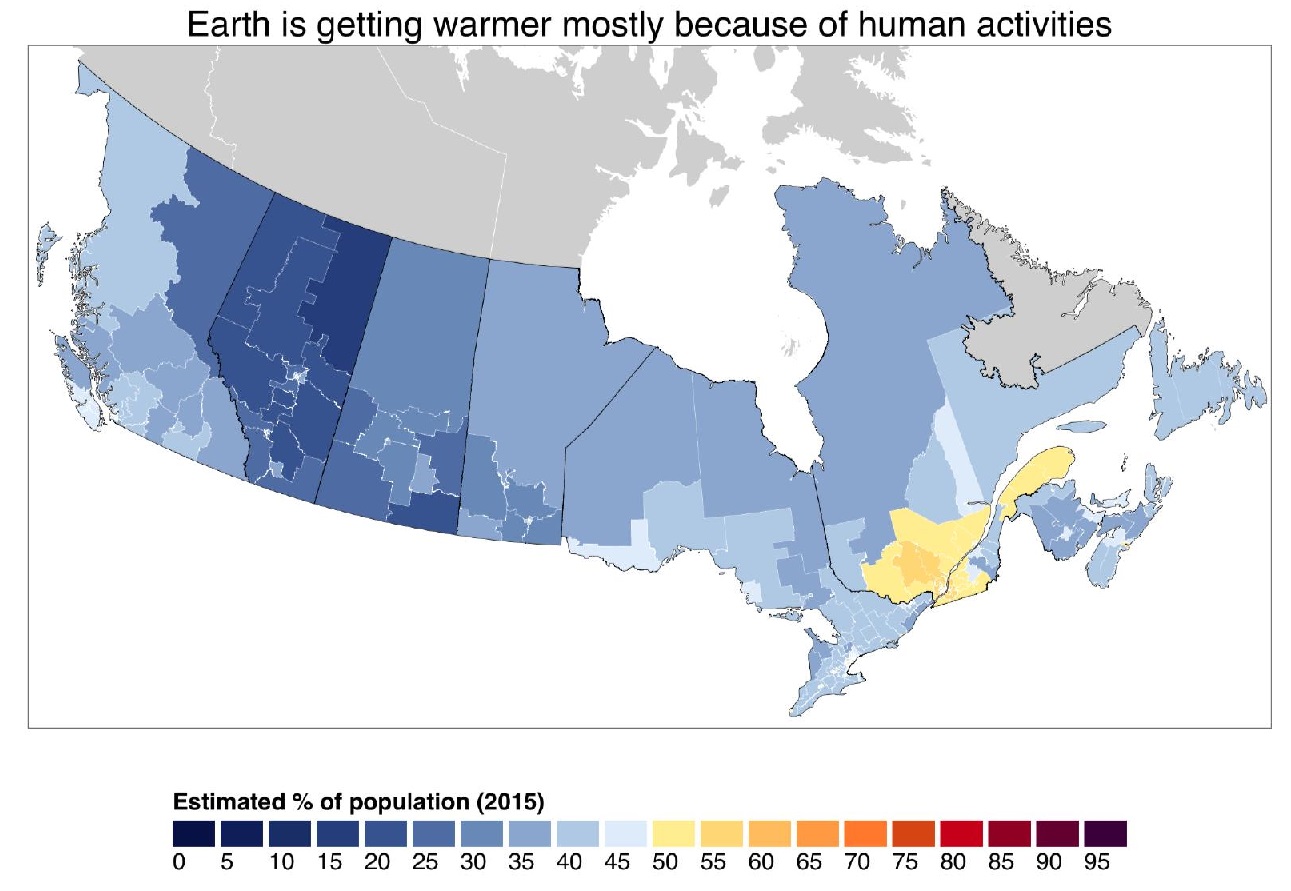
In 2015 Canadians were asked:
1. “From what you’ve read and heard, is there solid evidence that the average temperature on earth has been getting warmer over the past four decades?”
Yes
No
Don’t Know (volunteered)
2. [If yes, solid evidence] “Is the earth getting warmer mostly because of human activity such as burning fossil fuels or mostly because of natural patterns in the earth’s environment?”
Human Activity
Natural Patterns
Combination (volunteered)
Not sure / Refused (volunteered)
So the 79% who said there’s solid evidence of warming the last 40 years got a followup question: mostly caused by human activity or mostly natural? Slightly more than half said mostly human, thus a result of 44% believing both that it is warming and that humans are mostly to blame.
via Science Matters
July 26, 2025 at 09:47AM

54.72109 -6.81470 Met Office CIMO Assessed Class 5 Temperature records from 1/1/1989
Lough Fea weather station was originally solely a rain gauge site on original installation in 1965. A stevenson screen was added in 1988 for temperature readings as a World Meteorological Organisation reporting site. The above image is from September 2009 some 21 years after its establishment and I do wonder if any maintenance had ever been carried out for the Screen to have fallen into such a dismal state. This site shows typical poor location and maintenance of the Met Office that is completely unacceptable.
Pierre Gosselin runs the excellent blog No Tricks Zone. From his German aspect he recently highlighted the issue of stevenson Screen maintenance and a report detailing how failure to ensure their good upkeep has a significant effect on their readings accuracy. This is well worth a read as it demonstrates how a lack of basic site husbandry has surprising outcomes due to disrupting homogenisation algorithms applied by “Climate Scientists”. These algorithms are similar to those used in the Met Office’s construction of Long term climate averages stations for the years 1961 to 2020 and ongoing. Lough Fea is one of those stations despite only having temperature records for 31 of those 60 years from January 1989.
Essentially the report highlights the fact that if screens discolour through lack of maintenance their readings quality deteriorates setting a degraded standard. On subsequent improvement the prior degradation gets “built into” the system creating a step change and artificially raised comparative figures. None of such a problem could possibly occur with the Met Office because they say so.
“All weather stations are regularly monitored and inspected, with additional rigorous inspections conducted by a specialist team when a national weather record is potentially broken. These inspections assess site conditions, equipment calibration, and compliance with World Meteorological Organization (WMO) standards to ensure data reliability. Routine quality control also involves comparisons with neighboring sites to identify any deviations, and stations falling below required standards may have their data excluded from official records.“
The Met Office claims all its sites have an annual inspection so that leaves three options to infer from the terrible state of the screen. Firstly the evidence of the headline image is either a hoax by me (and Google StreetView), secondly such screen degradation happens in under 12 months or thirdly (and most likely ) the Met Office is being somewhat economical with the truth. Clearly the screen was not being maintained adequately and had fallen into a very poor state of repair distorting readings up to that point and then “baking in” those errors into an ongoing algorithm. This neglect has been common as often demonstrated by historical imagery such as at Banff and Faversham amongst others.
Considering the site location, this is Class 5 at its worst.

Rather than attempt to list the demerits of this site, I feel the opposite approach is easier – are there any possible grounds for claiming this site is remotely suitable? It sits at the end of the Lough but that is reasonably acceptable as these are typical of the area. However, I am struggling to see how all these roads and hardstanding, vehicles passing (and parking despite area restriction) and even motorised appliances operating within the enclosed area can be regarded as acceptable. There are multiple extraneous heat sources rendering the whole WMO reporting site totally unrepresentative and almost certainly prone to wild inaccuracies. The screen may now be white but the diesel powered orange portable pump in the background will really not be helping.

In my review of Carlisle I noted the Met Office had removed a “green cabinet” to reduce “heat sources”. This seems quite remarkable considering all the new “heavy metal” the Met Office has seen fit to construct directly alongside the screen at Lough Fea.

Obviously no data from Lough Fea will be included in any Surface Stations Project historical temperature reconstruction – that the Met Office has uses such corrupt data is a damning indictment of their behaviour.
via Tallbloke’s Talkshop
July 26, 2025 at 09:45AM
Guest Essay by Kip Hansen — 26 July 2025 — 1700 words
“High-fructose corn syrup ‘is just a formula for making you obese and diabetic,’ RFK Jr. has said.” [ source ] That’s the narrative in the Wild and Wacky World of Nutrition. It is based on the ever-present, ubiquitous, error of mistaking association and time-coincidence with causation.
“In 2004 Bray et al ( link ) published the hypothesis that HFCS is a direct causative factor for obesity. They based their hypothesis on a temporal relation between HFCS use and obesity rates between 1960 and 2000.” [ source ]
In that paper, this is the money graph:
[Extra points to readers who can see what was omitted from this graph – which omission substantially negates Bray’s hypothesis. ]
# # # # #
High-fructose corn syrup (HFCS) is just sugar.
When we use the word “sugar” in everyday language, what do we mean? Most of us mean “table sugar” – what white granular sugar that is in our sugar bowls, or comes in little packets at the café or in 5 pound bags from the grocery store.
And what is “table sugar”? It is sucrose.
There are lots of sugars in the natural world. A “ sugar”, in biochemistry, is “any of the class of soluble, crystalline, typically sweet-tasting carbohydrates found in living tissues and exemplified by glucose and sucrose.” There are several more sugars commonly found in foods: fructose, lactose, maltose, galactose.
Here’s a rundown of the most common sugars that humans ingest in their diets:
Sucrose: Chemical Formula – C12H22O11
This is our common white table sugar. It is the most used sweetener in foods and beverages. Sucrose is a compound sugar, a disaccharide, consisting of exactly 50% fructose and 50% glucose, one molecule of each bonded together.
Glucose: Chemical Formula – C6H12O6
Glucose is the most important source of energy in all organisms. Glucose circulates in the blood of animals as blood sugar. Dietary glucose can be directly absorbed and becomes then is often referred to as “blood sugar”.
Dextrose, also labelled D-glucose, is another name for glucose – they are the same molecule. D-glucose with water (H2O) becomes Dextrose monohydrate and is one of the two sugars that make up high-fructose corn syrup (HFCS ) [the other is fructose].
Fructose: Chemical Formula – C6H12O6
Fructose is often referred to as “fruit sugar” and is the sugar found in fruits and plants. It has the same chemical formula as glucose, but has a slightly different structure. The liver converts substantial portion of fructose into glucose for distribution in the bloodstream.
Lactose: Chemical Formula – C12H22O11
Lactose is a disaccharide composed of galactose and glucose. It has the same chemical formula as sucrose but has a slightly different structure. When found in mammal milks, it is commonly known as “milk sugar”.
Galactose: Chemical Formula – C6H12O6
Galactose is one of the sugars that make up the disaccharide lactose. It has the same chemical formula as fructose. It is sometimes itself referred to as “milk sugar”.
Maltose: Chemical Formula – C12H22O11
Maltose, or malt sugar, is a disaccharide formed from two units of glucose. It has the same chemical formula as lactose. It is found in sprouting seeds that have their sprouting stopped and then dried, known as malt. Malted barley is used to make beers and whiskeys, while other malted grains as used to make malted milk, malt vinegar and malt-flavored confections.
All of these sugars are metabolized and utilized by the body as sources of primary energy: mostly through the conversion to glucose. Dietary glucose needs no processing by the body and can be directly absorbed and enter the bloodstream as “blood sugar”, your body’s source of energy. Other sugars require some breakdown, or conversion, primarily into simple glucose.
[Note: This biological chemistry is far more complicated than this simple explanation but it suffices for this essay.]
“Dietary sugars are absorbed in the hepatic portal circulation [in the liver] as glucose, fructose, or galactose. The gut and liver are required to process fructose and galactose into glucose, lactate, and fatty acids.”
“Fatty Acids” sound bad to our ears; we have a bad image of both acids and fat. But, “Fatty acids (mainly in the form of triglycerides) are … the foremost storage form of fuel in most animals.” [ source ] Likewise, lactate, once considered “a waste by-product of anaerobic glycolysis [utilization of glucose in the muscles] with multiple deleterious effects”, is now better understood to be not only “a readily accessible fuel that is shuttled throughout the body but also a metabolic buffer ….it also acts as a multifunctional signaling molecule through receptors expressed in various cells and tissues.” [ source ]
Why this focus on sugars?
The War on Sugar is the nutrition science narrative which says “sugar is bad because we eat too much of it” — is then used to vilify food producers who use sugar in their products – positioned as unnecessary, too much, wrong kind – an endless attack on a substance that is not only innocent, but is a necessary part of the human metabolism and the main source of quick energy for most higher life forms on earth.
The War on Sugar has morphed into the War on Food (UPFs) (and here and here). Why do I think that the War of Food (specifically the hobby-horse of nutrition science vilifying so-called Ultra-processed Foods – UPFs) is a continuation, an extension, of the War on Sugar?
All of the anti-UPF studies have a commonality that looks like this:
All of the other categories are either slightly beneficial or “nothing done/no effect” as the hazard ratio uncertainty bars include one. I discuss this in detail in What Junk Nutrition Science Looks Like. In every research paper on so-called UPFs, the findings mirror the above chart of hazard ratios – the deleterious effects claimed for UPFs all derive from the over consumption of sugars of all types, usually represented by sugar-sweetened beverages and sweetened snack foods, which is associated with, but does not necessarily cause, over-weight and obesity and thus diabetes, and some effects from processed red meats ( see The Meat War). None of the other sub-categories of UPFs show any clinically significant negative effects at all.
The War on Food has been more than adequately covered here as linked above, but let’s drill down a little to see one major battlefield of those combined scientific wars : High Fructose Corn Syrup (HFCS).
High Fructose Corn Syrup (HFCS)
There are important things to know about High-Fructose Corn Syrup.
I’ll start by quoting the current information from the U.S. Food and Drug Administration (US FDA) “High Fructose Corn Syrup Questions and Answers”:
Corn Syrup is just glucose: “HFCS is derived from corn starch. Starch itself is a chain of glucose (a simple sugar) molecules joined together. When corn starch is broken down into individual glucose molecules, the end product is corn syrup, which is essentially 100% glucose. …. To make HFCS, enzymes are added to corn syrup in order to convert some of the glucose to another simple sugar called fructose, also called “fruit sugar” because it occurs naturally in fruits and berries.”
High-Fructose Corn Syrup is just fructose and glucose, approximately 50/50: “The most common forms of HFCS contain either 42 percent or 55 percent fructose….The rest of the HFCS is glucose and water. HFCS 42 is mainly used in processed foods, cereals, baked goods, and some beverages. HFCS 55 is used primarily in soft drinks. …. The proportion of fructose to glucose in both HFCS 42 and HFCS 55 is similar to that of sucrose.”
[Note: The ratio of fructose/glucose in HFCS is 42/53 or 55/42, both approximately 50/50. Other sugars make up the remaining 5 and 3 %s. Water is not included in the percentages. ]
How is HFCS different from our common table sugar, sucrose?: “Sucrose (sugar), the most well-known sweetener, is made by crystallizing sugar cane or beet juice. Sucrose is also made up of the same two simple sugars, glucose and fructose, joined together to form a single molecule containing one glucose molecule and one fructose molecule, an exact one-to-one ratio. …. In sucrose, a chemical bond joins the glucose and fructose. Once one eats, stomach acid and gut enzymes rapidly break down this chemical bond. … In HFCS, no chemical bond joins the glucose and fructose.”
Compared to table sugar, High-fructose Corn Syrup is either slightly lower in fructose than table sugar as HFCS 42 or slightly higher as HFCS 55. The FDA uses this language “The proportion of fructose to glucose in both HFCS 42 and HFCS 55 is similar to that of sucrose.”
As a note, for pure apple juice the ratio is generally about 66/34 fructose/glucose – much higher in fructose than either of the two standard HFCS formulations.
HFCS Bottom Line:
HFCS is just sugar water, with approximately the same ratio of fructose and glucose as table sugar (sucrose). “High-fructose corn syrup (HFCS) is a fructose-glucose liquid sweetener alternative to sucrose (common table sugar).” [ source ] Some HFCS is lower in fructose and some HFCS is higher in fructose when compared with table sugar. HFCS is a liquid, as the sugars are mixed with water.
With the basics covered here in Part 1, Part 2 will focus on the question:
If HFCS is just sugar water, with a similar composition to table sugar, why is it vilified?
# # # # #
Author’s Comment:
As with other Science Wars, this topic is just too complex and complicated to cover in under 1500 words, thus I have spilt it into two parts: this introduction which will be followed shortly by a dissection of the “science” that has been used to turn HFCS into a villain.
I have long held that human nutrition, as a subject, is one field of science that suffers the most from fads, based on poor science, which become self-perpetuating and self-reinforcing: unproven hypothesis becoming ‘facts’ by simple repetition.
Please limit your comments to the materials presented in this, Part 1, of this essay. HFCS is at the center of a swirling controversy with opinions varying wildly. In Part 2, I will cover the studies that have been produced about HFCS.
Thanks for reading.
# # # # #
Subscribe to get the latest posts sent to your email.
via Watts Up With That?
July 26, 2025 at 08:01AM
