Category: Daily News

BOMBSHELL: Study Reveals Climate Warming Driven by Receding Cloud Cover

The recent paper by Tselioudis et al., titled “Contraction of the World’s Storm-Cloud Zones the Primary Contributor to the 21st Century Increase in the Earth’s Sunlight Absorption”, is a fascinating—and deeply problematic—addition to the climate science canon. It offers yet another reminder that so-called “settled science” in climate modeling is anything but settled. In fact, it inadvertently illustrates how fragile the predictive power of climate models is, especially when fundamental atmospheric processes like cloud coverage are shown to be both more dynamic and less understood than previously claimed.

Not that any of this is news to WUWT readers. Dr. Roy Spencer has been noting almost identical observations for over a decade as noted here,

Now let’s look at the broader scientific community catching up to Dr. Spencer.

Abstract

Recent Earth energy budget observations show an increase in the sunlight absorbed by the Earth of 0.45 W/m2 per decade, caused primarily by a decrease in cloud reflection. Here we decompose the solar radiative budget trends into general circulation and cloud controlling process components. Regimes representing the midlatitude and tropical storm zones are defined, and the trends in the areal coverage of those regimes which are potentially induced by circulation changes are separated from trends in the cloud radiative effect within each regime which are potentially induced by changes in local cloud controlling processes. The regime area change component, which manifests itself as a contraction of the midlatitude and tropical storm regimes, constitutes the largest contribution to the solar absorption trend, causing decreased sunlight reflection of 0.37 W/m2 per decade. This result provides a crucial missing piece in the puzzle of the 21st century increase of the Earth’s solar absorption.

Key Points

  • Satellite observations show that in the past 24 years the worlds storm cloud zones have been contracting at a rate of 1.5%–3% per decade
  • This contraction allows more solar radiation to reach the Earth’s surface and constitutes the largest contribution to the observed 21st century trend of increased solar absorption

Plain Language Summary

Analysis of satellite observations shows that in the past 24 years the Earth’s storm cloud zones in the tropics and the middle latitudes have been contracting at a rate of 1.5%–3% per decade. This cloud contraction, along with cloud cover decreases at low latitudes, allows more solar radiation to reach the Earth’s surface. When the contribution of all cloud changes is calculated, the storm cloud contraction is found to be the main contributor to the observed increase of the Earth’s solar absorption during the 21st century.

To understand the full implications of this study, we need to parse its findings in plain terms. The paper concludes that the Earth has absorbed significantly more solar radiation over the past 24 years—0.45 W/m² per decade. The primary culprit? A reduction in cloud cover, specifically a contraction of the midlatitude and tropical storm-cloud zones. This change has resulted in less solar radiation being reflected back into space and more being absorbed by the Earth’s surface. Crucially, 0.37 W/m² of this uptick is attributed solely to this contraction in cloud coverage, a result of large-scale atmospheric circulation changes:

“This cloud contraction, along with cloud cover decreases at low latitudes, allows more solar radiation to reach the Earth’s surface. When the contribution of all cloud changes is calculated, the storm cloud contraction is found to be the main contributor to the observed increase of the Earth’s solar absorption during the 21st century.”

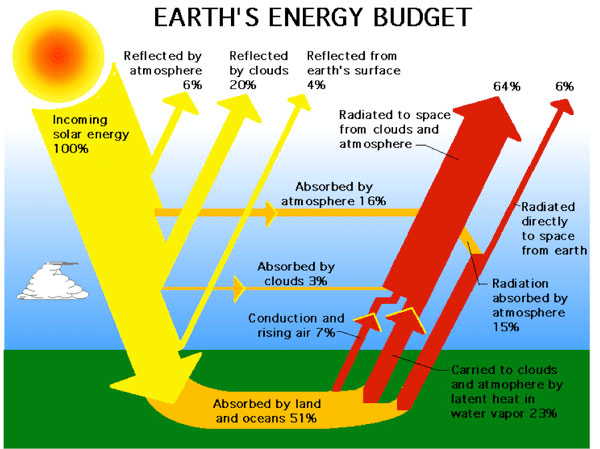
Let’s pause there. Climate science has long emphasized the role of anthropogenic greenhouse gases—especially CO2—in trapping outgoing longwave radiation, contributing to surface warming. Yet here we have empirical satellite observations showing that changes in shortwave radiation absorption, due to cloud dynamics, dominate recent trends in Earth’s energy imbalance. That revelation alone should be enough to shake the very foundations of climate policy, which has funneled trillions into carbon control with scant attention paid to cloud feedback mechanisms.

More damning still is the admission that these changes are likely tied to “general circulation shifts,” specifically poleward movements of storm tracks and contractions of the Intertropical Convergence Zone (ITCZ). These are phenomena long suspected in model projections but never given such a central, quantifiable role in the planetary energy budget. And here’s the kicker: these circulation shifts are said to have emerged gradually, to the tune of 1.3% to 3% per decade:

“In all three zones, the area coverage of the L‐TCC regime shows statistically significant decreases with extremes of 1.84 ± 0.38% to 3.20 ± 0.97% per decade… indicating a contraction of the midlatitude storm regions and a narrowing of the ITCZ region.”

These aren’t theoretical projections—they are based on hard satellite data from the MODIS and CERES instruments. Models, by contrast, have only roughly hinted at these changes, and often fail to reproduce them with consistency.

The paper outlines that most of the shortwave cloud radiative effect (SWCRE) change—the key measure of how much solar energy is reflected by clouds—comes not from changes in cloud properties themselves, but from the shrinking geographic area of major cloud regimes:

“In all zones, the dominant trend is the SW cloud radiative warming that is coming from the contraction of the S‐SWCRE regimes and the corresponding expansion of the W‐SWCRE regimes.”

That’s the kind of subtle, high-leverage feedback mechanism that models tend to get wrong or underrepresent entirely. And that’s a problem. Because if your model can’t accurately simulate cloud regime shifts—which appear to contribute more than 80% of the increase in solar absorption—then your forecasts for future warming are at best incomplete, and at worst, wildly misleading.

Tselioudis et al. even admit this shortcoming, noting:

“It is imperative to test the skills of climate models in simulating the observed storm‐cloud area contraction, and to use both modeling and observational analyses to understand the interactions between atmospheric dynamics shifts and storm cloud changes.”

That’s bureaucratese for “we didn’t see this coming, and we’re not sure our models can catch up.” It’s reminiscent of NASA’s Gavin Schmidt’s recent handwringing over 2023’s “unexplainable” heat spike, suggesting that “we could be in uncharted territory.” Now, we have the chart. And it doesn’t point toward CO2 alone—it points to dynamic, cloud-driven changes that no carbon tax will stop.

What this paper also inadvertently confirms is the unreliability of using long-term climate models to dictate aggressive, disruptive policies like Net Zero. The models are missing key physical processes—cloud behavior, aerosol effects, and large-scale atmospheric shifts. As the paper notes:

“The general circulation shift component constitutes the dominant term of the recent increase in absorbed solar radiation and provides a crucial missing piece in the puzzle of the 21st century radiative warming and the large heat anomaly of 2023.”

Yet these shifts are only just beginning to be understood, and their driving forces—whether natural variability, solar activity, ocean cycles, or some interaction thereof—remain far from nailed down.

Worse still, the authors openly speculate that low-latitude cloud reductions could be driven by aerosol changes—particularly the decline in ship emissions:

“This component shows a significant cloud radiative warming of 0.21 W/m²/decade that can be attributed to aerosol indirect effects on clouds including effects from the reduction of aerosol ship emissions.”

That’s right: the same well-meaning efforts to reduce pollution from ocean-going vessels may have accelerated warming by allowing more sunlight to hit the surface. Climate mitigation whack-a-mole strikes again.

In sum, Tselioudis et al.’s paper is a quietly revolutionary work—not because it introduces a new alarmist narrative, but because it destabilizes the prevailing one. It shows that:

  • Cloud feedbacks, especially those driven by circulation shifts, have enormous and previously underestimated impacts on Earth’s radiative balance.
  • These changes are driven by complex, poorly understood dynamics that current climate models struggle to replicate.
  • Policy decisions predicated on “settled science” have been made in the absence of understanding a major component of the Earth’s energy system.

If climate science were a functioning scientific discipline rather than a priesthood, this paper would trigger a major course correction. It would cast doubt on the simplistic link between CO2 and warming, redirecting focus toward cloud physics, ocean-atmosphere interactions, and circulation dynamics. It would foster humility in the face of atmospheric complexity—not arrogance born from model outputs.

But don’t expect that anytime soon. Instead, expect the usual suspects to spin this as evidence of “even worse than we thought” warming, conveniently omitting the part where their models didn’t predict it and their policies had nothing to do with it.

In the meantime, this paper should serve as ammunition for any skeptic pointing out the absurdity of building trillion-dollar policies on the backs of incomplete and overconfident simulations. The cloud regimes are shifting. The models aren’t keeping up. And neither is the narrative.


Discover more from Watts Up With That?

Subscribe to get the latest posts sent to your email.

via Watts Up With That?

https://ift.tt/Wdbhp4V

June 23, 2025 at 04:05PM

STEVE MILLOY: Trump Closes Notorious EPA Lab That Conducted Illegal Human Experiments

From THE DAILY CALLER

Daily Caller News Foundation

Steve Milloy
Contributor

President Trump is trying to save money by terminating leases on facilities used by federal agencies. One of these is EPA’s Human Studies Facility located at the University of North Carolina-Chapel Hill. “Scientists are trying to save it,” reports Nature magazine. But being a waste of money is the least interesting aspect of the infamous lab.

In 2011, through the Freedom of Information Act (FOIA), I exposed the lab’s illegal experimentation on humans with air pollutants that EPA considers to be deadly. The lab’s central feature is an actual gas chamber into which EPA pumped exhaust from a diesel truck idling outside in a parking lot. You can see a photo of the twisted arrangement here.

After filtering out the carbon monoxide, EPA concentrated the exhaust’s fine particulate matter (soot, called “PM2.5” by EPA) to unrealistically high levels and pumped it into the chamber in which human guinea pigs inhaled it for periods of two hours. The purpose of the experiments was to observe the effects, if any, of inhaling PM2.5. For these experiments, EPA had recruited: asthmatics; people with heart disease and diabetes; and elderly persons up to 80 years of age. EPA paid its human guinea pigs as much as a couple thousand dollars for their participation in the experiments. (RELATED: ‘How Is That Zero Evidence?’: Trump EPA Chief Dresses Down Legacy Media During Fiery Press Conference)

All this may seem harmless enough. But was it? EPA had previously concluded that PM2.5 was, essentially, the most toxic substance known to man. Any inhalation could cause death within hours, the agency had determined.  It had also stated that the people most at risk from inhaling PM2.5 were: asthmatics; people with heart disease and diabetes; and the elderly. Those at risk from PM2.5 were the very sort of people upon whom it had been experimenting.

But EPA had not disclosed any of this to, and so did not obtain legally required “informed consent” from its human guinea pigs. Instead of informing its human guinea pigs in writing that the agency believed the experiments could kill them, as was required by federal regulations, state law and the Nuremberg Code on human experimentation, the agency’s consent forms only disclosed that some temporary coughing or wheezing may result from the experiments.

Upon learning of the horrific experiments, a group to which I belonged sued the agency in federal court to stop them. The documents filed by EPA in response to our lawsuit revealed some shocking facts and admissions.

In an affidavit filed with the court, an EPA employee stated that he verbally warned the human guinea pigs: “There is a possibility you may die from this [experiment].” Although such important information would have had to be disclosed, and consent obtained in writing (versus merely verbally), it has simply been illegal since the discovery of the Nazi concentration camp research to risk human lives in non-therapeutic medical experiments. Conducting experiments for the purpose of issuing regulations clearly falls outside of that exception.

In the Department of Justice memorandum filed on behalf of the agency, EPA made the shocking admissionthat, in fact, the science (i.e., epidemiology studies) that it relied on to conclude that PM2.5 was deadly, wasn’t actually sufficient scientifically for making its PM2.5 claims. In fact, the reason the EPA was conducting the human experiments, it admitted, was to develop biological evidence or plausibility to back up the lethality of PM2.5 it told the public the epidemiology studies indicated. This meant that EPA was trying to harm (kill?) the patients to back up its mere hypothesis about the lethality of PM2.5.

Fortunately for EPA, it could also admit that no one had been harmed by PM2.5 in its experiments, which failed to elicit a cough or a wheeze among the hundreds of allegedly “vulnerable” human guinea pigs it tried to harm.

The court eventually dismissed our lawsuit for lack of standing, not on the merits. It ruled that only the human guinea pigs could bring such a lawsuit, a bizarre outcome since EPA had lied to them about what it was doing in the first place. But EPA’s conduct had been exposed to the world and the agency was shamed into halting the illegal experiments. The agency tried to rehabilitate itself with subsequent white wash investigations by its own Inspector General and the National Academy of Sciences. But neither effort was successful.

Fast forward to today and there have been real world consequences to EPA’s illegal experiments and the Trump EPA must address them to implement its deregulatory agenda.

PM2.5 has been the most powerful regulatory weapon of the Clinton, Obama and Biden EPAs. The Obama-Biden and, later, the Biden-Harris war-on-coal air quality rules for greenhouse gases and mercury emissions all actually depend on the validity of its PM2.5 claims. Just this week, the Trump EPA announced it was going to roll back those two rules.

When first issued by the Obama and Biden EPAs, the regulations couldn’t survive a standard cost-benefit analysis with respect to greenhouse gas or mercury emissions. To make the rules politically defensible cost-benefit-wise, the agency claimed that by reducing coal plant greenhouse gas and mercury emissions, the new rules would also reduce emissions of PM2.5.  Given that EPA had claimed that PM2.5 killed about 570,000 Americans per year and the agency valued each death $10 million, there has been no regulatory cost that could balance, much less overcome, the claimed benefits of the rules.

But EPA’s PM2.5 claims were all lies. We now know that because of the illegal human experiments and our lawsuit. Closing the infamous lab is great start. But the EPA should apply the results of the human experiments controversy to shut down the EPA’s many PM2.5-based regulatory abuses.

Steve Milloy is a biostatistician and lawyer, publishes JunkScience.com and is on X @JunkScience.

The views and opinions expressed in this commentary are those of the author and do not reflect the official position of the Daily Caller News Foundation.

All content created by the Daily Caller News Foundation, an independent and nonpartisan newswire service, is available without charge to any legitimate news publisher that can provide a large audience. All republished articles must include our logo, our reporter’s byline and their DCNF affiliation. For any questions about our guidelines or partnering with us, please contact licensing@dailycallernewsfoundation.org.


Discover more from Watts Up With That?

Subscribe to get the latest posts sent to your email.

via Watts Up With That?

https://ift.tt/HgdeEls

June 23, 2025 at 12:02PM

2025 Evidence of Nature’s Sunscreen

Greenhouse with adjustable sun screens to control warming.

2025 Updated Report on Global Dimming and Brightening Worldwide and in China 

Martin Wild et al published April 2025 A Perspective on Global Dimming and Brightening Worldwide and in China. Excerpts in italics with my bolds and added images.

Abstract

Worldwide radiation records suggest that the amount of sunlight received at the Earth’s surface (surface solar radiation, SSR) has not been stable over the years, but underwent significant decadal variations, popularly also known as “global dimming and brightening”. These variations have been particularly evident in China, where the SSR substantially declined from the 1960s to the 1990s (dimming), with indications for a trend reversal in the 2000s and a slight recovery (brightening) in recent years. This perspective/review paper will discuss recent updates and remaining challenges regarding our knowledge of the magnitudes, causes, and implications of these variations in SSR worldwide, with a particular emphasis on the developments in China.

Fig. 1. Qualitative tendencies in decadal SSR changes over theperiods 1950s to 1980s, 1980s to 2000, and post-2000 in different world regions that are well covered by historic SSR records.

Recent developments include the use of machine learning methods to spatially and temporally augment the limited worldwide in-situ SSR observational records (Yuan et al.,2021; Jiao et al., 2023). These methods generate spatially complete SSR datasets over the entire land surface (Fig. 2). Figure 2 shows some characteristic features of SSR trends during the 1985−2019 “brightening period”, such as the substantial brightening over Europe and the continuous dimming in India. It remains a challenge to fully assess the reliability of the trends of these machine learning-based estimations, particularly in regions that lack the constraints of in-situ radiation observations.

Fig. 2. Worldwide linear trends of the annual average SSR during the “brightening” period of 1985–2019 based on ground observations spatially augmented by machine learning methods [Reprinted from Yuan et al. (2021), © American Meteorological Society. Used with permission.]

Impacts in China

A number of studies have shown that changes in SSR have affected warming rates in China, particularly in terms of the mean and maximum 2-m air temperatures. Daily maximum temperatures were shown to increase less than daily minimum temperatures in China since the 1960s, particularly in the decades of strongest dimming, indicative of a dampening effect of SSR dimming, particularly on the daily maximum temperature warming rates most directly affected by SSR changes (Wang et al., 2012a; Du et al., 2017; Zhao et al., 2021). The evolution of daily maximum land surface (Ts-max) and 2-m air (Ta-max) temperatures averaged over China from the 1960s to 2003 is illustrated in Fig. 5 in terms of their annual means and the means of the warm and cold seasons (from Du et al., 2017).

Fig. 5. China-mean anomalies of daily maximum land surface temperature (Ts-max, blue line) and daily maximum air temperature (Ta-max, red line) for the (a) entire year, (b) warm season (May−October), and (c) cold season (November−April) with respect to the reference period 1961–90,based on 1977 stations [Reprinted from Du et al. (2017).]

Previous Post  Hard Evidence of Solar Impact upon Earth Cloudiness

Later on is a reprinted discussion of global dimming and brightness resulting from fluctuating cloud cover.  This is topical because of new empirical research findings coming out of Asia.  H/T GWPF.  A study published by Kobe University research center is Revealing the impact of cosmic rays on the Earth’s climate.  Excerpts in italics with my bolds.

New evidence suggests that high-energy particles from space known as galactic cosmic rays affect the Earth’s climate by increasing cloud cover, causing an “umbrella effect”.

When galactic cosmic rays increased during the Earth’s last geomagnetic reversal transition 780,000 years ago, the umbrella effect of low-cloud cover led to high atmospheric pressure in Siberia, causing the East Asian winter monsoon to become stronger. This is evidence that galactic cosmic rays influence changes in the Earth’s climate. The findings were made by a research team led by Professor Masayuki Hyodo (Research Center for Inland Seas, Kobe University) and published on June 28 in the online edition of Scientific Reports.

The Svensmark Effect is a hypothesis that galactic cosmic rays induce low cloud formation and influence the Earth’s climate. Tests based on recent meteorological observation data only show minute changes in the amounts of galactic cosmic rays and cloud cover, making it hard to prove this theory. However, during the last geomagnetic reversal transition, when the amount of galactic cosmic rays increased dramatically, there was also a large increase in cloud cover, so it should be possible to detect the impact of cosmic rays on climate at a higher sensitivity.

(The Svenmark Effect is explained in essay The cosmoclimatology theory)

How Nature’s Sunscreen Works (from Previous Post)

A recent post Planetary Warming: Back to Basics discussed a recent paper by Nikolov and Zeller on the atmospheric thermal effect measured on various planets in our solar system. They mentioned that an important source of temperature variation around the earth’s energy balance state can be traced to global brightening and dimming.

This post explores the fact of fluctuations in the amount of solar energy reflected rather than absorbed by the atmosphere and surface. Brightening refers to more incoming solar energy from clear and clean skies. Dimming refers to less solar energy due to more sunlight reflected in the atmosphere by the presence of clouds and aerosols (air-born particles like dust and smoke).

The energy budget above from ERBE shows how important is this issue. On average, half of sunlight is either absorbed in the atmosphere or reflected before it can be absorbed by the surface land and ocean. Any shift in the reflectivity (albedo) impacts greatly on the solar energy warming the planet.

The leading research on global brightening/dimming is done at
the Institute for Atmospheric and Climate Science of ETH Zurich,
led by Dr. Martin Wild, senior scientist specializing in the subject.

Special instruments have been recording the solar radiation that reaches the Earth’s surface since 1923. However, it wasn’t until the International Geophysical Year in 1957/58 that a global measurement network began to take shape. The data thus obtained reveal that the energy provided by the sun at the Earth’s surface has undergone considerable variations over the past decades, with associated impacts on climate.

The initial studies were published in the late 1980s and early 1990s for specific regions of the Earth. In 1998 the first global study was conducted for larger areas, like the continents Africa, Asia, North America and Europe for instance.

Now ETH has announced The Global Energy Balance Archive (GEBA) version 2017: A database for worldwide measured surface energy fluxes. The title is a link to that paper published in May 2017 explaining the facility and some principal findings. The Archive itself is at  http://www.geba.ethz.ch.

For example, Figure 2 below provides the longest continuous record available in GEBA: surface downward shortwave radiation measured in Stockholm since 1922. Five year moving average in blue, 4th order regression model in red. Units Wm-2. Substantial multidecadal variations become evident, with an increase up to the 1950s (“early brightening”), an overall decline from the 1950s to the 1980s (“dimming”), and a recovery thereafter (“brightening”).
Figure 5. Composite of 56 European GEBA time series of annual surface downward shortwave radiation (thin line) from 1939 to 2013, plotted together with a 21 year Gaussian low-pass filter ((thick line). The series are expressed as anomalies (in Wm-2) from the 1971–2000 mean. Dashed lines are used prior to 1961 due to the lower number of records for this initial period. Updated from Sanchez-Lorenzo et al. (2015) including data until December 2013.
Martin Wild explains in a 2016 article Decadal changes in radiative fluxes at land and ocean surfaces and their relevance for global warming. From the Conclusion (SSR refers to solar radiation incident upon the surface)

However, observations indicate not only changes in the downward thermal fluxes, but even more so in their solar counterparts, whose records have a much wider spatial and temporal coverage. These records suggest multidecadal variations in SSR at widespread land-based observation sites. Specifically, declining tendencies in SSR between the 1950s and 1980s have been found at most of the measurement sites (‘dimming’), with a partial recovery at many of the sites thereafter (‘brightening’).

With the additional information from more widely measured meteorological quantities which can serve as proxies for SSR (primarily sunshine duration and DTR), more evidence for a widespread extent of these variations has been provided, as well as additional indications for an overall increasing tendency in SSR in the first part of the 20th century (‘early brightening’).

It is well established that these SSR variations are not caused by variations in the output of the sun itself, but rather by variations in the transparency of the atmosphere for solar radiation. It is still debated, however, to what extent the two major modulators of the atmospheric transparency, i.e., aerosol and clouds, contribute to the SSR variations.

The balance of evidence suggests that on longer (multidecadal) timescales aerosol changes dominate, whereas on shorter (decadal to subdecadal) timescales cloud effects dominate. More evidence is further provided for an increasing influence of aerosols during the course of the 20th century. However, aerosol and clouds may also interact, and these interactions were hypothesized to have the potential to amplify and dampen SSR trends in pristine and polluted areas, respectively.

No direct observational records are available over ocean surfaces. Nevertheless, based on the presented conceptual ideas of SSR trends amplified by aerosol–cloud interactions over the pristine oceans, modeling approaches as well as the available satellite-derived records it appears plausible that also over oceans significant decadal changes in SSR occur.

The coinciding multidecadal variations in SSTs and global aerosol emissions may be seen as a smoking gun, yet it is currently an open debate to what extent these SST variations are forced by aerosol-induced changes in SSR, effectively amplified by aerosol– cloud interactions, or are merely a result of unforced natural variations in the coupled ocean atmosphere system. Resolving this question could state a major step toward a better understanding of multidecadal climate change.

Another paper co-authored by Wild discusses the effects of aerosols and clouds The solar dimming/brightening effect over the Mediterranean Basin in the period 1979 − 2012. (NSWR is Net Short Wave Radiation, that is equal to surface solar radiation less reflected)

The analysis reveals an overall increasing trend in NSWR (all skies) corresponding to a slight solar brightening over the region (+0.36 Wm−2per decade), which is not statistically significant at 95% confidence level (C.L.). An increasing trend(+0.52 Wm−2per decade) is also shown for NSWR under clean skies (without aerosols), which is statistically significant (P=0.04).

This indicates that NSWR increases at a higher rate over the Mediterranean due to cloud variations only, because of a declining trend in COD (Cloud Optical Depth). The peaks in NSWR (all skies) in certain years (e.g., 2000) are attributed to a significant decrease in COD (see Figs. 9 and 10), whilethe two data series (NSWRall and NSWRclean) are highly correlated(r=0.95).

This indicates that cloud variation is the major regulatory factor for the amount and multi-decadal trends in NSWR over the Mediterranean Basin. (Note: Lower cloud optical depth is caused by less opaque clouds and/or decrease in overall cloudiness)

On the other hand, the results do not reveal a reversal from dimming to brightening during 1980s, as shown in several studies over Europe (Norris and Wild, 2007;Sanchez-Lorenzoet al., 2015), but a rather steady slight increasing trend in solar radiation, which, however, seems to be stabilized during the last years of the data series, in agreement with Sanchez-Lorenzo et al. (2015). Similarly, Wild (2012) reported that the solar brightening was less distinct at European sites after 2000 compared to the 1990s.

In contrast, the NSWR under clear (cloudless) skies shows a slight but statistically significant decreasing trend (−0.17 Wm−2per decade,P=0.002), indicating an overall decrease in NSWR over the Mediterranean due to water-vapor variability suggesting a transition to more humid environment under a warming climate.

Other researchers find cloudiness more dominant than aerosols. For example, The cause of solar dimming and brightening at the Earth’s surface during the last half century: Evidence from measurements of sunshine duration by Gerald Stanhill et al.

Analysis of the Angstrom-Prescott relationship between normalized values of global radiation and sunshine duration measured during the last 50 years made at five sites with a wide range of climate and aerosol emissions showed few significant differences in atmospheric transmissivity under clear or cloud-covered skies between years when global dimming occurred and years when global brightening was measured, nor in most cases were there any significant changes in the parameters or in their relationships to annual rates of fossil fuel combustion in the surrounding 1° cells. It is concluded that at the sites studied changes in cloud cover rather than anthropogenic aerosols emissions played the major role in determining solar dimming and brightening during the last half century and that there are reasons to suppose that these findings may have wider relevance.

Summary

The final words go to Martin Wild from Enlightening Global Dimming and Brightening.

Observed Tendencies in surface solar radiation
Figure 2.  Changes in surface solar radiation observed in regions with good station coverage during three periods.(left column) The 1950s–1980s show predominant declines (“dimming”), (middle column) the 1980s–2000 indicate partial recoveries (“brightening”) at many locations, except India, and (right column) recent developments after 2000 show mixed tendencies. Numbers denote typical literature estimates for the specified region and period in W m–2 per decade.  Based on various sources as referenced in Wild (2009).

The latest updates on solar radiation changes observed since the new millennium show no globally coherent trends anymore (see above and Fig. 2). While brightening persists to some extent in Europe and the United States, there are indications for a renewed dimming in China associated with the tremendous emission increases there after 2000, as well as unabated dimming in India (Streets et al. 2009; Wild et al. 2009).

We cannot exclude the possibility that we are currently again in a transition phase and may return to a renewed overall dimming for some years to come.

One can’t help but see the similarity between dimming/brightening and patterns of Global Mean Temperature, such as HadCrut.

Footnote: For more on clouds, precipitation and the ocean, see Here Comes the Rain Again

via Science Matters

https://ift.tt/Y8Mn7uB

June 23, 2025 at 11:17AM

New Study: The Cloud Radiative Effect Is The ‘Crucial Missing Piece’ Explaining 21st Century Warming

Another observational analysis finds the shortwave effect of clouds is the “the dominant term of the recent increase in absorbed solar radiation” explaining 2001-2024 warming.

According to the authors of a new study, clouds are the primary modulators of the Earth’s shortwave and longwave radiation. Thus, the radiative effects of clouds “play a crucial role in determining the Earth’s energy balance” and “dominate the radiative balance trends.”

Satellite observations indicate that from 2001-2024 there was a 0.45 W/m² per decade increase in solar radiation reaching the Earth’s surface. This 1 W/m² rising trend in absorbed solar radiation was primarily caused by declining cloud cover.

“The increase in the absorbed solar radiation is driven primarily by a decrease in the reflection of SW radiation by clouds.”

The shortwave cloud radiative effect (SWCRE) is thus regarded as the “crucial missing piece” in explaining 21st century warming.

“[C]hanges of only a few percent in the relative coverage of the [cloud] regimes produce large cloud radiative signatures that can dominate the radiative balance trends”

Image Source: Tselioudis et al., 2025

via NoTricksZone

https://ift.tt/kadEsVx

June 23, 2025 at 09:17AM