The EPA shows a large increase in US burn area. Climate Change Indicators: Wildfires | US EPA The National Climate Assessment shows the same thing. Full Report | Fourth National Climate Assessment They mysteriously forgot to graph all the years … Continue reading →
Recent reports in Politico and The Guardian make a now-familiar but false claim: California’s wildfires, particularly the devastating events around Los Angeles, are evidence of an accelerating “climate crisis.” The claims made in these stories are false. Data do not show wildfires are getting worse. The stories rely on oversimplified, headline-grabbing narratives that blame climate change without examining other critical variables. In addition, they continue to make the most basic mistake of conflating weather events with long-term climate change.
California’s landscapes have evolved alongside fire for millennia. Long before industrialization, periodic wildfires swept through these ecosystems, clearing out excess vegetation and promoting biodiversity. This is not conjecture, rather it is well-documented in history. Native American tribes understood this and used controlled burns to manage the land.
The problem today is not that California has fires—it always has. The problem is that modern fire suppression policies disrupted this natural cycle. For much of the 20th century, aggressive efforts to extinguish all fires, combined with the abandonment of Indigenous fire management techniques, allowed vegetation and underbrush to accumulate to dangerous levels. Other factors include a shift in forest management philosophy leading to decline in logging, resulting in overgrown forests with build-up of fuel, and increasing numbers of people moving to areas historically prone to wildfires. This surplus fuel creates the conditions for catastrophic fires and the increased population and all the buildings that come with them, leads to greater tragedy and cost when fires occur. Climate Realism has discussed these facts on multiple occasions, here, here, here, and here, for example.
The media conveniently ignores this, preferring to frame every wildfire as an apocalyptic omen of climate change. By failing to include this historical context, publications like The Guardian and Politico mislead their readers into believing wildfires are a “new normal” caused solely by greenhouse gas emissions.
The breathless media claims of increased drought, increased fire weather, and worse than normal winds such as the Santa Ana winds, just don’t hold up to scientific scrutiny.
Urban sprawl into fire-prone areas has also intensified the wildfire problem. The wildland-urban interface—where human development meets natural landscapes—is now home to millions of Californians. This expansion means more ignition sources, from power line failures, to campfires, to arson and more, and more structures vulnerable to fire.
For example, the Palisades Fire, referenced in recent media coverage, began in an area with a long history of human activity intersecting with high-risk landscapes. Investigations reveal that the fire’s ignition was likely human-caused, possibly by power line failure—a detail conveniently buried in the media’s climate-centric reporting. Cliff Mass, a respected atmospheric scientist, has written extensively on how human factors—not climate—are often the direct cause of such fires.
The media’s failure to acknowledge the role increased population has played in the recent wildfires is deeply irresponsible. Expanding urban development into high-risk areas, coupled with inadequate fireproofing measures, magnifies the destruction when fires occur. Yet, these factors rarely make the headlines. Why? Because they don’t fit narrative that climate change is to blame.
The policy failure that no one talks about is poor forest management.
Poor forest and land management is another critical factor contributing to California’s wildfires that is often ignored by the mainstream coverage. California’s forests are overgrown, with dangerously high levels of combustible material. Controlled burns and mechanical thinning are proven methods to reduce this risk, yet California has consistently fallen short of its forest management goals.
Governor Gavin Newsom has touted California’s “climate leadership,” but his administration and the U.S. Forest Service have quietly backtracked on the forest thinning, logging, and prescribed burn targets. A report from Climate Realism details how inadequate the state’s forest management efforts have been, leaving forests as ticking time bombs.
This policy failure is ignored by media outlets eager to blame a nebulous “climate crisis” rather than hold policymakers accountable for their neglect. How convenient.
There is no denying that naturally driven climate change may influence some environmental conditions, such as warmer temperatures or extended droughts. However, attributing wildfires solely to climate change ignores the larger picture. Consider this: the total area burned by wildfires in the U.S. has actually decreased since the early 20th century, according to data from the National Interagency Fire Center and summarized by Climate at a Glance.
Why hasn’t this fact been front-page news? Because it contradicts the media’s preferred narrative. Wildfires in the past were often larger and more frequent than they are today.
Climate alarmists also ignore the critical role of weather variability. For instance, Michael Shellenberger, a prominent environmentalist and author, has pointed out that many of California’s recent fires were preceded by unusually high wind events, such as Diablo and Santa Ana winds. These natural phenomena, not climate change, drive the most destructive fires.
What is most galling about media coverage of California wildfires is its selective focus and refusal to acknowledge inconvenient facts. By attributing every blaze to climate change, journalists are not just misinforming the public—they are actively undermining efforts to address the real causes of these disasters and thereby putting people at risk by encouraging poor public policies.
Blaming climate change for wildfires is an easy way to avoid difficult conversations about land management, urban planning, and individual responsibility. It allows politicians to deflect blame and activists to push sweeping policies that often have little to do with wildfire prevention. In short, it is a cop-out.
The conclusion? Media irresponsibility is the real crisis.
By refusing to discuss the true causes of wildfires, outlets like Politico and The Guardian are complicit in hindering meaningful action. It’s time for journalists to do their jobs: report facts, ask hard questions, and hold policymakers accountable. Until they do, they will remain part of the problem, not the solution.
Anthony Watts is a senior fellow for environment and climate at The Heartland Institute. Watts has been in the weather business both in front of, and behind the camera as an on-air television meteorologist since 1978 and currently does daily radio forecasts. He has created weather graphics presentation systems for television, specialized weather instrumentation, as well as co-authored peer-reviewed papers on climate issues. He operates the most viewed website in the world on climate, the award-winning website wattsupwiththat.com.
It has been fifteen years since the National Trust predicted a Mediterranean climate for Britain. “National Trust campaign highlights how gardens will look if global warming brings Mediterranean weather to Britain” 24 March 2010 National Trust campaign highlights how gardens … Continue reading →
Last year William Happer spoke on Radiation Transfer in Clouds at the EIKE conference, and the video is above. For those preferring to read, below is a transcript from the closed captions along with some key exhibits. I left out the most technical section in the latter part of the presentation. Text in italics with my bolds.
William Happer: Radiation Transfer in Clouds
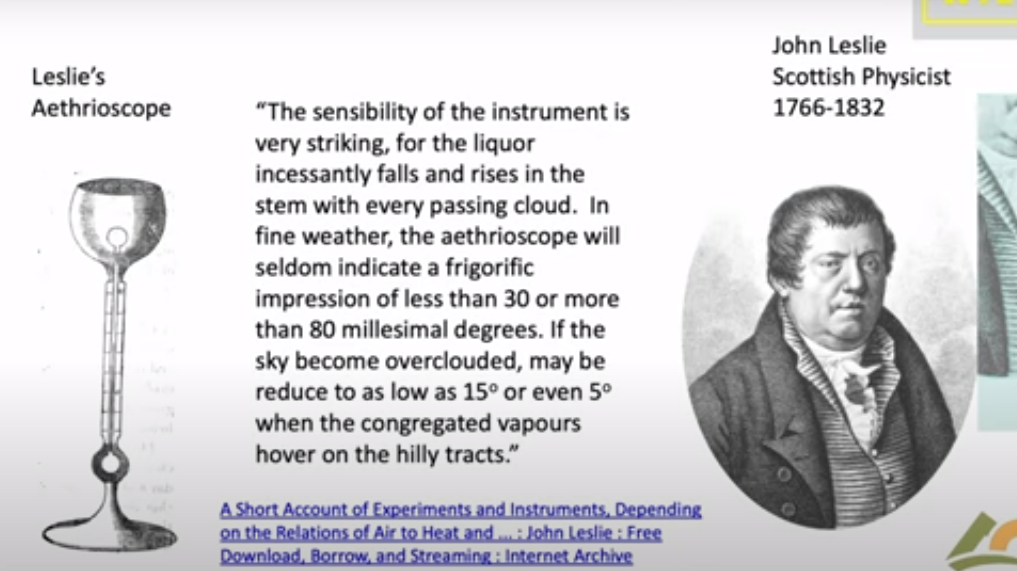
People have been looking at Clouds for a very long time in in a quantitative way. This is one of the first quantitative studies done about 1800. And this is John Leslie, a Scottish physicist who built this gadget. He called it an Aethrioscope, but basically it was designed to figure out how effective the sky was in causing Frost. If you live in Scotland you worry about Frost. So it consisted of two glass bulbs with a very thin capillary attachment between them. And there was a little column of alcohol here.
The bulbs were full of air, and so if one bulb got a little bit warmer it would force the alcohol up through the capillary. If this one got colder it would suck the alcohol up. So he set this device out under the clear sky. And he described that the sensibility of the instrument is very striking. For the liquor incessantly falls and rises in the stem with every passing cloud. in fine weather the aethrioscope will seldom indicate a frigorific impression of less than 30 or more than 80 millesimal degrees. He’s talking about how high this column of alcohol would go up and down if the sky became overclouded. it may be reduced to as low as 15 refers to how much the sky cools or even five degrees when the congregated vapours hover over the hilly tracks. We don’t speak English that way anymore but I I love it.
The point was that even in 1800 Leslie and his colleagues knew very well that clouds have an enormous effect on the cooling of the earth. And of course anyone who has a garden knows that if you have a clear calm night you’re likely to get Frost and lose your crops. So this was a quantitative study of that.
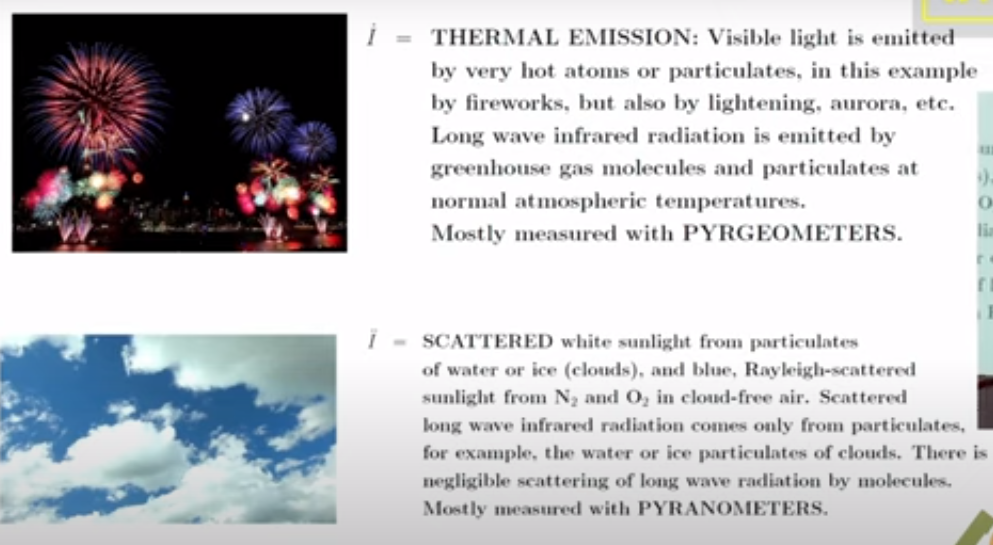
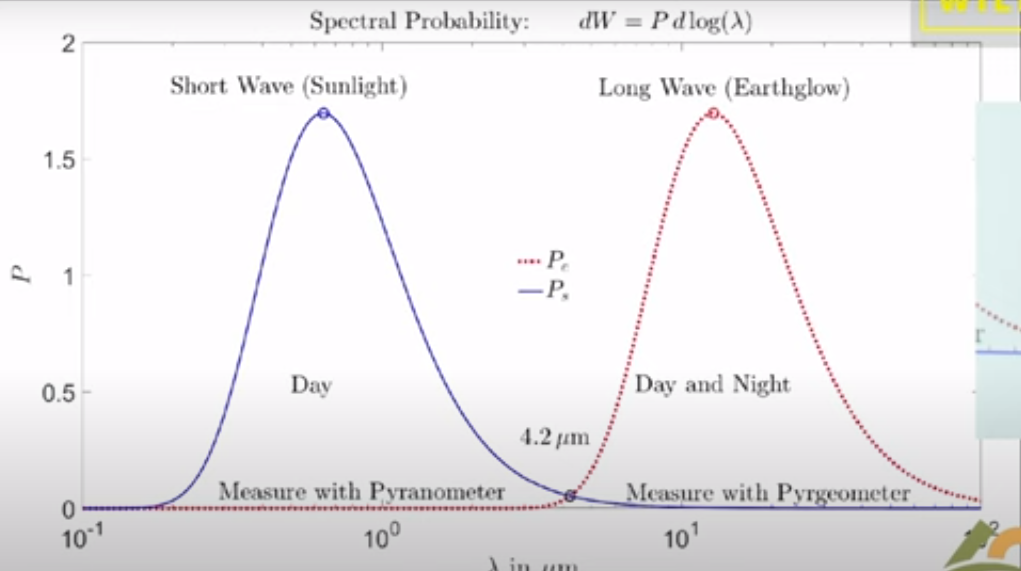
Now it’s important to remember that if you go out today the atmosphere is full of two types of radiation. There’s sunlight which you can see and then there is the thermal radiation that’s generated by greenhouse gases, by clouds and by the surface of the Earth. You can’t see thermal radiation but you you can feel it if it’s intense enough by its warming effect. And these curves practically don’t overlap so we’re really dealing with two completely different types of radiation.
There’s sunlight which scatters very nicely and off of not only clouds but molecules; it’s the blue sky the Rayleigh scattering. Then there’s the thermal radiation which actually doesn’t scatter at all on molecules so greenhouse gases are very good at absorbing thermal radiation but they don’t scatter it. But clouds scatter thermal radiation and plotted here is the probability that you will find Photon of sunlight between you know log of its wavelength and the log of in this interval of the wavelength scale.
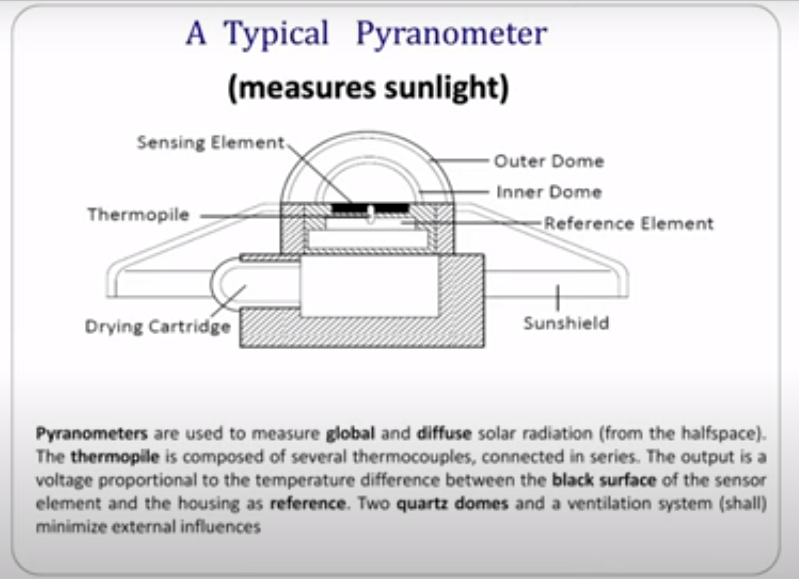
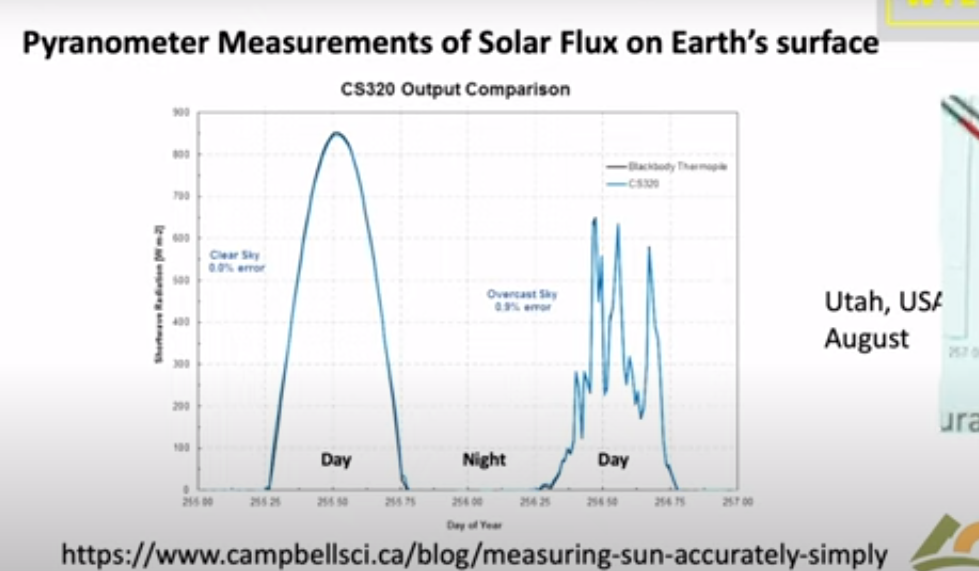
Since Leslie’s day two types of instruments have been developed to do what he did more precisely. One of them is called a pyranometer and this is designed to measure sunlight coming down onto the Earth on a day like this. So you put this instrument out there and it would read the flux of sunlight coming down. It’s designed to see sunlight coming in every direction so it doesn’t matter which angle the sun is shining; it’s uh calibrated to see them all.
Let me show you a measurement by a pyranometer. This is a actually a curve from a sales brochure of a company that will sell you one of these devices. It’s comparing two types of detectors and as you can see they’re very good you can hardly tell the difference. The point is that if you look on a clear day with no clouds you see sunlight beginning to increase at dawn it peaks at noon and it goes down to zero and there’s no sunlight at night. So half of the day over most of the Earth there’s no sunlight in the in the atmosphere.
Here’s a day with clouds, it’s just a few days later shown by days of the year going across. You can see every time a cloud goes by the intensity hitting the ground goes down. With a little clear sky it goes up, then down up and so on. On average at this particular day you get a lot less sunlight than you did on the clear day.
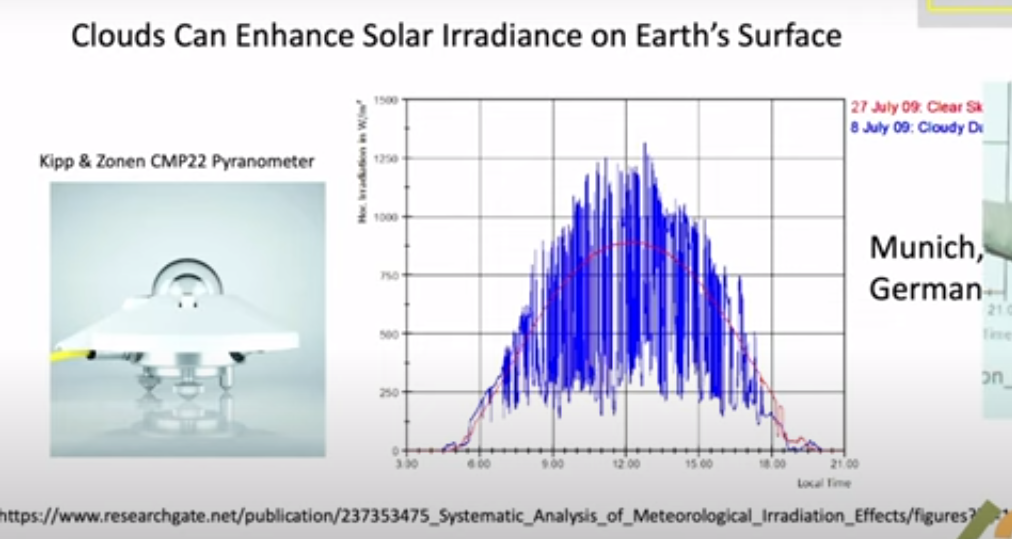
But you know nature is surprising.Einstein had this wonderful quote: God is subtle but he’s not malicious. He meant that nature does all of sorts of things you don’t expect, and so let me show you what happens on a partly cloudy day. Here so this is data taken near Munich. The blue curve is the measurement and the red curve is is the intensity on the ground if there were no clouds. This is a partly cloudy day and you can see there are brief periods when the sunlight is much brighter on the detector on a cloudy day than it is on the clear day. And that’s because coming through clouds you get focusing from the edges of the cloud pointing down toward your detector. That means somewhere else there’s less radiation reaching the ground. But this is rather surprising to most people. I was very surprised to learn about it but it just shows that the actual details of climate are a lot more subtle than you might think.
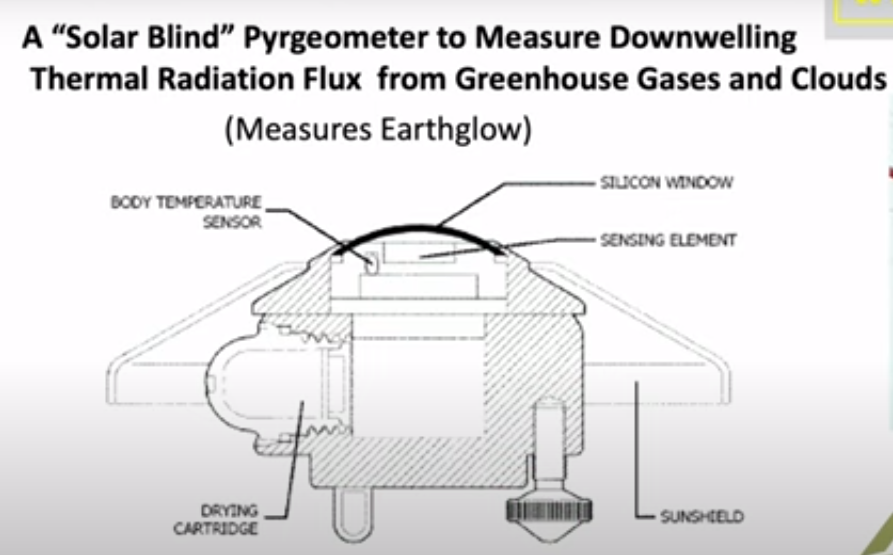
We know that visible light only happens during the daytime and stops at night. There’s a second type of important radiation which is the thermal radiation which is measured by a similar device. You have a silicon window that passes infrared, which is below the band gap of silicon, so it passes through it as though transparent. Then there’s some interference filters here to give you further discrimination against sunlight. So sunlight practically doesn’t go through this at all, so they call it solar solar blind since it doesn’t see the Sun.
But it sees thermal radiation very clearly with a big difference between this device and the sunlight sensing device I showed you. Because actually most of the time this is radiating up not down. Out in the open air this detector normally gets colder than the body of the instrument. And so it’s carefully calibrated for you to compare the balance of down coming radiation with the upcoming radiation. Upcoming is normally greater than down coming.
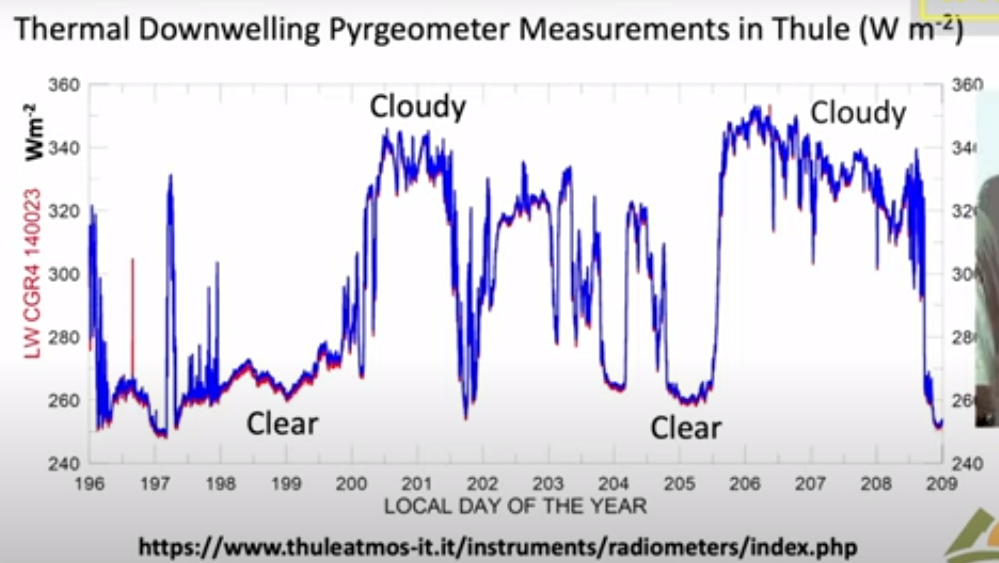
I’ll show you some measurements of the downwelling flux here; these are actually in Greenland in Thule and these are are watts per square meter on the vertical axis here. The first thing to notice is that the radiation continues day and night you can you if you look at the output of the pyrgeometer you can’t tell whether it’s day or night because the atmosphere is just as bright at night as it is during the day. However, the big difference is clouds: on a cloudy day you get a lot more downwelling radiation than you do on a clear day. Here’s a a near a full day of clear weather there’s another several days of clear weather. Then suddenly it gets cloudy. Radiation rises because the bottoms of the clouds are relatively warm at least compared to the clear sky. I think if you put the numbers In, this cloud bottom is around 5° Centigrade so it was fairly low Cloud. it was summertime in Greenland and this compares to about minus 5° for the clear sky.
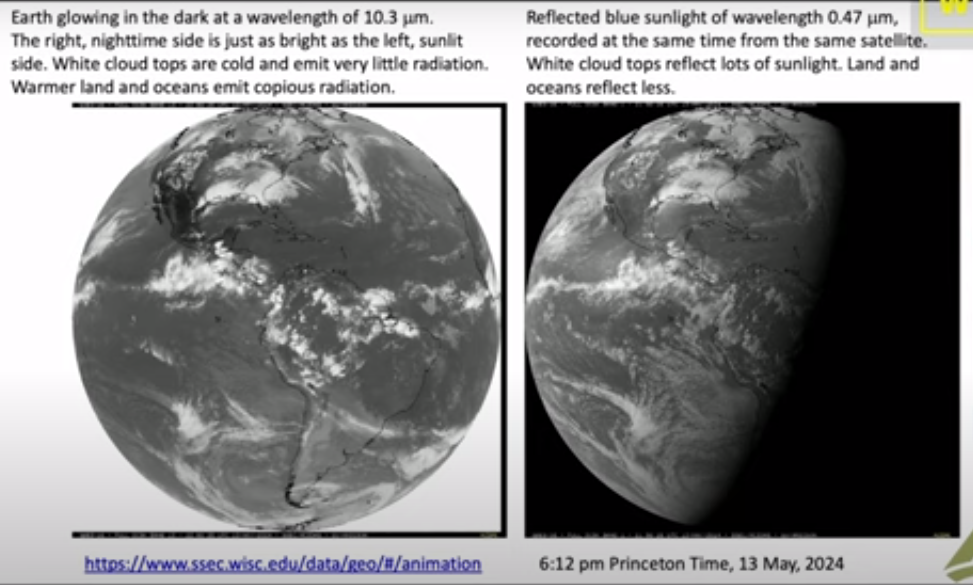
So there’s a lot of data out there and there really is downwelling radiation there no no question about that you measure it routinely. And now you can do the same thing looking down from satellites so this is a picture that I downloaded a few weeks ago to get ready for this talk from Princeton and it was from Princeton at 6 PM so it was already dark in Europe. So this is a picture of the Earth from a geosynchronous satellite that’s parked over Ecuador. You are looking down on the Western Hemisphere and this is a filtered image of the Earth in Blue Light at 47 micrometers. So it’s a nice blue color not so different from the sky and it’s dark where the sun has set. There’s still a fair amount of sunlight over the United States and the further west.
Here is exactly the same time and from the same satellite the infrared radiation coming up at 10.3 which is right in the middle of the infrared window where there’s not much Greenhouse gas absorption; there’s a little bit from water vapor but very little, trivial from CO2.
As you can see, you can’t tell which side is night and which side is day. So even though the sun has set over here it is still glowing nice and bright. There’s sort of a pesky difference here because what you’re looking at here is reflected sunlight over the intertropical Convergence Zone. There are lots of high clouds that have been pushed up by the convection in the tropics and uh so this means more visible light here. You’re looking at emission of the cloud top so this is less thermal light so white here means less light, white there means more light so you have to calibrate your thinking. to
But the Striking thing about all of this: if you can see the Earth is covered with clouds, you have to look hard to find a a clear spot of the earth. Roughly half of the earth maybe is clear at any given time but most of it’s covered with clouds. So if anything governs the climate it is clouds and and so that’s one of the reasons I admire so much the work that Svensmark and Nir Shaviv have done. Because they’re focusing on the most important mechanism of the earth: it’s not Greenhouse Gases, it’s Clouds. You can see that here.
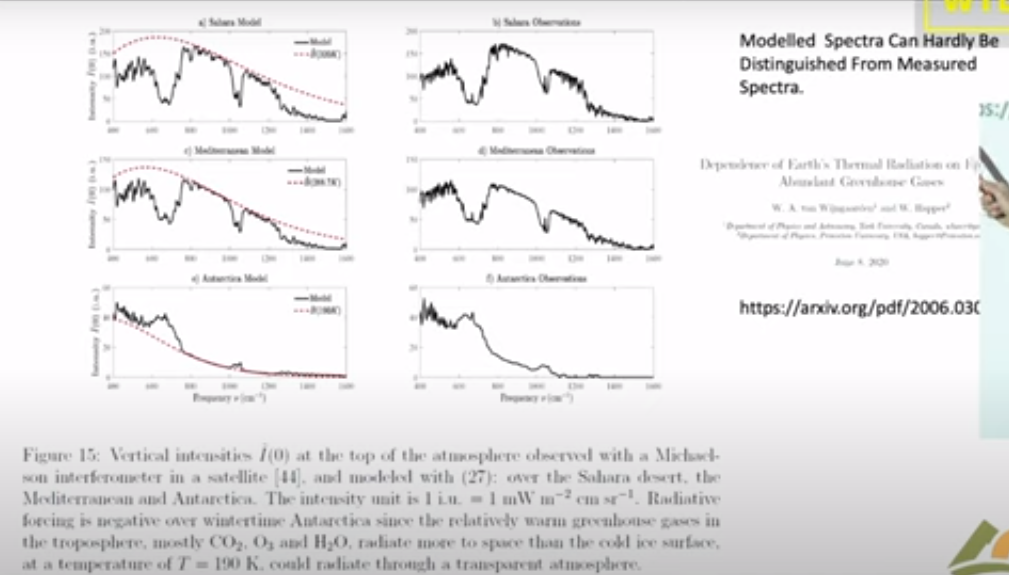
Now this is a single frequency let me show you what happens if you look down from a satellite and do look at the Spectrum. This is the spectrum of light coming up over the Sahara Desert measured from a satellite. And so here is the infrared window; there’s the 10.3 microns I mentioned in the previous slide it’s it’s a clear region. So radiation in this region can get up from the surface of the Sahara right up to outer space.
Notice that the units on these scales are very different; over the Sahara the top unit is 200, 150 over the Mediterranean and it’s only 60 over the South Pole. But at least the Mediterranean and the Sahara are roughly similar so the right side here these three curves on the right are observations from satellites and the three curves on the left are are calculations modeling that we’ve done. The point here is that you can hardly tell the difference between a model calculation and observed radiation.
So it’s really straightforward to calculate radiation transfer. If someone quotes you a number in watts per square centimeter you should take it seriously; that probably a good number. If they tell you a temperature you don’t know what to make about it. Because there’s a big step between going from watts per square centimeter to a temperature change. All the mischief in the whole climate business is going from watts per square centimeter to to Centigrade or Kelvin.
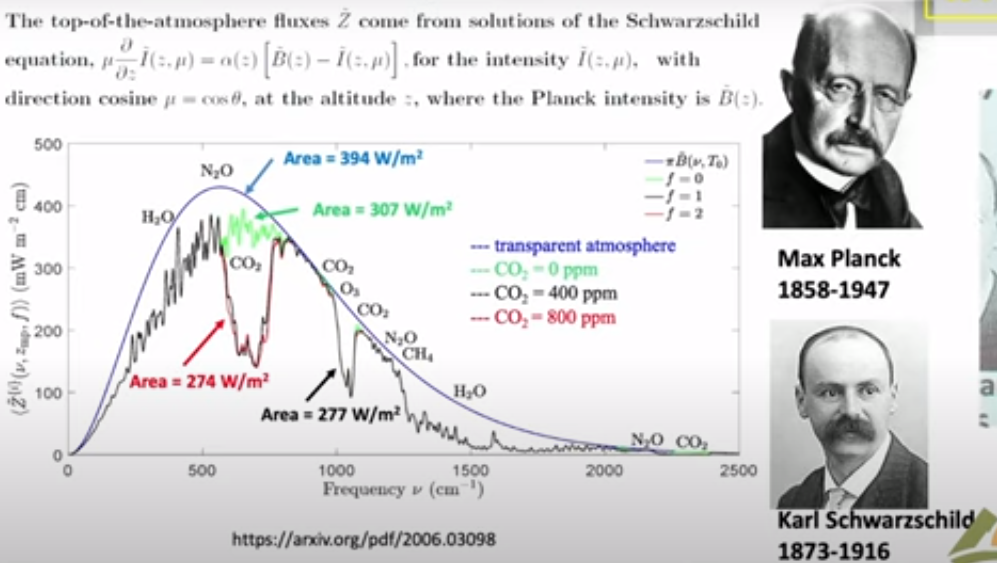
Now I will say just a few words about clear sky because that is the simplest. Then we’ll get on to clouds, the topic of this talk. This is a calculation with the same codes that I showed you in the previous slide which as you saw work very well. It’s worth spending a little time because this is the famous Planck curve that was the birth of quantum mechanics. There is Max Planck who figured out what the formula for that curve is and why it is that way. This is what the Earth would radiate at 15° Centigrade if there were no greenhouse gases. You would get this beautiful smooth curve the Planck curve. If you actually look at the Earth from the satellites you get a raggedy jaggedy black curve. We like to call that the Schwarzchild curve because Carl Schwarzchild was the person who showed how to do that calculation. Tragically he died during World War I, a Big Big loss to science.
There are two colored curves that I want to draw your attention. The green curve is is what Earth would radiate to space if you took away all the CO2 so it only differs from the black curve you know in the CO2 band here this is the bending band of CO2 which is the main greenhouse effect of CO2. There’s a little additional effect here which is the asymmetric stretch but it it doesn’t contribute very much. Then here is a red curve and that’s what happens if you double CO2.
So notice the huge asymmetry. If taking all 400 parts per million of CO2 away from the atmosphere causes this enormous change 30 watts per square meter, the difference between this green 307 and and the black 277, that’s 30 watts per square meter. But if you double CO2 you practically don’t make any change. This is the famous saturation of CO2. At the levels we have now doubling CO2, a 100% Increase of CO2 only changes the radiation to space by 3 watts per square meter. The difference between 274 for the red curve and 277 for the curve for today. So it’s a tiny amount: for 100% increase in CO2 a 1% decrease of radiation to space.
That allows you to estimate the feedback-free climate sensitivity in your head. I’ll talk you through the feedback-free climate free sensitivity. So doubling CO2 is a 1% decrease of radiation to space. If that happens then the Earth will start to warm up. But it will radiate as the fourth power of the temperature. So temperature starts to rise but if you’ve got a fourth power, the temperature only has to rise by one-quarter of a percent absolute temperature. So a 1% forcing in watts per square centimeter is a one-quarter percent of temperature in Kelvin. Since the ambient Kelvin temperature is about 300 Kelvin (actually a little less) a quarter of that is 75 Kelvin. So the feedback free equilibrium climate sensitivity is less than 1 Degree. It’s 0.75 Centigrade. It’s a number you can do in your head.
So when you hear about 3 centigrade instead of .75 C that’s a factor of four, all of which is positive feedback. So how is there really that much positive feedback? Because most feedbacks in nature are negative. The famous Le Chatelier principle which says that if you perturb a system it reacts in a way to to dampen the perturbation not increase it. There are a few positive feedback systems that we’re familiar with for example High explosives have positive feedback. So if the earth’s climate were like other positive feedback systems, all of them are highly explosive, it would have exploded a long time ago. But the climate has never done that, so the empirical observational evidence from geology is that the climate is like any other feedback system it’s probably negative Okay so I leave that thought with you and and let me stress again:
This is clear skies no clouds; if you add clouds all this does is
suppress the effects of changes of the greenhouse gas.
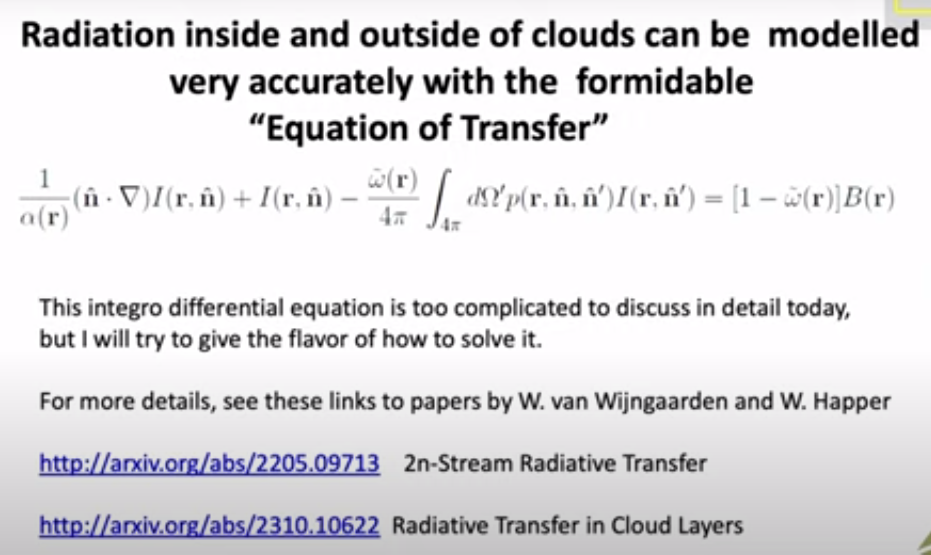
So now let’s talk about clouds and the theory of clouds, since we’ve already seen clouds are very important. Here is the formidable equation of transfer which has been around since Schwarzchild’s day. So some of the symbols here relate to the intensity, another represents scattering. If you have a thermal radiation on a greenhouse gas where it comes in and immediately is absorbed, there’s no scattering at all. If you hit a cloud particle it will scatter this way or that way, or some maybe even backwards.
So all of that’s described by this integral so you’ve got incoming light at One Direction and you’ve got outgoing light at a second Direction. And then at the same time you’ve got thermal radiation so the warm particles of the cloud are are emitting radiation creating photons which are coming out and and increasing the Earth glow the and this is represented by two parameters. Even a single cloud particle has an albedo, this is is the fraction ofradiation that hits the cloud that is scattered as opposed to absorbed and being converted to heat. It’s a very important parameter for visible light and white clouds, typically 99% of the encounters are scattered. But for thermal radiation it’s much less. So water scatters thermal radiation only half as efficiently as shorter wavelengths.
The big problem is that in spite of all the billions of dollars that we have spent, these things which should be known and and would have been known if there hadn’t been this crazy fixation on carbon dioxide and greenhouse gases. And so we’ve neglected working on these areas that are really important as opposed to the trivial effects of greenhouse gases. Attenuation in a cloud is both scattering and absorption. Of course you have to solve these equations for every different frequency of the light because especially for molecules, there’s a strong frequency dependence.
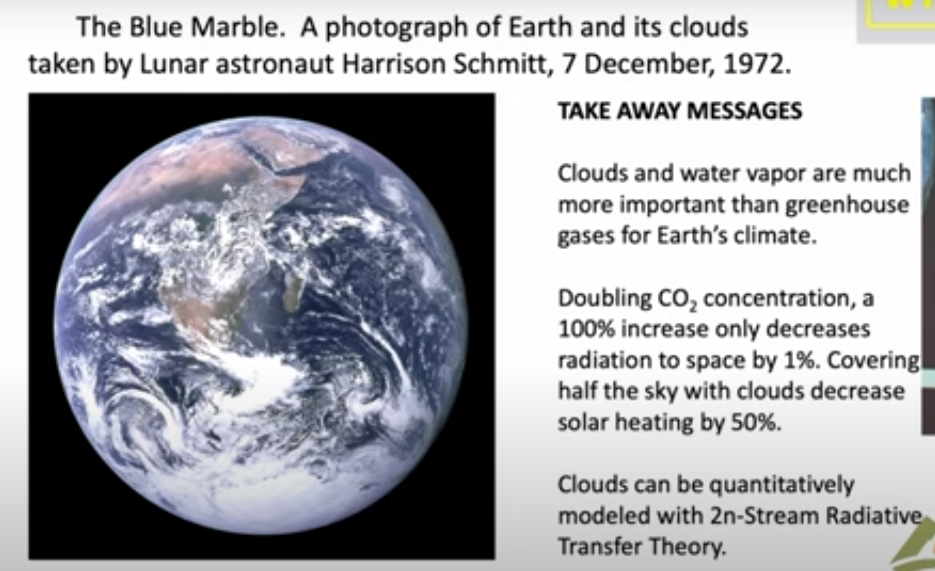
In summary, let me show you this photo which was taken by Harrison Schmitt who was a friend of mine on one of the first moonshots. It was taken in December and looking at this you can see that they were south of Madagascar when the photograph was taken. You can see it was Winter because here the Intertropical Convergence Zone is quite a bit south of the Equator; it’s moved Way South of India and Saudi Arabia. By good luck they had the sun behind them so they had the whole earth Irradiated.
There’s a lot of information there and and again let me draw your attention to how much of the Earth is covered with clouds. So only very small parts of the Earth can actually be directly affected by greenhouse gases, of the order of half. The takeaway message is that clouds and water vapor are much more important than greenhouse gases for earth’s climate. The second point is the reason they’re much more important: doubling CO2 as I indicated in the middle of the talk only causes a 1% difference of radiation to space. It is a very tiny effect because of saturation. You know people like to say that’s not so, but you can’t really argue that one, even the IPCC gets the same numbers that we do.
And you also know that covering half of the sky with clouds will decrease solar heating by 50%. So for clouds it’s one to one, for greenhouse gases it’s a 100 to one. If you really want to affect the climate, you want to do something to the clouds. You will have a very hard time making any difference with Net Zero with CO2 if you are alarmed about the warmings that have happened.
So one would hope that with all the money that we’ve spent trying to turn CO2 into a demon that some good science has come out of it. From my point of view this is a small part of it, this scattering theory that I think will be here a long time after the craze over greenhouse gases has gone away. I hope there will be other things too. You can point to the better instrumentation that we’ve got, satellite instrumentation as well as ground instrumentation. So that’s been a good investment of money. But the money we’ve spent on supercomputers and modeling has been completely wasted in my view.