Mexico’s Emissions Con Trick

From NOT A LOT OF PEOPLE KNOW THAT

By Paul Homewood

https://climateactiontracker.org/countries/mexico

While Miliband wants to lead us over the cliff, the rest of the world is just getting on as normal.

Mexico is another country which continues to increase emissions. Even their Paris NDC was explicit about this, as it pledged only to cut emissions from a theoretical Business as Usual scenario. The resulting targeted emissions in 2030 would be higher than they were in 2015!

Since then, Mexico has upped the reduction from 22% to 35%, but as Climate Action Tracker point out, they have also upped the BAU:

Mexico’s climate policies continue to go backwards, as fossil fuel use is prioritised and climate-related policies and institutions dismantled. Mexico’s updated 2030 target (NDC), submitted in November 2022 results in higher emission levels than the targets from 2016, breaching both agreements under the Paris Agreement and Mexican Law – where governments committed to improve their targets over time. The updated NDC lacks transparency and disguises its lack of ambition by counting forests differently in the base and in the target year. Mexico will meet the unambitious target with already implemented policies as emissions continue to rise through 2030. With this update, the CAT’s rating of Mexico’s climate targets and action worsens from “Highly insufficient” to “Critically insufficient”.

While the new target includes a larger percentage reduction it still leads to higher emissions. The NDC update increases the percentage reduction of the unconditional target from 22% to 35% (30% with own resources and an additional 5% from agreed international support) by 2030 and from 36% to 40% conditional on additional international support. But the business-as-usual (BAU) baseline, against which the targets are defined, has been revised upwards. In addition Mexico expects a higher contribution of emissions sinks in forests to achieving the target. Together this means that the new target can be met even if emissions excluding those of forestry are higher than what they could have been under the old target.

The 2022 NDC update replaces the 2020 update, which became invalid after a Mexican court found that it is less ambitious than the very first NDC of 2016 and therefore a violation of continuous progression of ambition. The 2022 update is less specific on the contribution of forestry to the target, which may make it more difficult to argue its ambition.

Mexico pursues a “gross-net” approach, meaning it counts only emissions sources in its BAU, ignoring sinks from land use and forestry. However, the NDC does intend to use these sinks to achieve the target, highlighting that nature-based solutions are ‘central’ to achieving the targets. In 2019, reported sinks were almost 200 MtCO2e, or about a quarter of Mexico’s emissions excl. land use, land use change and forestry. While technically allowed, this accounting approach has been criticised as in-transparent for over 20 years.

Mexico’s 2022 NDC update removes the target to peak emissions in 2026 and does not mention any net zero nor other long-term targets.

https://climateactiontracker.org/countries/mexico

In terms of just CO2, it is evident that Mexico never had any intention of cutting emissions:

BP Energy Review


Discover more from Watts Up With That?

Subscribe to get the latest posts sent to your email.

via Watts Up With That?

https://ift.tt/R5gu12Y

January 3, 2025 at 08:07AM

Ravensworth DCNN2228 – Demonstrating the Greenhouse Effect?

54.47337 -1.78019 Met Office CIMO Assessed Class 5 Installed 1/11/2002 (likely due for closure)

Google Maps automatically orientates north/south. It took me hours to positively confirm that the red kite marker is the screen simply because I struggled to believe anyone would actually install one there.

Ravensworth Nurseries was a large independent Garden Centre and nursery complex a few miles north of Richmond in North Yorkshire. Starting from a small roadside operation the site steadily grew and in 2002 a large additional greenhouse area was constructed complete with the newly installed weather station.

To add some numbers for context, the greenhouse to the south is 70 metres x 60 metres equating to an artificially warmed area of 4,200 square metres. The greenhouse to the south west is a further 3,600 square metres. There are other large covered areas further south. The unenclosed screen lies next to a pathway and just 5.7 metres from the greenhouse wall. The 10 metre circled area below includes further general outside storage within an area further enclosed by a metre high berm to the north.

The berm seen from the road with the screen hidden from view in front of the greenhouses.

There really should not be any more to add as this weather station’s absurd siting rather condemns itself. However, I have to question the mentality and qualifications of those who originally installed it, authorised it, regularly inspected it and continue to take observations from it. Are they oblivious to the unquestionable indications that the readings cannot reflect the natural environment in any way?

Recently I discovered a potential answer to questions like these — whilst most operational staff at the Met Office are diligent, well qualified and sensible, there are a small minority who are anything but. Studying other blogs I have come across Met Office former staff who are perfectly willing to justify any and every Met Office weather site regardless of how appalling they may be. Worryingly these are the same people who seem to have been elevated to higher positions within the organisation. I have commented on reviews before of the dogmatic attitudes of some current staff who I have dealt with who openly feel aspects of “their science” cannot be questioned. It is becoming clearer to me from more of these sites that I investigate ( and bear in mind that everyone of them is a “Climate” reporting site) that a small number of the Met Office staff are actively and effectively corrupting the historic temperature record.

The codicil of this post is that, sadly, Ravensworth Nurseries recently ceased trading claiming current events as the cause. Subsequently plans have been submitted for housing to replace the nursery and it is likely to close the weather station. I doubt anyone should be sorry to see the back of such a poor screen but if it does go I will be carefully checking any replacement.

via Tallbloke’s Talkshop

https://ift.tt/AhbHfJK

January 3, 2025 at 06:43AM

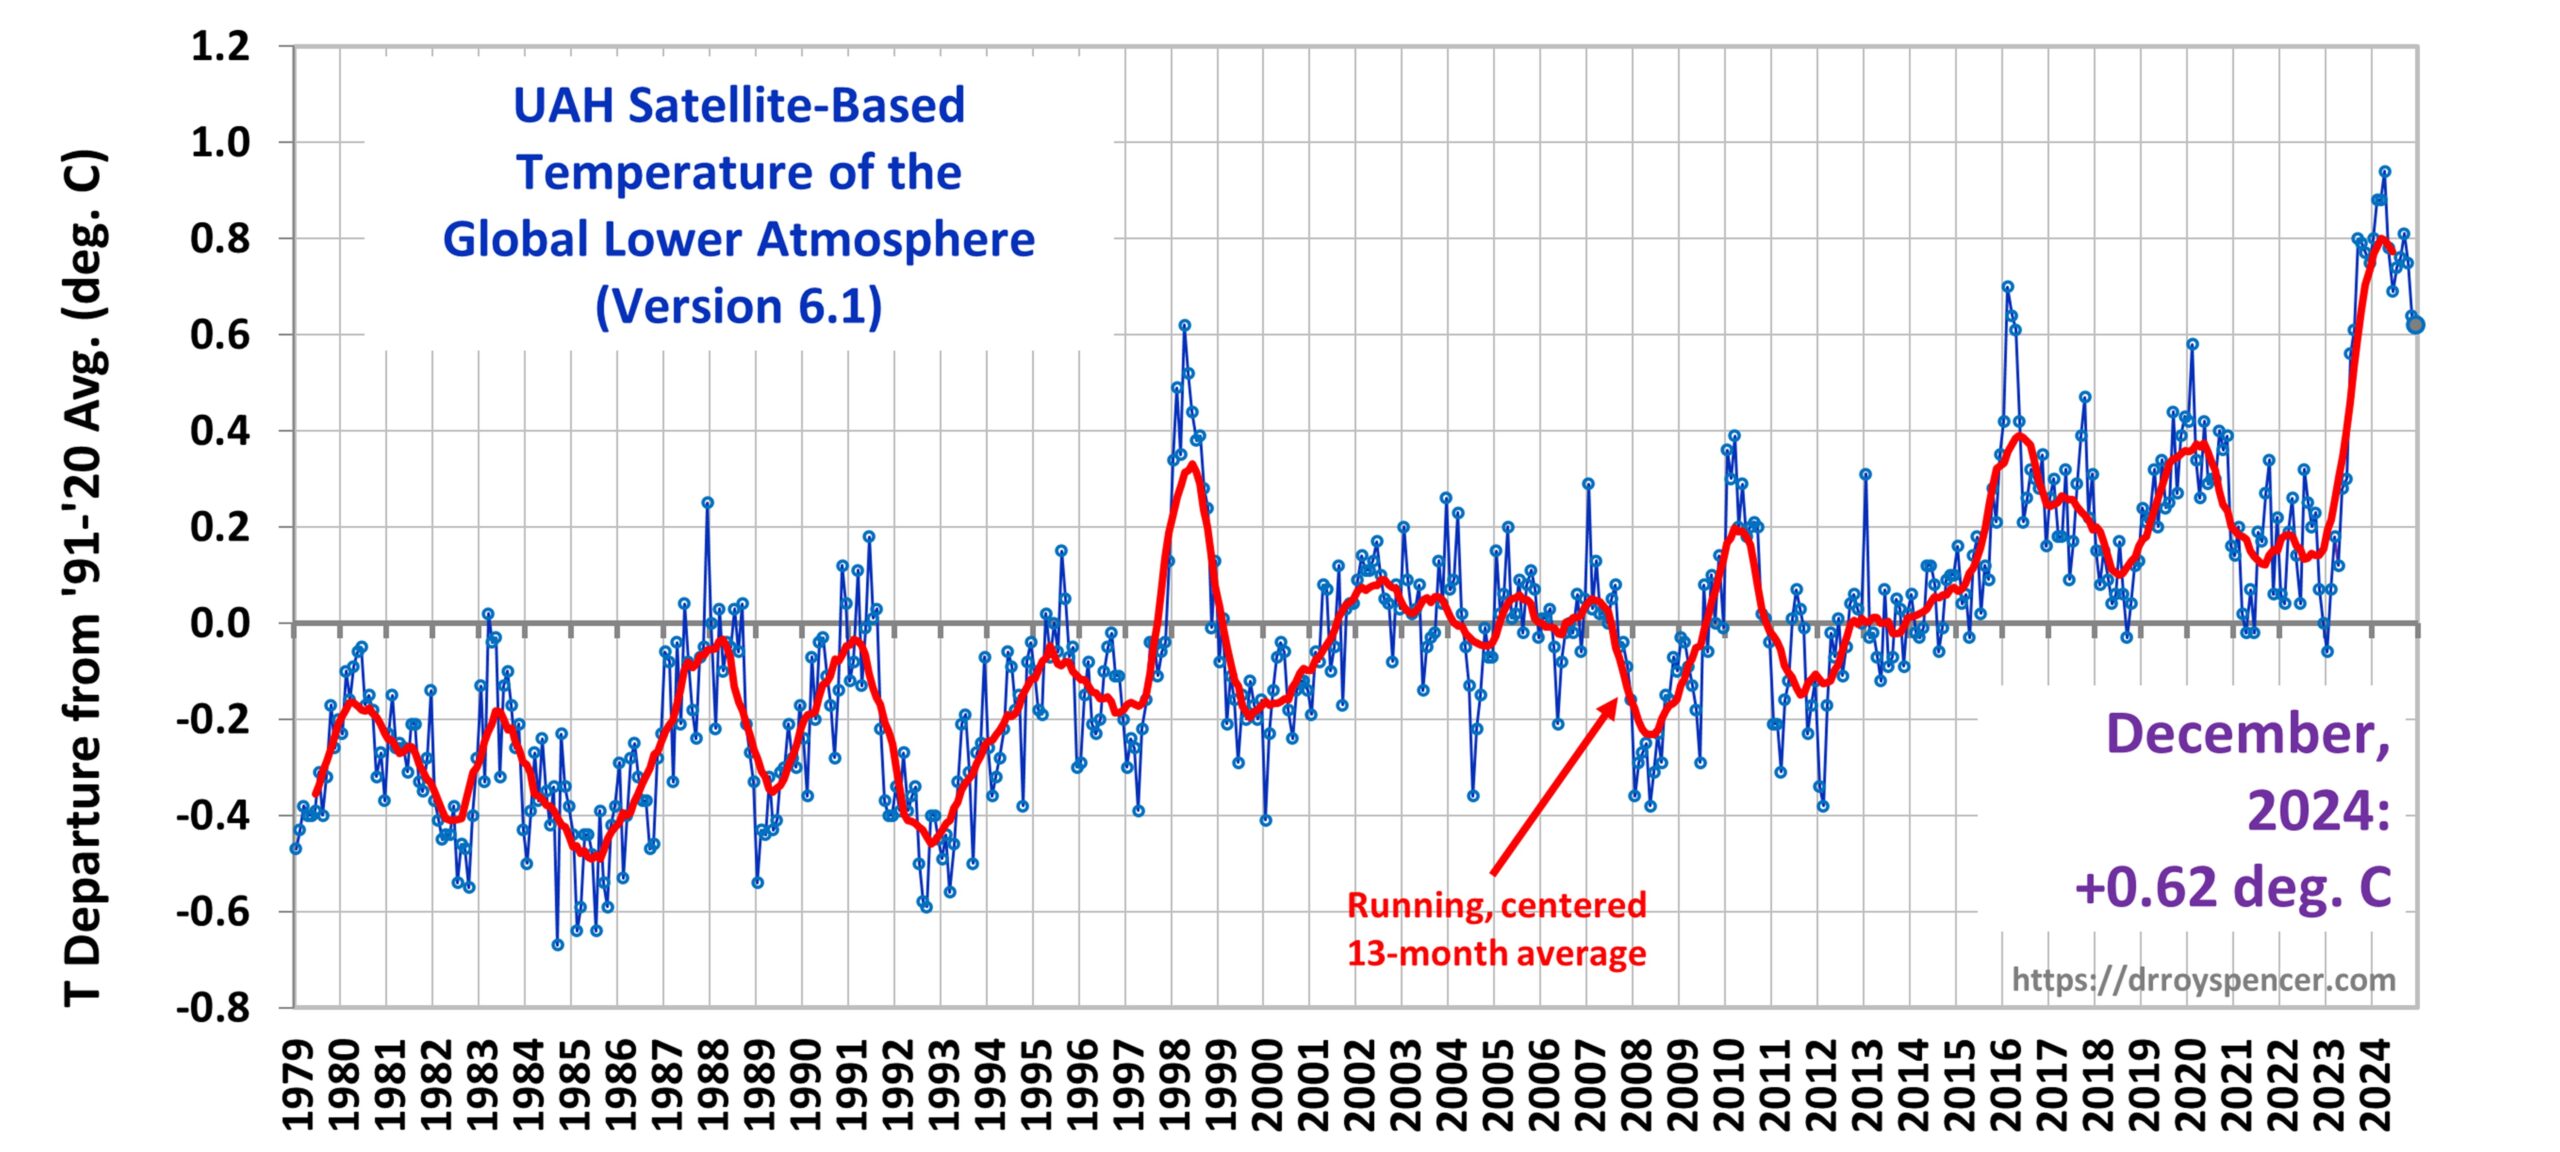
UAH v6.1 Global Temperature Update for December, 2024: +0.62 deg. C

2024 Sets New Record for Warmest Year In Satellite Era (Since 1979)

The Version 6.1 global average lower tropospheric temperature (LT) anomaly for December, 2024 was +0.62 deg. C departure from the 1991-2020 mean, down slightly from the November, 2024 anomaly of +0.64 deg.

The Version 6.1 global area-averaged temperature trend (January 1979 through December 2024) remains at +0.15 deg/ C/decade (+0.22 C/decade over land, +0.13 C/decade over oceans).

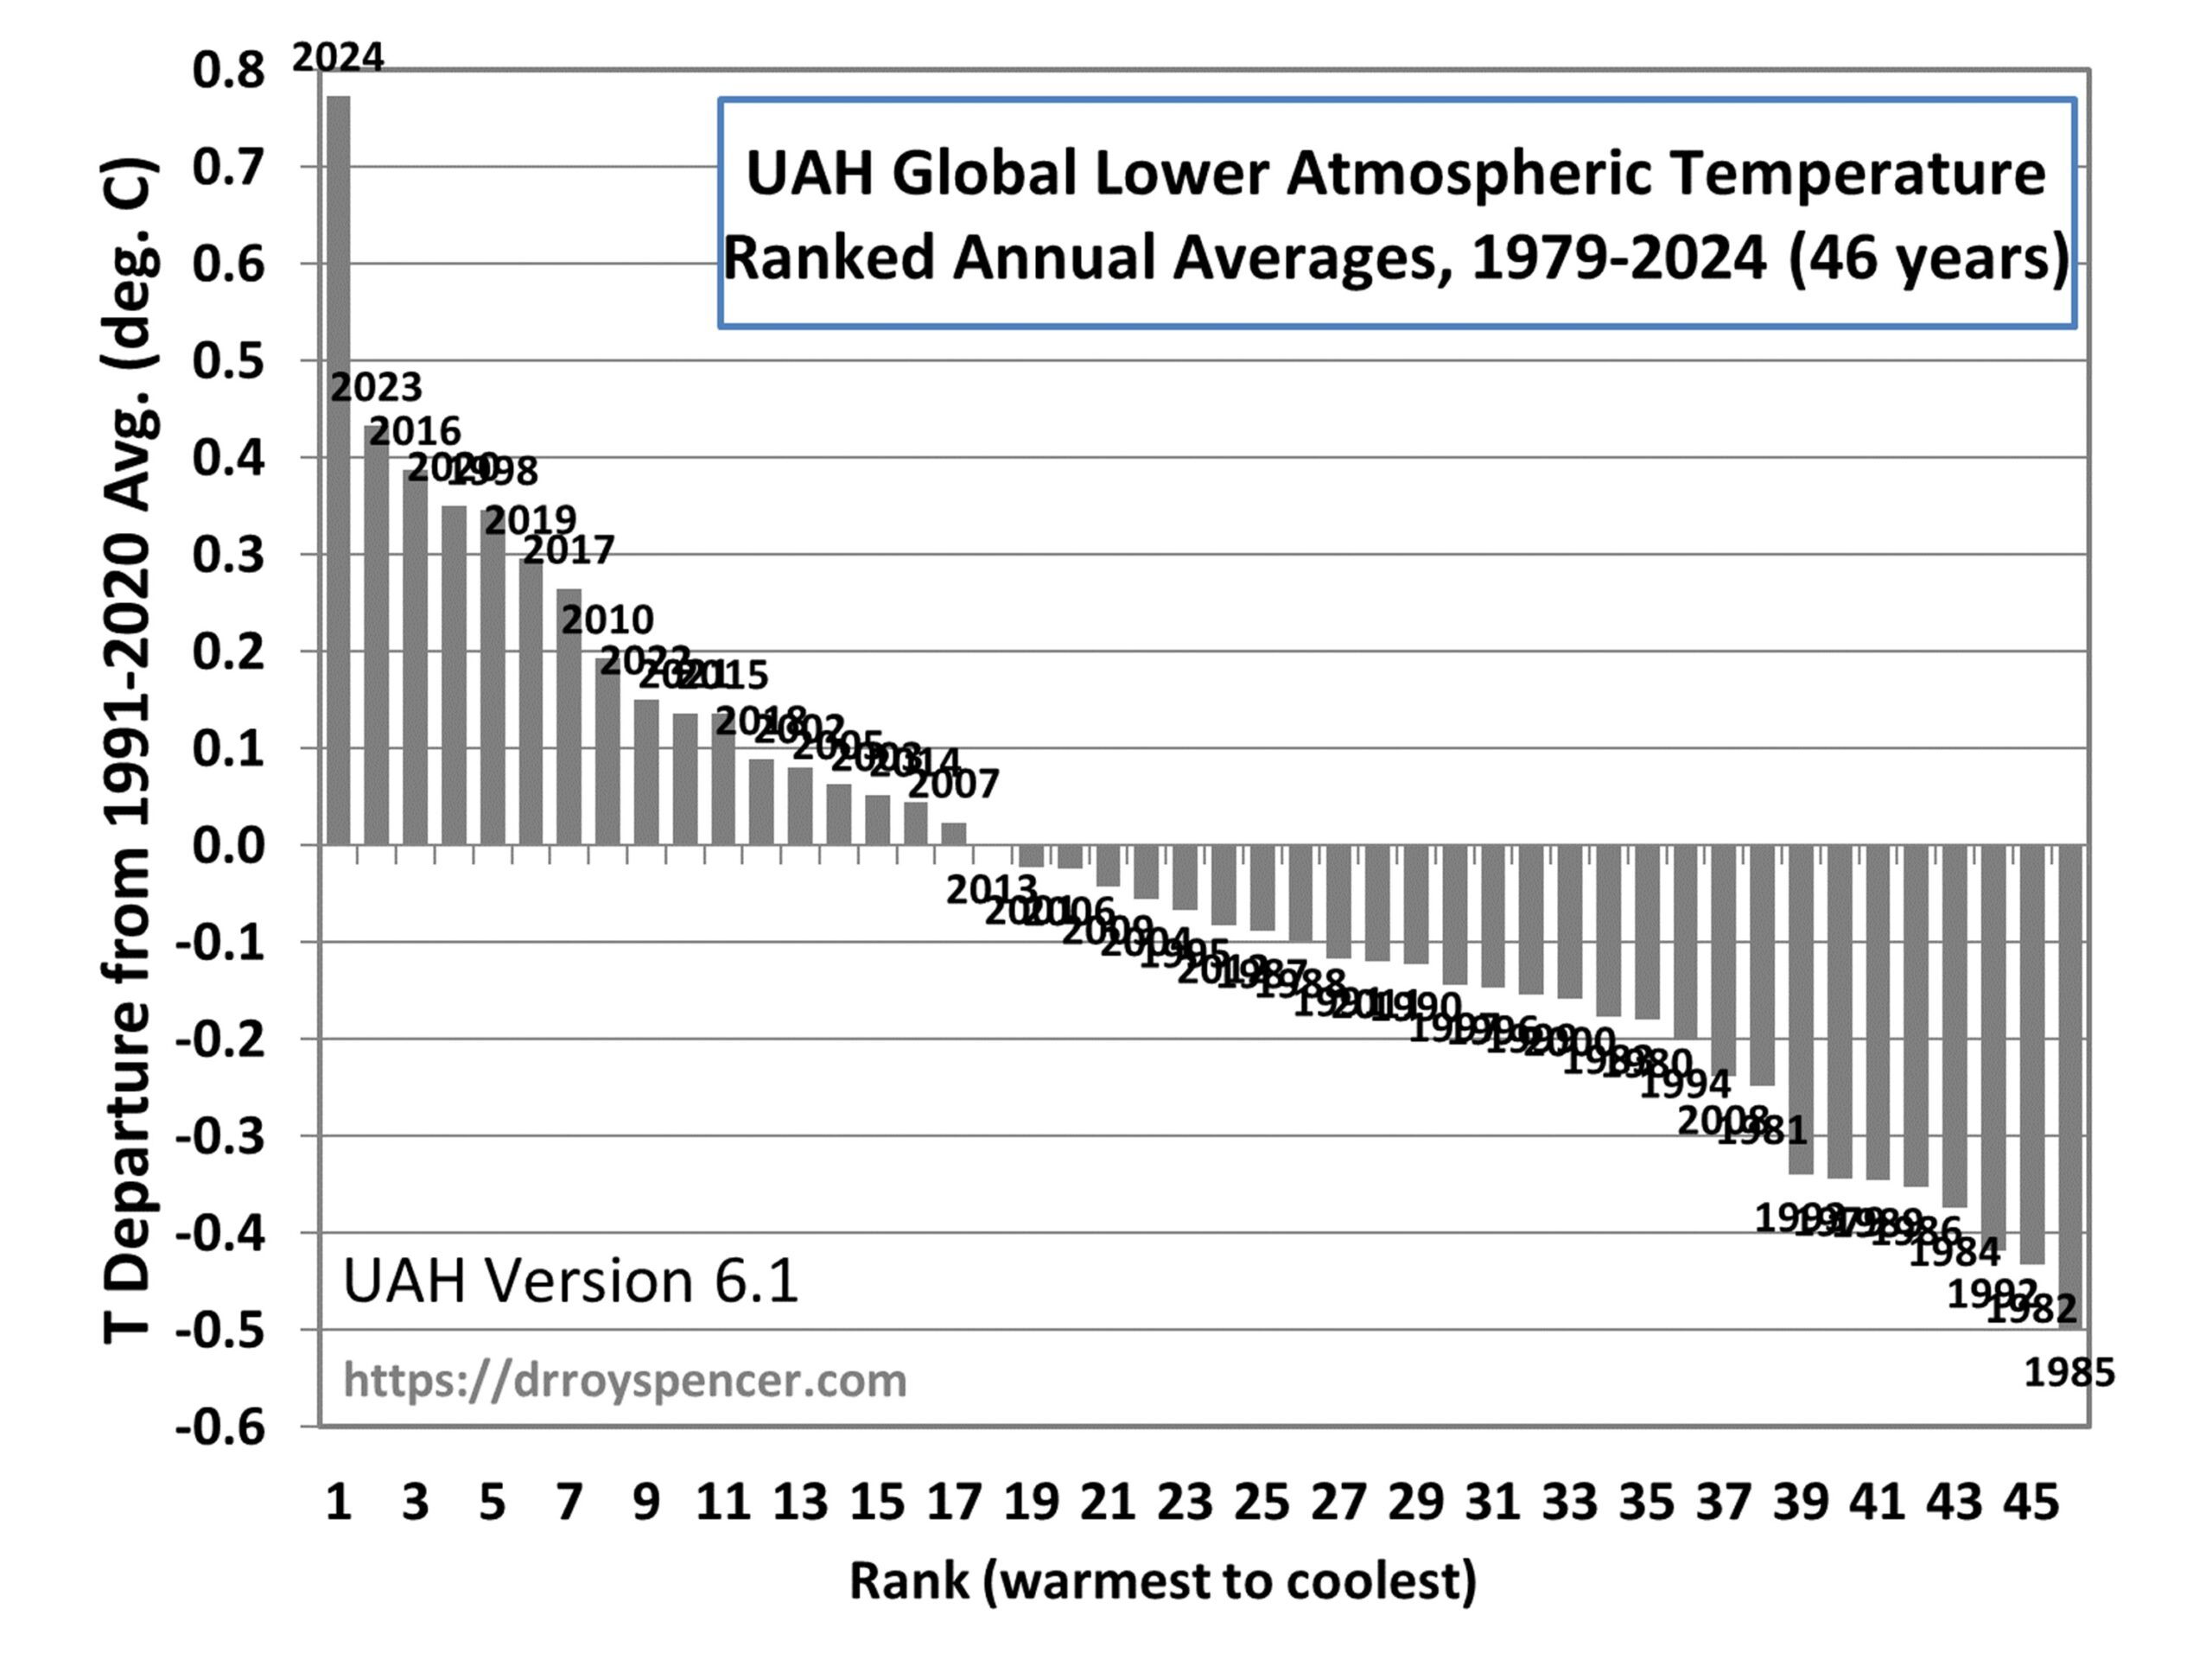
As seen in the following ranking of the years from warmest to coolest, 2024 was by far the warmest in the 46-year satellite record averaging 0.77 deg. C above the 30-year mean, while the 2nd warmest year (2023) was +0.43 deg. C above the 30-year mean. [Note: These yearly average anomalies weight the individual monthly anomalies by the number of days in each month.]

The following table lists various regional Version 6.1 LT departures from the 30-year (1991-2020) average for the last 24 months (record highs are in red).

YEAR MO GLOBE NHEM. SHEM. TROPIC USA48 ARCTIC AUST
2023 Jan -0.06 +0.07 -0.19 -0.41 +0.14 -0.10 -0.45
2023 Feb +0.07 +0.13 +0.01 -0.13 +0.64 -0.26 +0.11
2023 Mar +0.18 +0.22 +0.14 -0.17 -1.36 +0.15 +0.58
2023 Apr +0.12 +0.04 +0.20 -0.09 -0.40 +0.47 +0.41
2023 May +0.28 +0.16 +0.41 +0.32 +0.37 +0.52 +0.10
2023 June +0.30 +0.33 +0.28 +0.51 -0.55 +0.29 +0.20
2023 July +0.56 +0.59 +0.54 +0.83 +0.28 +0.79 +1.42
2023 Aug +0.61 +0.77 +0.45 +0.78 +0.71 +1.49 +1.30
2023 Sep +0.80 +0.84 +0.76 +0.82 +0.25 +1.11 +1.17
2023 Oct +0.79 +0.85 +0.72 +0.85 +0.83 +0.81 +0.57
2023 Nov +0.77 +0.87 +0.67 +0.87 +0.50 +1.08 +0.29
2023 Dec +0.75 +0.92 +0.57 +1.01 +1.22 +0.31 +0.70
2024 Jan +0.80 +1.02 +0.58 +1.20 -0.19 +0.40 +1.12
2024 Feb +0.88 +0.95 +0.81 +1.17 +1.31 +0.86 +1.16
2024 Mar +0.88 +0.96 +0.80 +1.26 +0.22 +1.05 +1.34
2024 Apr +0.94 +1.12 +0.77 +1.15 +0.86 +0.88 +0.54
2024 May +0.78 +0.77 +0.78 +1.20 +0.05 +0.22 +0.53
2024 June +0.69 +0.78 +0.60 +0.85 +1.37 +0.64 +0.91
2024 July +0.74 +0.86 +0.62 +0.97 +0.44 +0.56 -0.06
2024 Aug +0.76 +0.82 +0.70 +0.75 +0.41 +0.88 +1.75
2024 Sep +0.81 +1.04 +0.58 +0.82 +1.32 +1.48 +0.98
2024 Oct +0.75 +0.89 +0.61 +0.64 +1.90 +0.81 +1.09
2024 Nov +0.64 +0.88 +0.41 +0.53 +1.12 +0.79 +1.00
2024 Dec +0.62 +0.76 +0.48 +0.53 +1.42 +1.12 +1.54

The full UAH Global Temperature Report, along with the LT global gridpoint anomaly image for December, 2024, and a more detailed analysis by John Christy, should be available within the next several days here.

The monthly anomalies for various regions for the four deep layers we monitor from satellites will be available in the next several days at the following locations:

Lower Troposphere

Mid-Troposphere

Tropopause

Lower Stratosphere

via Roy Spencer, PhD.

https://ift.tt/pahRoZT

January 3, 2025 at 04:54AM

‘I get a kick out of Nigel Farage’: Jordan Peterson on Reform and why net zero is unconservative

The Spectator

Jordan Peterson speaks to Spectator editor Michael Gove about the ‘idiot blandishments of net zero’. He describes how setting a target at ‘zero’ dooms you to the futile pursuit of perfection, why Nigel Farage could be the answer to the preoccupation with ‘the climate apocalypse’, and whether Kemi Badenoch might put right some of the Tories’ less ‘conservative’ policies.

This interview will be archived in WUWT Climate TV, a collection of over six hundred videos, featuring new interviews and analysis, and covering dozens of media sources discussing, debating and analyzing the latest in climate science, climate politics, and energy policy, including topics concerning temperature, sea level, polar bears, ocean acidification, extreme weather, censorship, wild fires, and more.


Discover more from Watts Up With That?

Subscribe to get the latest posts sent to your email.

via Watts Up With That?

https://ift.tt/mEuyXvz

January 3, 2025 at 04:07AM