Castlederg WMO03904 – Coldest or a Constructed Hottest?

54.70708 -7.57746 Met Office CIMO Assessed Class 5 Installed 1/1/1963 as Rain Gauge only, Archived Temperature data from 1/1/1995.

Should the Met Office be attributing national temperature records to CIMO Class 5 sites with a known likely inaccuracy due to siting of up to 5°C? Screen locations that are so poor that they effectively have no site requirement conditions at all imposed upon them at all that are far too common in Northern Ireland.

Amazingly Castlederg has managed to record the highest ever temperature in Northern Ireland PLUS the coldest ever temperature. How has this remarkable achievement been managed?

A 50°C range from minus 18.7°C to plus 31.3°C for the temperate maritime Cfb Koppen climate classification of Northern Ireland in the same exact location is so remarkable it warrants further investigation.

At this point it is worth noting that this site has only been recording temperatures since 1995 and not the quoted installation date in the Met Office publicly viewable data archive. It is quite common for previous rain gauge only sites to have recently added screens, the impression of longevity of overall records (i.e. including temperature readings) is not correct. This becomes relevant when Met Office broadcasters make claims via the BBC such as: “The number of days we see over 30C during summer has vastly increased in recent decades compared with the early 20th Century as a result of climate change.” {My note – why can’t journalists find symbols on their keyboards like this “°”}

Clearly Castlederg was not recording readings before 1995 so any comparison of this site (and all other modern ones) with the first quarter of the last century is completely bogus as an indicator of anything other than the changing locations of screens, different metrology, and urban growth. A classic example of motivated reasoning from the Met Office and a possible explanation of accepting inaccurate Class 5 sites such as Castlederg to “prove” their argument.

However, there is much more to these records than initially meets the eye. Tim Channon reviewed this site in 2012 correctly assessing it as a lowly Class 5. Note the lack of up to date aerial imagery and resorting to monochrome in his original report.

The December 2010 cold record is unsurprising – that December was the coldest in the CET for over 100 years and the entirety of the UK &.NI experienced extreme cold. Somewhere in Northern Ireland would record the coldest and that just happened to be Castlederg. What is odd is the high reading from July 2021 from such an apperantly shaded site….or is it?

The headline image is the most up to date one available from either Google or Bing maps and I authenticated the date taken to April 2021 (three months before that record high on 21st July) from Google Earth Pro. Has the site subsequently changed much?

“Having worked with NI Water for many years, the firm {Lowry Building & Civil Engineering) harnessed its knowledge and experience of the water industry and its processes to deliver a high-quality build, with construction commencing in May 2021.”

The Castlederg Water Treatment Works became a huge construction site and what looks like a small plant turned into this below. It is not quite possible to make out the screen as it is surrounded portacabins, cars and general major construction site paraphernalia.

It would probably have been reasonable to suspend taking readings from the station whilst such major works were being completed around it but, as has been demonstrated many times with the Met Office, they rarely ever seem to. Even constructing a solar farm around Chertsey Abbey Meads did not deter them from continuing taking readings.

So how questionable is that 2021 record when no other parts of the UK recorded any notable highs? For my part I simply cannot accept that such a dubious record could have been validated but, as was exposed at Faversham , nothing stops the Met Office in its pursuit of records and “hottest evah!”

via Tallbloke’s Talkshop

https://ift.tt/MKvqndQ

January 1, 2025 at 10:31AM

BBC Extreme Weather Lies Exposed

By Paul Homewood

h/t Ian C

 image

https://www.bbc.co.uk/news/articles/ckg8dg3ke40o

Even by their own standards, the BBC’s latest climate report, “A year of extreme weather that challenged billions”, is shockingly dishonest.

It’s the same load of lies they peddle every year – the world’s weather is getting more extreme, and it’s all due to global warming. And every year they trot out a handful of weather events to “prove” it.

They never, of course, provide any actual data to prove that these events are anything other than random, natural occurrences, which have always occurred. Nor any evidence that such events are getting more frequent or extreme over time.

This year’s review claims that:

“Climate change has brought record-breaking heat this year, and with it extreme weather, from hurricanes to month-long droughts.”

https://www.bbc.co.uk/news/articles/ckg8dg3ke40o

It goes on to list a heatwave in northern India, drought in the Amazon, six typhoons in the Philippines and floods in Sudan.

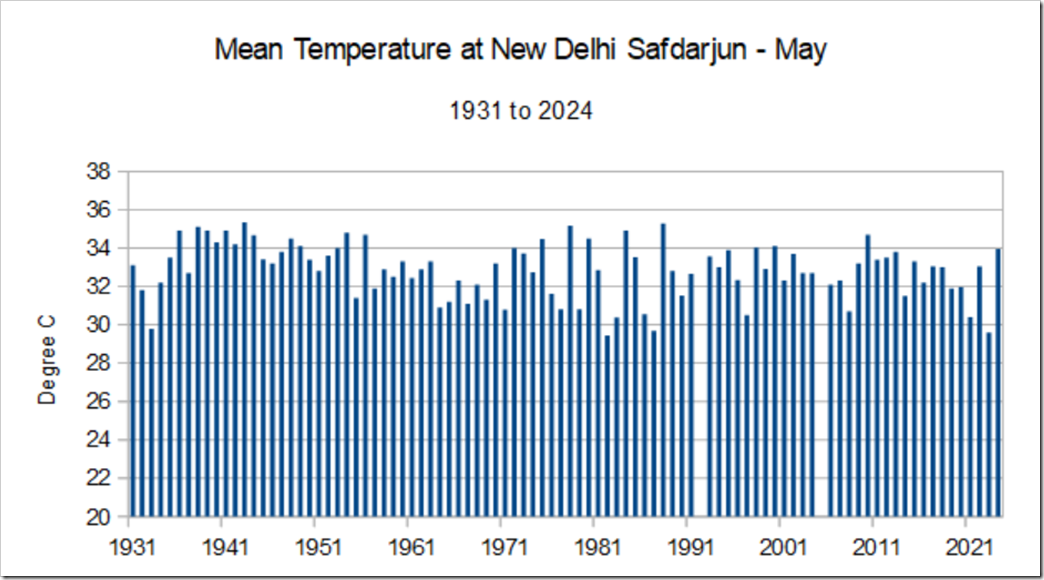
The Indian heatwave in May and June was covered by the BBC at the time here, when they called it unprecedented. It will come as no surprise to you that it was nothing of the sort.

Daily temperatures in Delhi never got near the record set in May 1944, whilst the monthly averages for May and June were not unusual at all.

image

https://notalotofpeopleknowthat.wordpress.com/wp-content/uploads/2024/07/image-58.png

https://data.giss.nasa.gov/tmp/gistemp/STATIONS_v4/tmp_IN022021900_15_0_1/station.txt

As for the Amazon drought, as an earlier BBC report explained, one of the major factors in low river levels is deforestation.

As far as the climate is concerned, the World Bank Climate Portal states that rainfall in the Amazon basin has been increasing in the last 30 years:

image

https://climateknowledgeportal.worldbank.org/country-profiles

The Philippines may have had more typhoons last year than average, but globally the number of tropical cyclones was lower than average.

image

https://tropical.atmos.colostate.edu/Realtime/index.php?arch&loc=global

And extreme rain in Chad and Sudan?

The World Bank Portal also highlights the catastrophic droughts in the 1970s and 80s – the Sahel Droughts, which directly resulted from global cooling.

To arid countries like these, you can never have too much rain.

observed-annual-precipit-2

observed-annual-precipit-3

https://climateknowledgeportal.worldbank.org/country/sudan/climate-data-historical

And as the World Bank country profile for Nigeria pointed out, floods have been exacerbated by deforestation, watershed degradation, land use, urbanisation and building on flood plains:

image


.

What particularly stands out about this latest BBC review, however, is its constant referencing to weather attribution models, which have long been debunked as unreliable, biased, unscientific and designed to garner headlines.

Actual facts are of no interest whatsoever to the BBC now, as far as climate is concerned. They live in their own little bubble, where fraudulent computer models reinforce their ideology.

via NOT A LOT OF PEOPLE KNOW THAT

https://ift.tt/y4Bglxc

January 1, 2025 at 09:32AM

Thursday

0 out of 10 based on 0 rating

via JoNova

https://ift.tt/F8lq1MN

January 1, 2025 at 08:53AM

Scientists Report A ‘Striking Global Greening Trend’ Over the Last 42 Years

By Kenneth Richard on 30. December 2024

The greening of the Earth’s vegetated areas is “attributed to CO2 fertilization, climate change, and land use changes.”

New remote sensing research (Gutiérrez-Hernández and García, 2025) uses robust statistical methods to eliminate false positives and spurious correlations in establishing vegetation trends in the satellite era.

The scientists find 38% of the Earth’s land surface has undergone statistically significant greening or browning trends over the last 42 years (1982-2023). Conventional methods (i.e., Mann-Kendall test) that had previously found 51% of the Earth’s surface experienced statistically significant vegetation trends in the satellite era may overlook crucial factors that produce less accurate, inflated results.

With this new analytical method, the True Significant Trends (TCT) test, the authors have robustly determined there has been a “striking global greening trend” attributed to CO2 fertilization and climate change.

“Applying a new proposed workflow methodology (True Significant Trends, TST) we reveal a striking global greening trend, with a significant portion of the Earth’s terrestrial land surface showing increases in vegetation cover over the past four decades, particularly in Eurasia.”

Specifically, 76.1% to 85.4% of statistically significant vegetation trends indicate greening, whereas browning trends account for 14.7 to 23.9%

“Among these significant trends identified using the TST workflow, 76.07% indicated greening, while 23.93% indicated browning. Notably, considering areas (pixels) with NDVI values above 0.15, greening accounted for 85.43% of the significant trends, with browning making up the remaining 14.57%. These findings strongly validate the ongoing global greening of vegetation.”

In other words, greening trends dominate over browning trends at a ratio of about 4:1, or 80% to 20%.


Discover more from Watts Up With That?

Subscribe to get the latest posts sent to your email.

via Watts Up With That?

https://ift.tt/YPC2TKw

January 1, 2025 at 08:00AM