The Environment Agency has today (Tuesday 17 December) published new data showing 6.3 million properties across England are based in areas at risk of flooding from one or a combination of rivers, the sea and surface water.
Using the best available data from both the Environment Agency and local authorities, the new National Assessment of Flood Risk (NaFRA), provides a single and updated picture of the current and future flood risk from rivers, the sea and surface water for England. The last update to NaFRA was in 2018.
Alongside this, the Environment Agency has also updated the National Coastal Erosion Risk Map (NCERM) for the first time since 2017. This provides the most up to date national picture of the current and future coastal erosion risk for England using the best available evidence from the National Network of Regional Coastal Monitoring Programmes.
The Environment Agency has used cutting-edge methods to create new, bespoke software to integrate detailed local flood risk models – both its own and those of local authorities – into a national picture. For the first time, both NaFRA and NCERM account for the latest UK climate projections from the Met Office.
These updated assessments provide a clearer understanding of flood risk around the country and the data will be used by the government, Environment Agency and local communities to plan for and improve flood resilience in areas at risk.
The data shows that a total of 6.3 million properties in England are in areas at risk of flooding from one or a combination of rivers, the sea and surface water.
Around 4.6 million of those properties are in areas at risk of flooding from surface water, where there is so much rainwater that drainage systems are overwhelmed, causing surface water runoff, also known as flash flooding. This is a 43% increase on the Environment Agency’s previous assessment. These changes are almost entirely due to significant improvements in the Environment Agency’s data, modelling and use of technology providing a more accurate assessment of surface water flood risk.
Around 2.4 million properties are in areas at risk of flooding from rivers and the sea. While the total number of properties at risk is not increasing, there is an 88% increase in the number of properties at the highest levels of risk, where an area has a greater than one in 30 chance of flooding in any given year. There are a variety of reasons for this change in risk, the most notable being improved data and modelling methods for assessing the likely frequency of flooding.
With climate change, the total number of properties in areas at risk from rivers and the sea or surface water could increase to around 8 million by the middle of the century – or around one in four properties.
Naturally the media has gone into full alarmist mode. Sky News, for instance, tried to link all of this to climate change, with emotive language like “sudden rain, crashing seas and burst river banks”.
In reality, as the EA make clear, most of the increase in risk identified is simply due to “improvements in data and modelling”.
Either way, the EA guesstimate of 6.3 million properties, one-in-five, are at risk is utterly absurd.
Their own database shows that only about 5000 homes were flooded in the y/e March 2024, a fairly average year for floods. Even in 2007, the worst year since they started keeping records, the figure was just 55,000.
Our house is classified as “Low Risk”, despite the fact we live on the side of a hill and have never had any remote risk of flooding, even during the Sheffield floods in 2007.
The town we live in has a population of 20,000+, and the only homes I have ever seen affected by surface water flooding are a handful at the bottom of the valley. These incidents are always caused by blocked drains and are merely inconvenient, with an inch or two of water lapping at the front door.
I suspect it is the case that our whole town is listed as “Low Risk”, on the basis that a dozen or so homes are at risk. This is because the EA work on “areas” rather than “individual properties”.
In short, the 6.3 million properties supposedly at risk is probably more in the region of 60,000.
The IPCC and the climate “consensus” believe that essentially all warming since 1750 is due to man’s emissions of CO2 and other greenhouse gases as shown in figure 1 here or in (IPCC, 2021, p. 961). This has led to a 45-year search for the value of the Equilibrium Climate Sensitivity to the doubling of CO2 (“ECS” in °C per 2xCO2). Yet, after spending 45 years trying to calculate the sensitivity of climate to man-made greenhouse gases, the “consensus” has been unable to narrow the uncertainty in their estimates and, if anything, the climate model uncertainty is now larger than in earlier reports(IPCC, 2021, p. 927). It is now clear, at least to me, that modern climate models make many critical assumptions that are poorly supported and sometimes conflict with observations. This is an attempt to explain some of these problems and how they developed over time. It is long past time for the “consensus” to stop ignoring the obvious weaknesses in their 60-year old conceptual model of climate.
The Early Models
Syukuro Manabe built the first general circulation climate model with several colleagues in the 1960s (Manabe & Bryan, 1969) and (Manabe & Wetherald, 1967). He started with a one-dimensional radiative equilibrium model of horizontally averaged temperature but realized that the troposphere was not in radiative equilibrium because of convection. The lower atmosphere is nearly opaque to most surface emitted infrared radiation or Outgoing Longwave Radiation (OLR) because of greenhouse gases. As a result, Earth’s surface is not cooled much by emitting radiation but instead mostly by the evaporation of surface water that carries surface heat into the atmosphere as latent heat inside water vapor. Water vapor is less dense than dry air, so it rises. Once the water vapor is high enough, it cools as the surrounding air pressure drops allowing air parcels to expand, causing the water vapor to condense which releases its latent heat. If this is done at a high enough altitude, some of the latent heat can make it to space as radiation or make it to surrounding greenhouse gas molecules higher in the atmosphere. The rest of the released heat simply warms the neighborhood. This process is called the “moist adiabat.”
This process works because temperature declines with altitude in the troposphere according to a ”lapse rate.” The lapse rate varies a lot around the Earth, but the average gradient stays fairly constant at about 5.08 °C/km (Benestad, 2017, pp. 24-26, supp. mat.). The lapse rate is usually given as a positive number, but it is the decrease in temperature with height. The value we most often hear is 6.5 °C/km, even though the true average rate is lower. The actual lapse rate at any given location and time of day varies a lot, it also varies with humidity, and by season. The lapse rate can be negative, a state called a temperature inversion.
For Manabe’s early models he added a constraint on the lapse rate so that it could not rise above a fixed and assumed value so the model correctly predicted the position of the tropopause. The tropopause is the altitude where the temperature gradient stops being controlled by convection. Above the tropopause, the atmosphere is closer to thermal equilibrium and temperature rises with altitude. In Manabe’s early models the tropospheric lapse rate was assumed to be linear and fixed (Held & Soden, 2000).
Manabe also assumed fixed relative humidity and fixed cloud cover. As Held writes, it is an oversimplification to assume the lapse rate does not change with temperature, but it was a convenient assumption (Held & Soden, 2000). The assumption of fixed relative humidity results in an implausibly high sensitivity to CO2. In the tropics the temperature profile is similar to a moist adiabat (described above). The condensation of water vapor at altitude is the process that forms clouds (Held & Soden, 2000). Climate models have a very tough time reproducing the tropospheric temperature profile in the critical tropical regions because they predict too much warming due to greenhouse gases (IPCC, 2021, p. 443).
In the higher latitudes the moist adiabat does not work, since sensible and latent heat horizontal transport by mid- and high-latitude storms play a significant role in the overall climate (Held & Soden, 2000).
The Fixed Lapse Rate Assumption
A fixed lapse rate means that the global average emission temperature never changes, thus the outgoing longwave radiation doesn’t change, except briefly as the surface temperature changes. A common description of the greenhouse effect (GHE) includes a diagram of the lapse rate shown in figure 1 from (Held & Soden, 2000).
Figure 1. Held and Soden’s greenhouse effect model. Notice the effective emission temperature does not change, thus the amount of OLR does not change.
Figure 1 illustrates what doubling CO2 does with a fixed and linear lapse rate in Held’s simplified model. The additional CO2 warms the surface with additional back-radiation, then the assumption of a fixed lapse rate kicks in, forcing the emission level up to a higher altitude, which means it has a lower temperature, causing it to emit less to space. Since it is emitting less radiation (aka “heat”), after a short period, the new emission level warms to the temperature of the old emission level and the effective emission temperature remains unchanged, as does the OLR (Held & Soden, 2000).
This simple model of the GHE has many problems. It is really only appropriate in perfect conditions in the tropics, and even there the lapse rate at night is different than the lapse rate during the day. In addition, the model predicts way too much warming in the tropics. In the middle latitudes, with persistent horizontal circulation and many storms, it makes no sense at all. In the polar regions, especially in the long dark winters, the atmosphere is frequently warmer than the surface, completely invalidating the model. Further, currently global average OLR is increasing as the globe warms. It is not remaining the same as predicted by the model, although the total incoming solar radiation has changed very little.
OLR is increasing
Figure 2. Plot of HIRS (purple line, the high-resolution Infrared Radiation Sounder on NOAA and EUMETSAT’s satellites), CERES (green line, Clouds and Earth’s Radiant Energy System instruments), and ERBE (light blue line, Earth Radiation Budget Satellite) OLR at the top of the atmosphere. GISS global average surface temperature is shown in yellow. The solar cycles (SC) during this period are noted as well as the SILSO sunspot count in dark green. After (Dewitte & Clerbaux, 2018).
Figure 2 suggests that Held and Soden’s model of how the greenhouse effect works is incorrect or CO2 is not the reason for the recent warming, as explained by Javier Vinós here. Notice the qualitative pattern in OLR matches each solar cycle in shape. This suggests that the solar cycles contribute to the OLR pattern. So, while the increase in CO2 might influence recent warming, the variations throughout a solar cycle also likely contribute.
ENSO and the AMO
From 1950-1975 Dewitte’s cumulative MEI (the Multivariate ENSO Index) was decreasing, suggesting a period of strong Las Niñas. From 1975 to 1998 it was increasing, suggesting a period strong Los Niños. From 1998-2014 it was flat and Los Niños and Las Niñas were more or less equal. This is illustrated in figure 3.
Figure 3. Cumulative MEI Index, MEI, and AMO. After: (Dewitte & Clerbaux, 2018).
The deep blue line in figure 3, with no marks, is the AMO or Atlantic Multidecadal Oscillation. Notice that it roughly corresponds with the cumulative MEI index. This suggests that the North Atlantic sea surface temperatures are related to the frequency of Los Ninos and Las Ninas in some fashion (An, Wu, Zhou, & Liu, 2021), or they both follow some other influence, like solar variability. Again, it looks less likely that CO2 is the “climate control knob” (IPCC, 2021, p. 179).
Clouds and ECS
From (Loeb, et al., 2021):
“Climate is determined by how much of the sun’s energy the Earth absorbs and how much energy Earth sheds through emission of thermal infrared radiation. Their sum determines whether Earth heats up or cools down.”
This is a vast oversimplification, as it ignores the impact of energy residence time which varies continuously. Energy residence time varies as a function of atmospheric and oceanic circulation trends, which are influenced by solar variability (see figures 5.3, 5.4, and 5.5 here).
Loeb, 2021 notes that an increase in absorbed energy by the Earth from 2005 to 2019 is accompanied by a decrease in cloud cover (see figure 4). The decrease in cloud cover reduces reflection of incoming solar energy, but also decreases absorption of outgoing surface IR by clouds. Dewitte (see above) reports an increase in outgoing longwave radiation at the same time.
Kauppinen & Malmi, 2019 report that low cloud cover has decreased, as shown in their figure 2.
Figure 4. Total global cloud cover as a percent of the sky. Data from EUMETSAT CM-SAF.
As explained in Kauppinen & Malmi, 2019 low cloud cover (as well as total cloud cover) decreases as the “pause” in global warming starts around the year 2000. Overall, as low cloud cover increases 1%, global average surface temperature decreases 0.11°C on average. As a function of EUMETSAT global cloud fraction, the HadCRUT4 global surface temperature decreases 0.15°C per one percent total cloud cover, as illustrated in figure 5.
The data displayed in figures 2 through 5 cannot be explained as a function of the monotonically increasing atmospheric CO2 and other greenhouse gases and their so-called “heat trapping” or “OLR delaying” capabilities. While additional greenhouse gases may have some influence on increasing surface temperatures, we cannot see any sign of this influence in these data.
Ceppi & Nowack, 2021 try to show that cloud cover responds to surface temperature and figure 5 appears to support that idea. However, they and the IPCC believe that changes in cloud cover due to a warming surface increase warming on net, that is cloud cover changes due to surface warming are a net positive feedback (IPCC, 2021, p. 95). They are vague in their language and do not claim that increasing cloud cover increases warming, rather they say the net change in cloud cover due to surface warming is a positive feedback. Thus, they break clouds up into types, some are net warming, and some are net cooling, with the overall change being positive.
Figures 4 and 5, and the work of Kauppinen & Malmi suggest that an increase in clouds, as the world warms, decreases warming. Figure 2 suggests that OLR increases as the world warms and cloud cover decreases, this is not what one would expect if cloud cover changes are a net positive feedback to surface warming. However, the two ideas are not necessarily incompatible as neither the IPCC, nor Ceppi & Nowack say increasing cloud cover increases warming, they say “cloud cover changes” increase warming on net. Time will tell if their complex hypothesis is correct.
Ceppi & Nowack explicitly assume that greenhouse gases are causing global warming according to the RCP4.5 scenario. They do not consider the possibility that variations in solar activity (figure 2) or ocean oscillations (like the AMO plotted in figure 3) have an impact. Loeb, 2021 does discuss changes in the PDO, but not as a driver in climate change, just a type of internal natural variability.
As Ceppi & Nowak report, ECS correlates very well with cloud cover, see figure 2 here. It is also true that cloud cover is the most uncertain feedback in greenhouse gas climate models and climate modelers have reported fiddling with their cloud parameters (Koonin, 2021, p. 93) to achieve a pre-determined ECS. It lessens our confidence in climate models when the most uncertain and poorly understood component of them (clouds) is used to create a desired result. Further, as AR6 WGI reports on page 927, the ECS calculated by climate models is becoming more uncertain and the reason given is that the modelers are fiddling more with their cloud parameters to try and match cloud observations. Something is clearly amiss in modern climate models, and the problem is getting worse with time.
EEI (Earth Energy Imbalance)
The net radiation in or out is the Earth Energy Imbalance or EEI. When it is positive the Earth is warming and collecting heat and when it is negative the Earth is cooling. Because most solar energy absorbed on Earth’s surface is stored in the oceans (~90%) the ocean heat content is a sensitive indicator of long-term EEI and can be used as a check and calibration point for satellite radiation measurements which are not accurate enough on their own to directly measure EEI (Loeb, et al., 2022).
Table 1 in (Loeb, et al., 2022) lists the absorbed solar radiation (ASR), the outgoing longwave radiation (OLR), and the net radiation in (positive) and out (negative) for various satellite instrument analyses. The trends vary from 0.026 to 0.42 W/m2/decade ±~.24. This is a fairly large and uncertain difference. The numbers are positive since the world is warming.
The actual EEI and the trend in the EEI are unknown, but ocean heat content estimates from 2005 to 2019 suggest it is small and between 0.24 and 0.98 (±~0.7) W/m2/decade according to Table 4 in (Loeb, et al., 2022). ARGO has greatly increased our knowledge of ocean temperature to a depth of 2,000 meters, but trends in temperature below 2,000 meters and under sea ice are still largely unknown. It seems safe to conclude that the trend, since 2000, is somewhere between ~-0.7 and ~1.5 W/m2/decade and more likely positive than negative, because the Earth is warming, but beyond that it is hard to say. The total incoming solar radiation and the total outgoing longwave radiation are large numbers, with large uncertainty, and the difference between the two is very small and below the accuracy of current measurements.
The change in ocean heat content is useful as a check, but we don’t have a good handle on ocean temperatures, either aerially or at depth. ARGO improves things, but the coverage is still poor. As for measuring incoming and outgoing radiation, there are problems in the eastern Pacific, the Arctic, and in many other areas. For a complete discussion of the problems estimating the EEI trend the interested reader is referred to (Loeb, et al., 2022).
Conclusions
As I’ve written before the current group of IPCC/CMIP climate models do not compare well with observations, and unfortunately, in the tropics they do better if the man-made portion of the enhanced greenhouse effect is removed. It seems that the conceptual model they have pursued since 1990 (the first IPCC report) that CO2 is the “control knob” for global warming is flawed. There is abundant evidence that climate has many drivers, and man-made CO2 is only one, and one that may not be that significant. It is way past time that the IPCC quit pushing this man-made climate change idea and go back to the drawing board and develop a new conceptual model that makes sense with the data presented in this post.
From 1 January to 31 March 2025 the price for energy for a typical household who use electricity and gas and pay by Direct Debit will go up by 1.2% to £1,738 per year. This is because wholesale prices remain high due to global factors.
Ha! Those will be the global factors, which have a singular ability to turn their beady eyes on the UK?
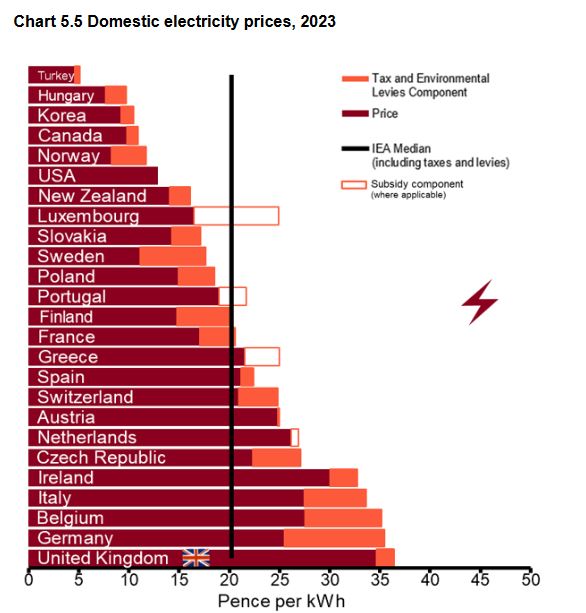
In reality, as sceptics know well, prices are high because of the best part of two decades of wanton and furious destruction of our energy system. And the malignant force at the heart of decision making is gleefully knocking a cold chisel into it. (Notice how small our “tax and environmental levies component” is. True dat, or…? (compare to head image.))
A point about the Energy Price Cap which is not I think widely publicised is the recent drop in the benchmark amount of energy a household uses, the TDCV or “Typical Domestic Consumption Value,” to which the goblins at Ofgem often append the word “value” for good measure:
Given our assessment and stakeholder feedback which supports amending the TDCV values, we intend to reflect the updated TDCVs in how we communicate the level of the price cap from the implementation date of 1 Oct 2023. We will ensure this change is communicated clearly and appropriately to all stakeholders. We will make clear that the revised TDCVs (all else held equal) will result in a lower level of the price cap that is being communicated, which is due to a downward revision of the underlying consumption assumptions, rather than a reduction in underlying costs.
To what extent people are aware that the price cap now relates to a lower energy consumption than prior to October 2023, I do not know. The annual gas usage of the “typical” home has dropped from 12 MWh to 11.5 MWh, and leccy usage is down from 2.9 MWh to 2.7 MWh, so that the price cap is automagically lower.
The upcoming price cap has the following characteristics:
Total: £1,739 (slight variation owing to rounding).
The figures in parentheses show what the price cap would have been before October 2023, all else kept equal. It is ~£82 lower than it would have been, but for the downward revision of TDCV.
Asterisk: the TDCV has already been reduced, back in 2020, although that might only have affected leccy. I lack the will to look it up.
Interestingly of course there is more than one reason for reducing consumption. One is that you no longer need as much of the product. The other is that you can no longer afford as much of the product. Here’s what National Energy Action says (22nd August, 2023):
There are two main reasons why the TDCV has been reduced.
Firstly, because there have been legitimate efficiency gains in UK households, through making the fabric of homes more energy efficient, and through white goods becoming more efficient over time.
Secondly, and more worryingly, demand has reduced over the last two years as households have rationed their energy in response to high energy prices. For example, polling conducted by National Energy Action (NEA) and Birmingham University found that 81% said they rationed energy that winter, while 55% rationed hot water and 13% had reduced the use of powered medical equipment at home in response to high prices.
The “typical” home is probably an estimate of the median. The DESNZ stats I have looked at (not shown here) use the average, which is higher than the median. [The average used by DESNZ has also been revised downwards.]
When pitching to be elected, Labour and its very earnest former leader promised to reduce consumer energy bills by £300. My interpretation of M. Miliband’s promise is that the energy price cap should be £300 less than it was in the last quarter before the election: April to June 2024. At this point it was £1,690.
That would mean Ed’s promise could be considered kept if at some future point during this parliament the cap came down to £1,390. (They have refused to put a timetable on things, against which they may be judged.) Of course, the figure of £1390 would not account for inflation, & would make the SoS’s task harder. What would make it easier would be if we ration our energy use some more, and also if the price cap drops anyway because Ofgem revises the TDCV down (also if we improve our energy efficiency, of course).
Some might argue that the July to October 2024 price cap should be Ed’s baseline, since it was announced on 24th May 2024, in advance of the election, i.e. it was based on the previous government’s efforts. This was lower at £1,568, which would make the job of shaving £300 off it more difficult.
So far, things are trending in the wrong direction: the January-March 2025 price cap is £1,738, as mentioned. Discounting inflation, we’re either £170 in the wrong direction, or £48, depending on when the start line is. And that’s not to mention the Winter Fuel Allowance.
On TV last week, Ed was seen to redefine his promise of £300 savings as “up to £300”. A saving up to £300 could be a saving of £1, as Naga Munchetty pointed out to him on BBC breakfast. (Good for her, because the breakfast presenters are usually too credulous. I gave up watching it at some point, when the proportion of actual news dropped so low as to make the whole unbearable.)
Here’s where I saw the clip with Naga: Mike Graham showed it when talking to the Bish on TalkTV.
Prediction: it seems to me quite obvious that the price cap can only go one way – north – unless M. Miliband is allowed to offload some of the costs onto general taxation. His failure will be waved away with several excuses, including that we are the cusp of a breakthrough when the critical level of weather-dependent generation is reached. In fact, the critical level is that at which we cease to grow, and start to retract. And to make a bolder prediction, we will begin to see cracks once the sugar rush of spending in the Budget has worn off. Twelve months from now will see the truth of it. For the UK, it’s either the golden era of growth of Starmer, Reeves and Miliband’s Milestones, or it’s the slow spiral into decay of Jit’s augurs of doom. Of course, there’s still time to change the road we’re on, as the man said.
Glossary for posterity
Default Tariff Cap
What Ofgem used to call the Energy Price Cap. Everyone else called it the Energy Price Cap, and Ofgem seems to have caved in in 2023.
Energy Price Cap
A default tariff – hey ho – introduced at the start of 2019. Back then, it was £1137. The idea was that people who had never switched provider, and were therefore getting ripped off compared to those who had, would save money. In practice, it seems that the tariffs all migrated to the capped price.
A notable side effect occurred in the escape from Covid lockdown in 2021. At this point, gas wholesale prices surged, but the small suppliers, who were not able to raise prices above the EPC, fell over like a row of dominoes. [And it’s worth noting that this happened before the rise in gas price associated with the Russian invasion of Ukraine in February 2022.]
Energy Price Guarantee
After the 2022 invasion, gas prices rocketed yet more. In September 2022, Liz Truss, the much-ridiculed ephemeral PM, decided to, in effect, cap the price cap. This was at a level of £2,500 for the typical home, when Ofgem wanted a price cap of £3,549. [They later wanted to hoik it to over £4 grand.] Truss also ordered that fracking be commenced, in order that the UK might have resilience against such events in future. Alas, we all know what happened to Truss, and to fracking, once the technocrats got the man they always wanted.
Let me offer you a choice: in one hand, you’ll have Starmer. In the other, Truss. You can only keep one. Which do you choose?
Energy Grant / Energy Bills Discount
A payment of £400, split I seem to remember into three tranches of £133, that Rishi Sunak (then Chancellor) announced in the wake of the Russian invasion. By the time it came to pass, he was probably PM.
Winter Fuel Payment
A payment to all pensioners, which I think was up to £300, which was canned by our new Chancellor, Rachel Reeves, once she had discovered a black hole at the centre of the Milky Way, I mean in the public finances. Now only the poorest get it, who have applied for pension credit.
Bonus image – Where domestic energy bill data is filed: