Ed Miliband has been doing the rounds again this week.
When challenged on the BBC Today programme about Labour’s promised £300 cut in energy bills, he doubled down.
Apparently, he said, they did not really mean £300, the key word was “up to”! So maybe just a pound then Ed!
He went to say that NESO, the National Energy System Operator, confirmed Labour’s Clean Energy plan would reduce electricity bills, even though NESO chairman had already told Parliament they could not guarantee it.
In fact, as I pointed out at the time, NESO’s costings clearly pointed to bills going up as a result of Labour’s policies.
So, to recap:
In their report to Ed Miliband last month, Clean Power 2030, they estimated that costs would INCREASE by £10/MWh:
However, this is not the whole story. They say that the cost of generation would drop by £15/MWh, but this is simply not true, as they themselves admit:
Note the reference to CARBON PRICES.
Their report goes on to confirm they have assumed a Carbon Price of around £60/MWh, the figure used by BEIS in their Electricity Generation Costs report published last year.
However, the Carbon Price is not a cost – it is effectively a tax. As BEIS noted in that report, this is valued arbitrarily, and is designed to artificially increase fossil fuel prices, so as to make them uncompetitive.
Furthermore, NESO have assumed a carbon price of £172/tonne CO2, which is way above the current market price of around £40/tonne. Based on gas generation of 100 TWh, the level last year, that extra £132/tonne equates to an extra cost on gas generators of £4.6 billion, which amounts to £15/MWh averaged over all electricity generation.
In other words, NESO have assume government policy will artificially increase the cost of gas generation, and thus wholesale market prices. This enables them to claim that renewables will reduce them!.
Increase a household bill from £1000 to £1500, and reduce it back to £1000 – but only claim credit for the reduction!!!!
So if we return to that first table, the claimed cost of generation reduction of £15/MWh is simply smoke and mirrors. It does not exist. Exclude the Carbon Price con trick, and costs remain around the same. This is not surprising, because we know that the AR6 strike prices are similar to or slightly above current market rates.
But the table also tells us that Miliband’s plan will INCREASE other costs by £25/MWh. This means an extra bill of £7.5 billion in 2030. While not all of this will go on to household bills, about half will, about £140 per home.
The BBC did not challenge Miliband on this, nor have I come across anybody else in the media who is even aware of this sleight of hand.
It goes without saying that these are all the official costings from NESO. I don’t think anybody seriously believes that decarbonisation will be anything like as easy or cheap as they make out.
The climate movement’s annual showpiece, the United Nation’s Conference of Parties (COP), held this year in Baku, Azerbaijan, has been exposed to an unprecedented level of disinterest – even dissent – from developing nations.
Leaders of some of the world’s most resource-rich, economically aspiring countries have opted to sit this one out, sending only low-level delegates, if any. This is the latest signal of a growing resistance to an anti-fossil fuel “gospel” advanced by the United Nations.
Last year’s COP28 in the Middle East, where oil wealth underpins entire economies, forced the climate community to confront its contradictions. Today, COP29 in central Asia continues this reckoning and presages the demise of an unscientific and anti-developmental policy framework wrecking global economies.
Host of COP29 Educates Climate Woke Delegates
The tone of COP29 itself is a marked departure from prior gatherings. In Azerbaijan, where oil and gas production are integral to the national economy, the summit’s host, Azerbaijani President Ilham Aliyev, called fossil fuels “a gift from God,” lauding their contribution to global prosperity and stability.
Fossil fuels have moved from being a taboo “elephant in the room” to a subject of open discussion at COPs. The leaders of countries in Africa and Latin America are freely questioning the premise of banning their use of fossil fuels while much of the developed world continues to consume record amounts of coal, oil and natural gas. The notion that high-income nations can dictate the energy agenda is seen as a remnant of a power structure that primarily serves the interests of the world’s most privileged.
The International Energy Agency projects that developing countries will see substantial growth in energy demand over the next decade, an expansion that cannot be met by renewables. Leaders in these regions understand that hydrocarbons are critical to achieving their development goals.
Unprecedented Pullout from COP Conference and Resistance from Global South
In a surprising move, Argentina’s newly elected president, Javier Gerardo Milei, withdrew his country’s 80-person delegation from Baku less than a third of the way into this year’s 11-day COP. He cited the need for pragmatic energy policies that encourage development rather than stymie it.
For Milei, whose presidential campaign was based on a pro-business, anti-bureaucracy platform, the message is clear: Policy must serve the economic needs of his country first. Argentina’s ongoing energy crisis, its untapped shale gas reserves and a crippling economic situation demand a level-headed approach that prioritizes national interests over global climate ideals that are both batty and corrupt.
Milei’s political philosophy resonates with a growing number of leaders in the Global South who view economic growth as paramount and recognize that access to energy is fundamental to achieving it.
Argentina’s departure from COP29 is a turning point that should serve as a wake-up call to the U.N. and its allies. The time for one-size-fits-all mandates is over. The rigid orthodoxy of fossil fuel divestment pushed by the U.N. and wealthy nations is losing ground, challenged by leaders who refuse to sacrifice their national interests to a destructive agenda.
For much of the Global South, the idea of an immediate energy transition remains, at best, aspirational and, at worst, profoundly out of touch. The reality is that fossil fuels still power 80% of global energy consumption. This isn’t just an inconvenient truth; it’s an inescapable basis of modern civilization that developing nations understand viscerally.
As the COP29 circus concludes in Baku, the world is seeing the crumbling of the long-held illusion that a global transition to green energyis feasible, much less fair and desirable. Developing nations are proclaiming that they will not be deprived of necessary energy sources by nations that continue to feast on the very fossil fuels they frown upon. The disconnect between rhetoric and reality is stark, and developing countries are calling attention to it.
Fossil fuels are not a relic of the past; for many countries, they are the key to a prosperous future – truly “a gift from God.”
Vijay Jayaraj is a Science and Research Associate at the CO2 Coalition, Arlington, Virginia. He holds an M.S. in environmental sciences from the University of East Anglia and a postgraduate degree in energy management from Robert Gordon University, both in the U.K., and abachelor’s in engineering from Anna University, India.
This article was originally published by RealClearEnergy and made available via RealClearWire.
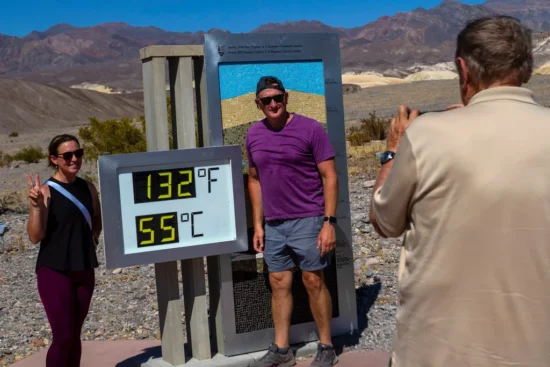
Previous research has shown the temperatures recorded at Death Valley National Park (DVNP) have curious warm biases on very hot days, possibly due to instrument deficiencies or proximity to mounting structure apparatus and other manmade structures.
Here it is shown from 21 years of summertime (June, July, August) data that DVNP has many more days when temperatures are much higher than those at the nearby Stovepipe Wells station, than when Stovepipe Wells has hotter days than DVNP station.
These lines of evidence suggest that the hot summer daytime temperatures reported at Death Valley National Park have potentially large biases, and should only be used for their entertainment value.
In our continuing examination of the world record hottest temperature of 134 deg. F recorded at Greenland Ranch (now Death Valley National Park station) on 10 July 1913, we are finding some curious behavior in recent summertime temperatures there. (The Bulletin of the American Meteorological Society [BAMS] has accepted my proposal for a BAMS article showing the evidence that the 134 deg. F world record was 8 to 10 deg. F higher than what actually existed on that date [10 July 1913]).
Previous Work on Excessively Hot Death Valley Temperatures
Weather forecaster and storm chaser Bill Reid has blogged extensively over the years on the evidence against the 134 deg. F world record. A good place to start is his most recent post (Part 6) that deals with the Greenland Ranch foreman who made the excessively hot temperature measurements in the first half of July 1913. Bill has agreed to co-author the BAMS paper with John Christy and me.
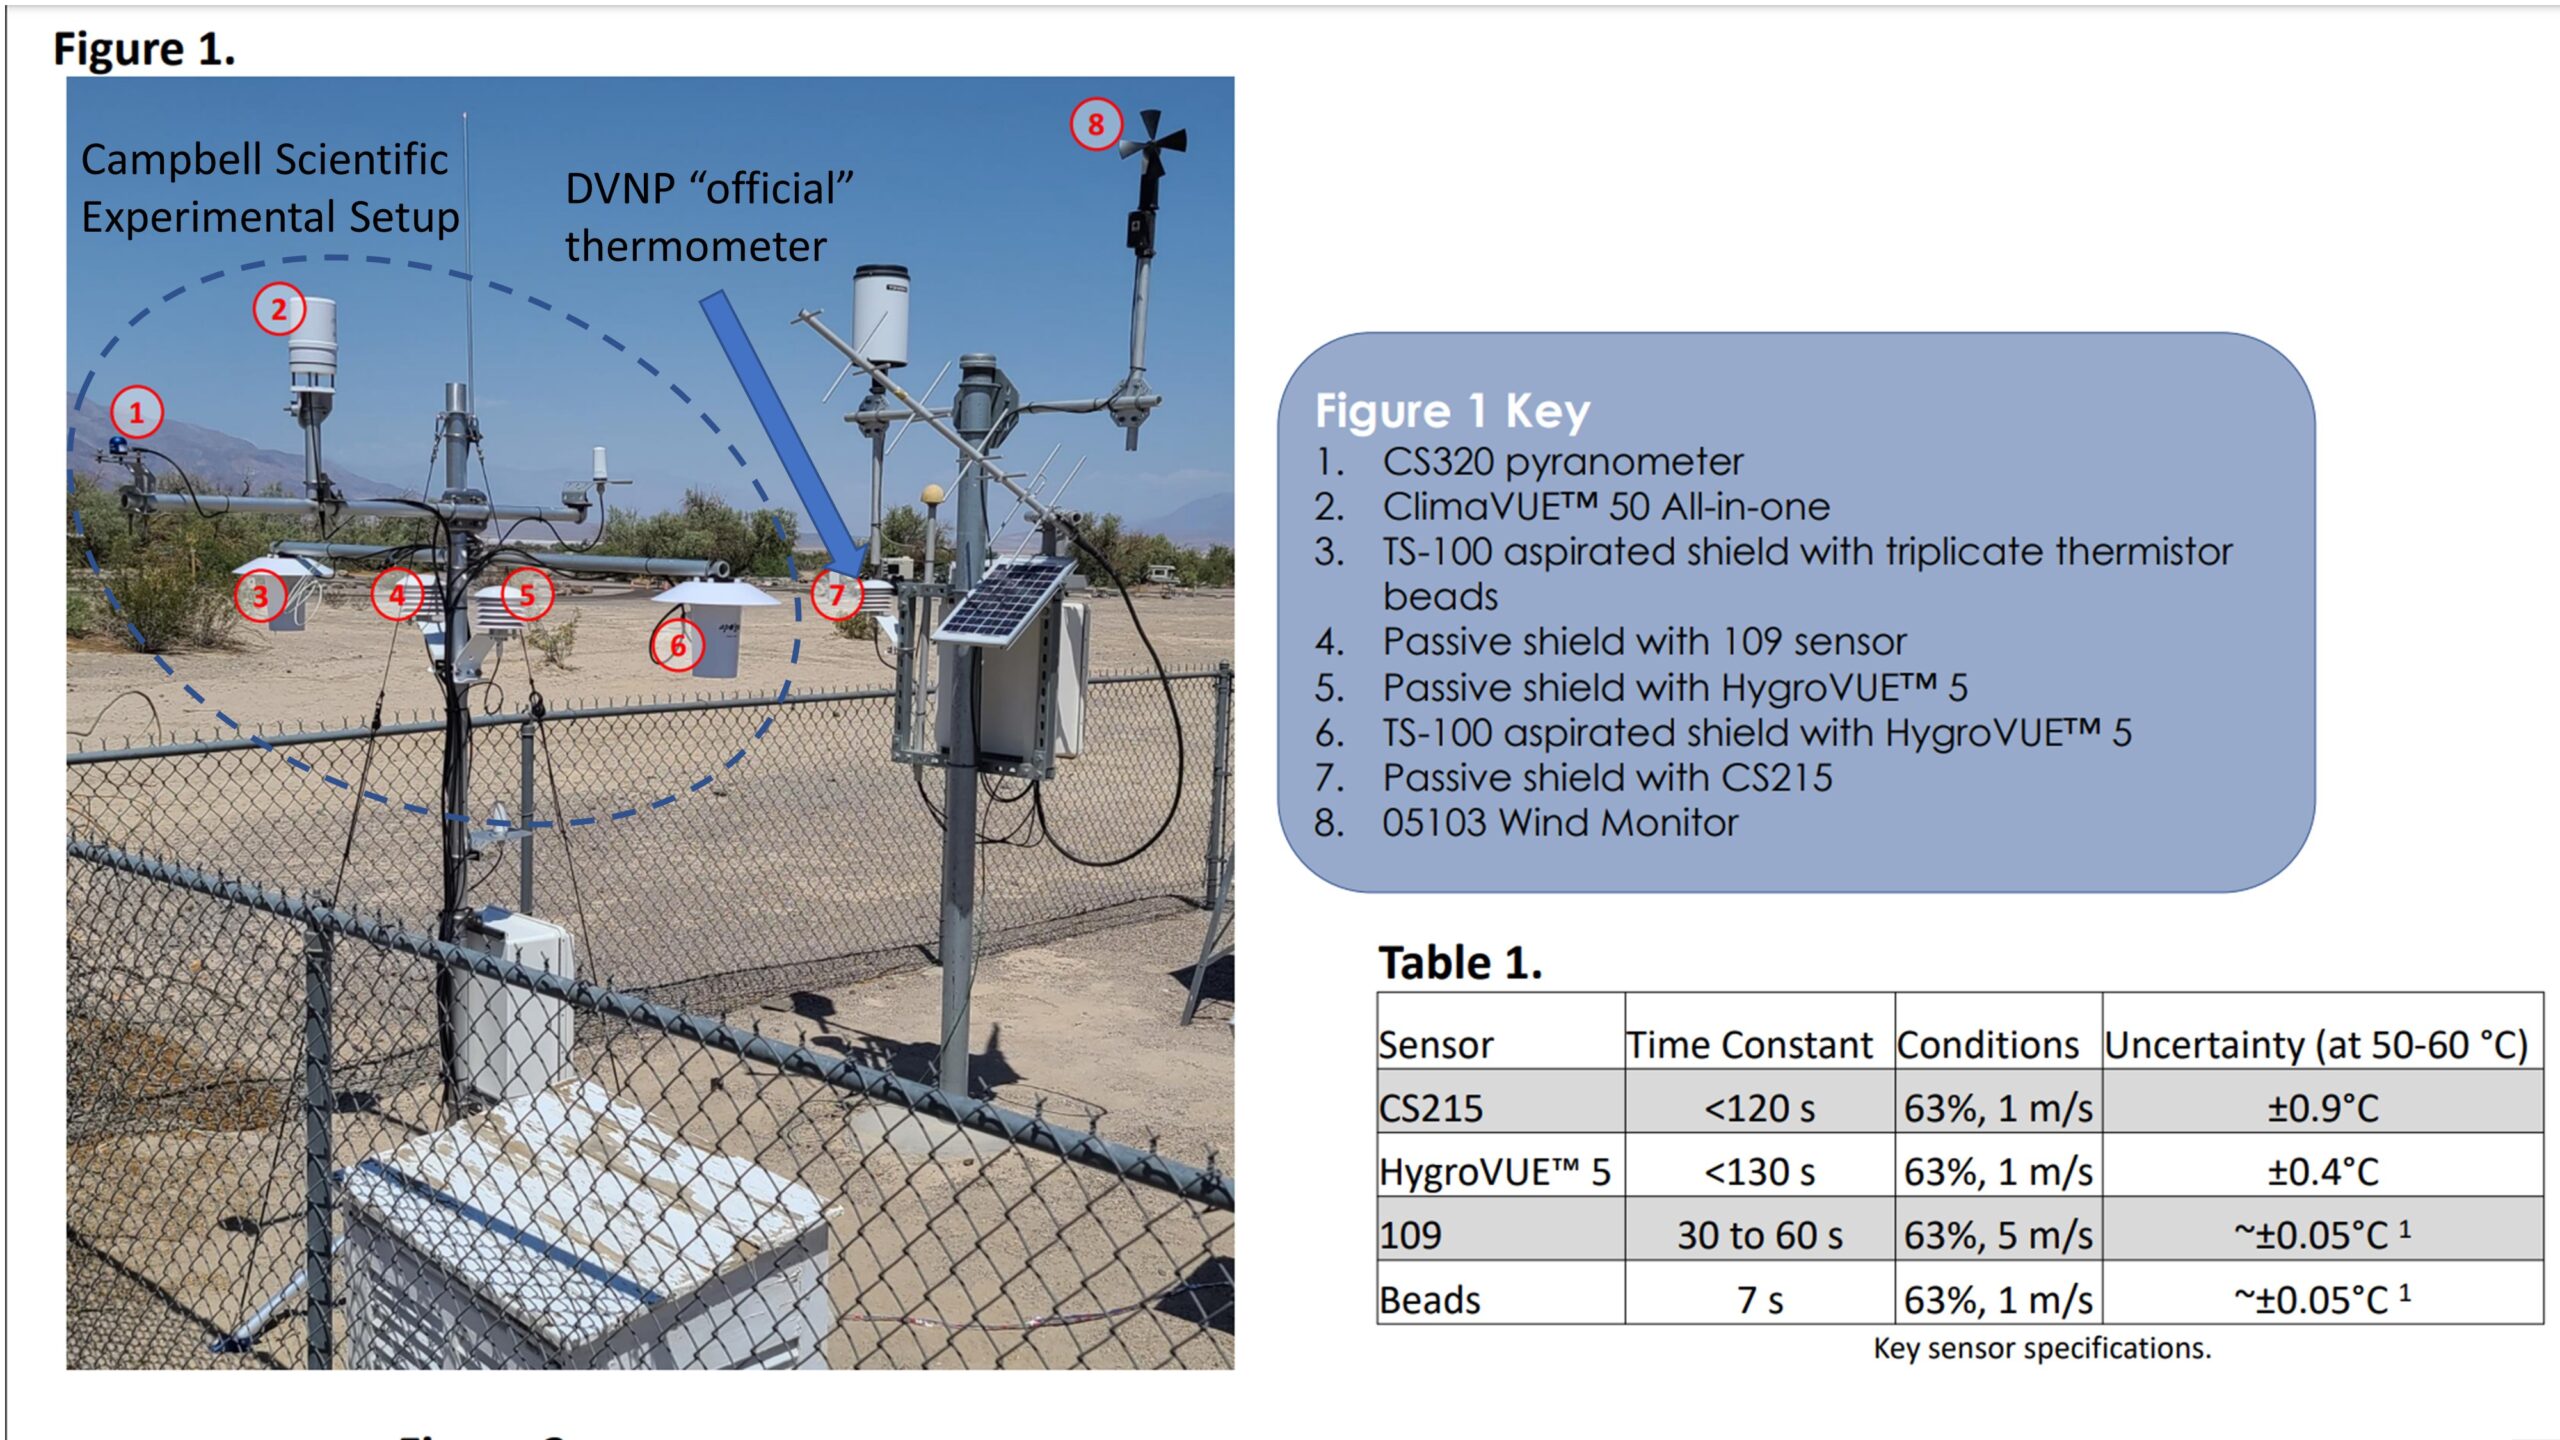
There was also an experiment carried out with a variety of temperature instrumentation placed next to the DVNP weather station during 2021 and 2022. This revealed that on the near-record hot day of 9 July 2021 (130 deg. F), the “official” DVNP sensor produced temperatures a few degrees hotter than the other instruments (AMS conference poster here). The photo in Fig. 1 shows that the older-style DVNP instrument (which is not aspirated) is mounted next to a lot of metal structure and a small solar panel.
Fig. 1 Death Valley National Park weather station, with additional instrumentation added by Dirk Baker (Campbell Scientific, Inc.) and co-investigators to compare to the ‘official’ temperature readings in 2021 and 2022. (Figure adapted from this AMS conference presentation).
The experimental setup in Fig. 1 used several temperature sensors, some with aspirated shields, others with no aspiration. The data shown in their AMS conference presentation suggests to me that the near-record 130 deg. F reading on 9 July 2021 was 2-3 deg. F too hot partly because of the non-aspirated design of the sensor. There was some additional warm bias that could have been due to all of the mounting structure seen in Fig. 1, including a small solar panel next to the DVNP station sensor.
More Evidence: DVNP vs. Stovepipe Wells Temperatures
For the last 21 years there have been two stations in Death Valley: the DVNP station next to the Furnace Creek Visitors Center, and a climate reference network (CRN) station at Stovepipe Wells, 29 km northwest of the DVNP station.
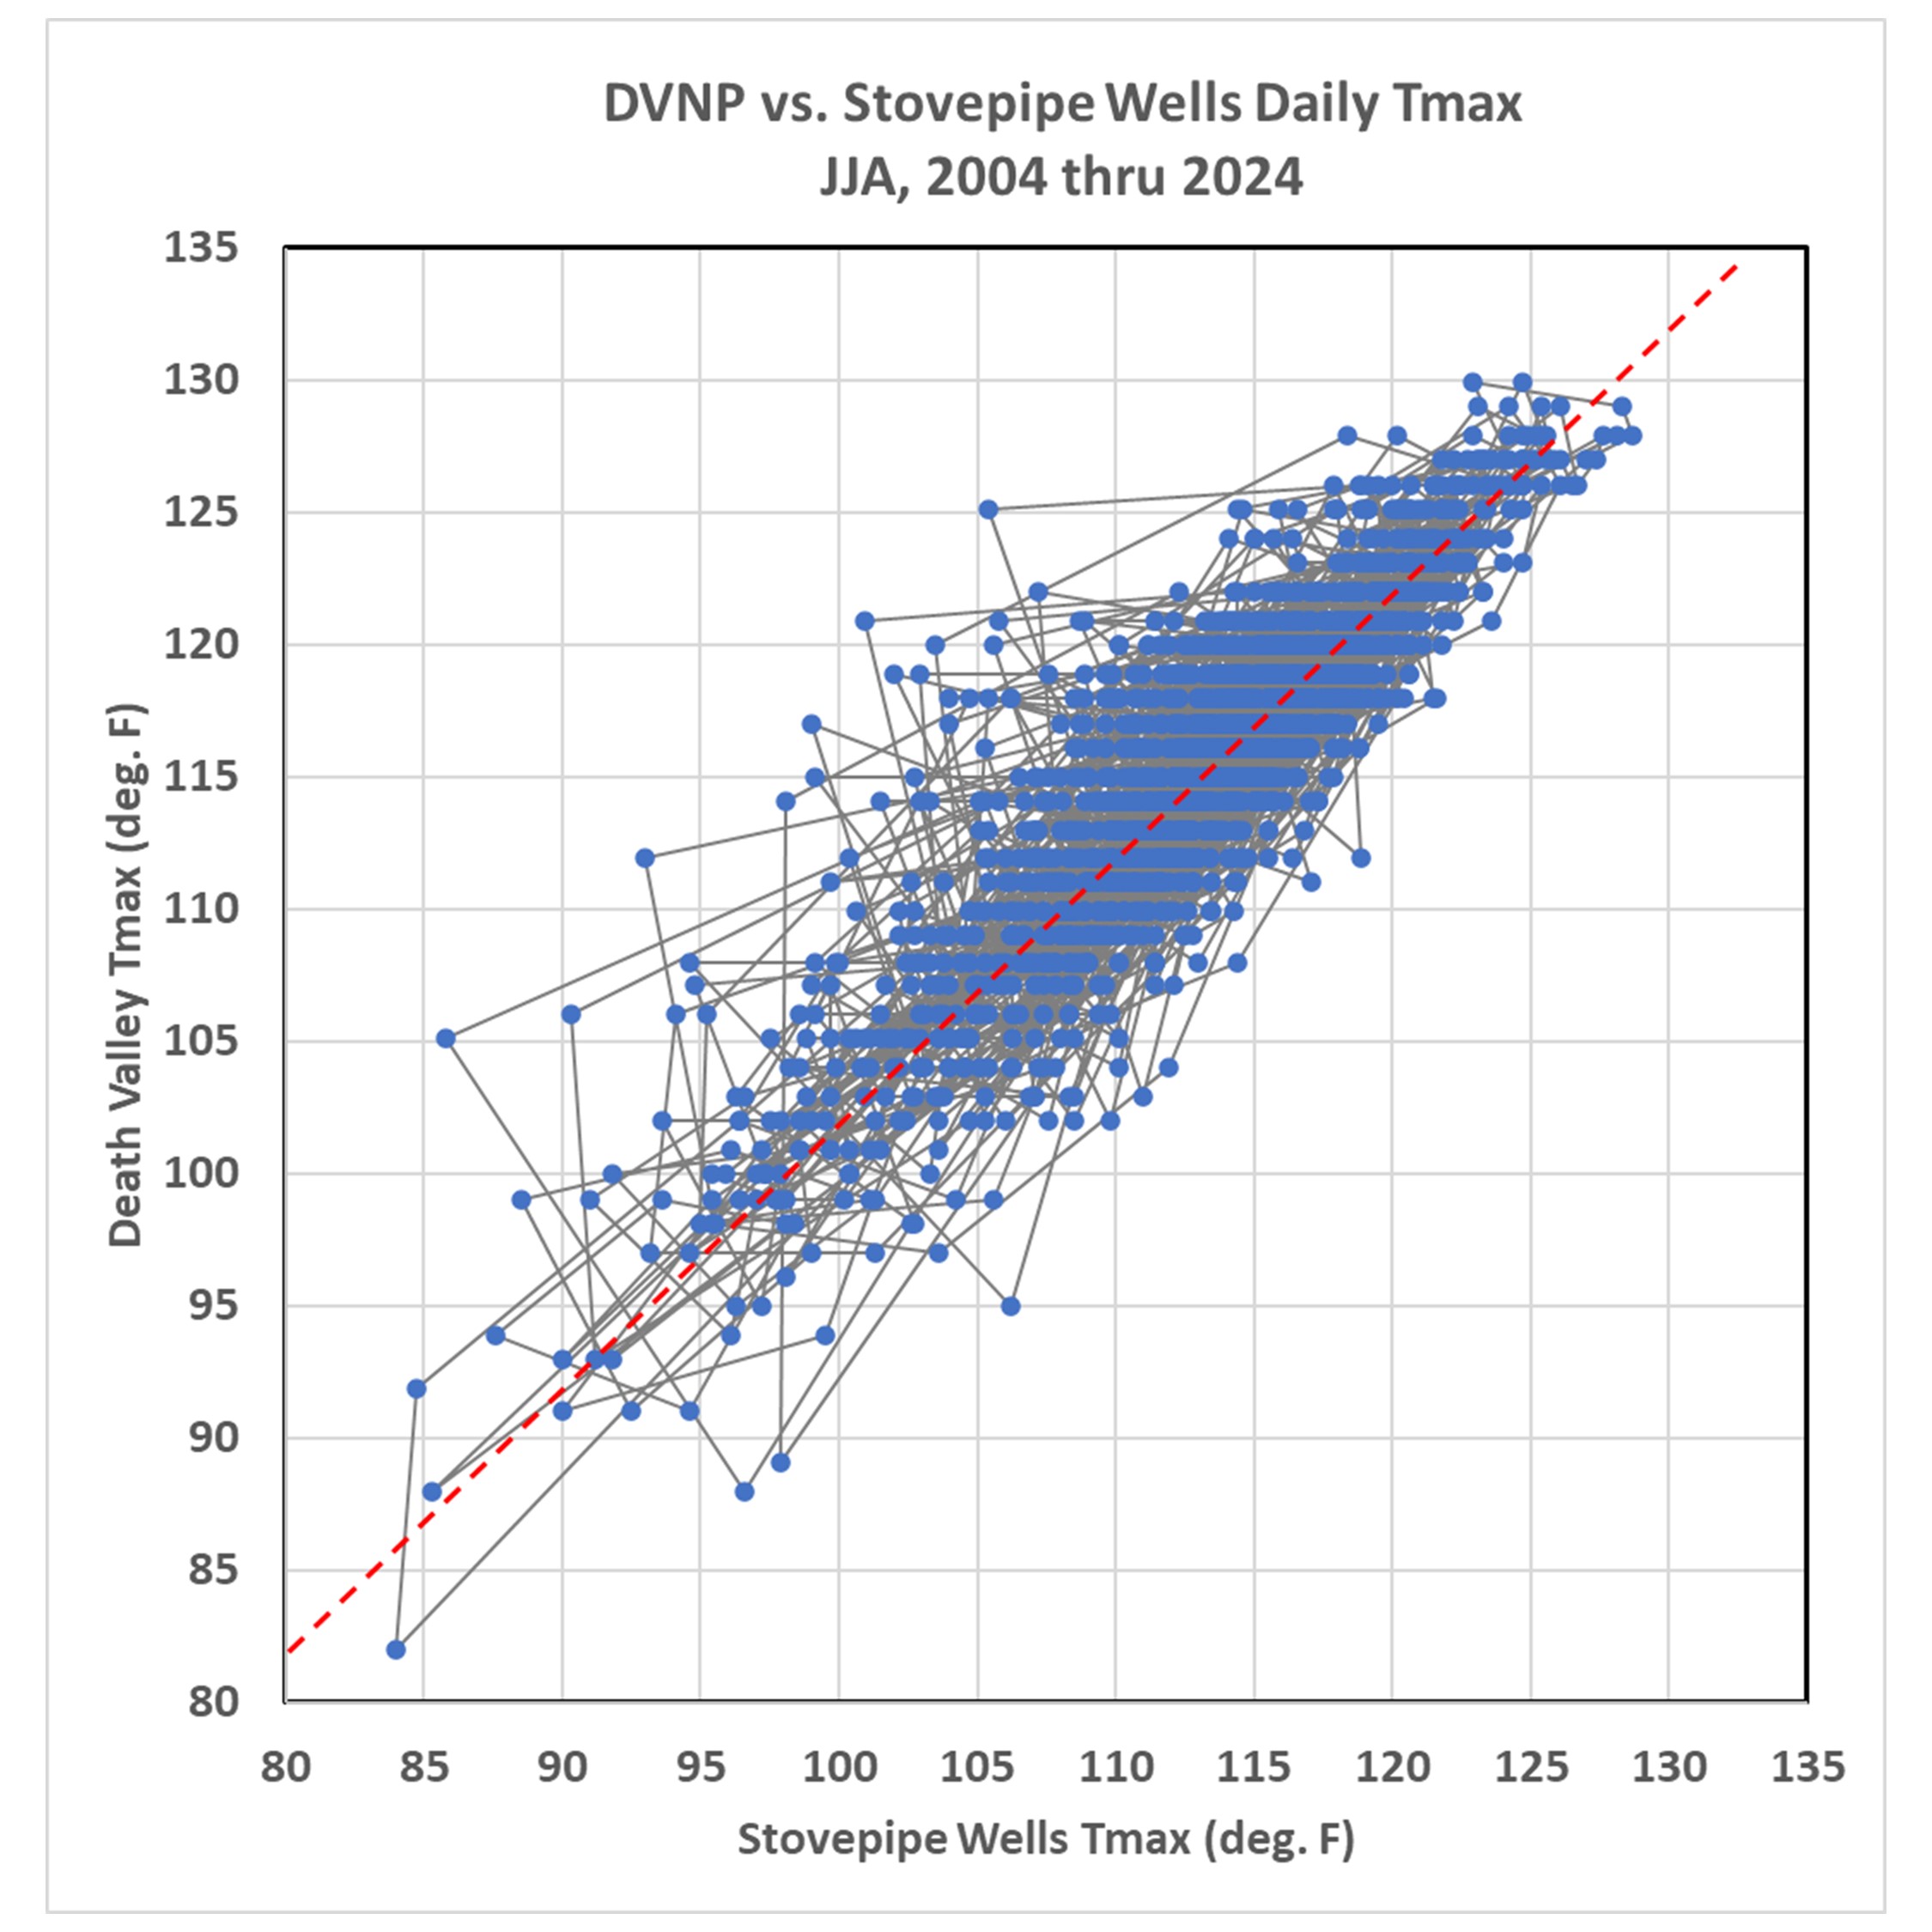
Fig. 2 shows a comparison of the daily maximum temperatures (Tmax) recorded at these two stations for every day in June, July, and August in all years from 2004 through 2024.
Fig. 2. Comparison between daily high temperatures (Tmax) recorded at Stovepipe Wells and Death Valley National Park, for all days in June, July, and August for the years 2004 through 2024. The dashed red line represents the median difference between the 2 stations (2 deg. F, DVNP warmer than Stovepipe Wells). Gray lines connect the days in chronological order.
The median of the Tmax differences between these 2 stations is 2 deg. F (DVNP warmer, represented by the dashed red line), while the average difference is 2.3 deg. F. The expected difference based upon elevation alone is 1.3 deg. F (DVNP station is 278 ft lower in elevation than Stovepipe Wells).
Note in Fig. 2 that there seem to be more outliers to the left of the dashed red line than to the right. That is, there are more days where DVNP is much warmer than Stovepipe Wells than there are days when Stovepipe Wells is much warmer than DVNP station.
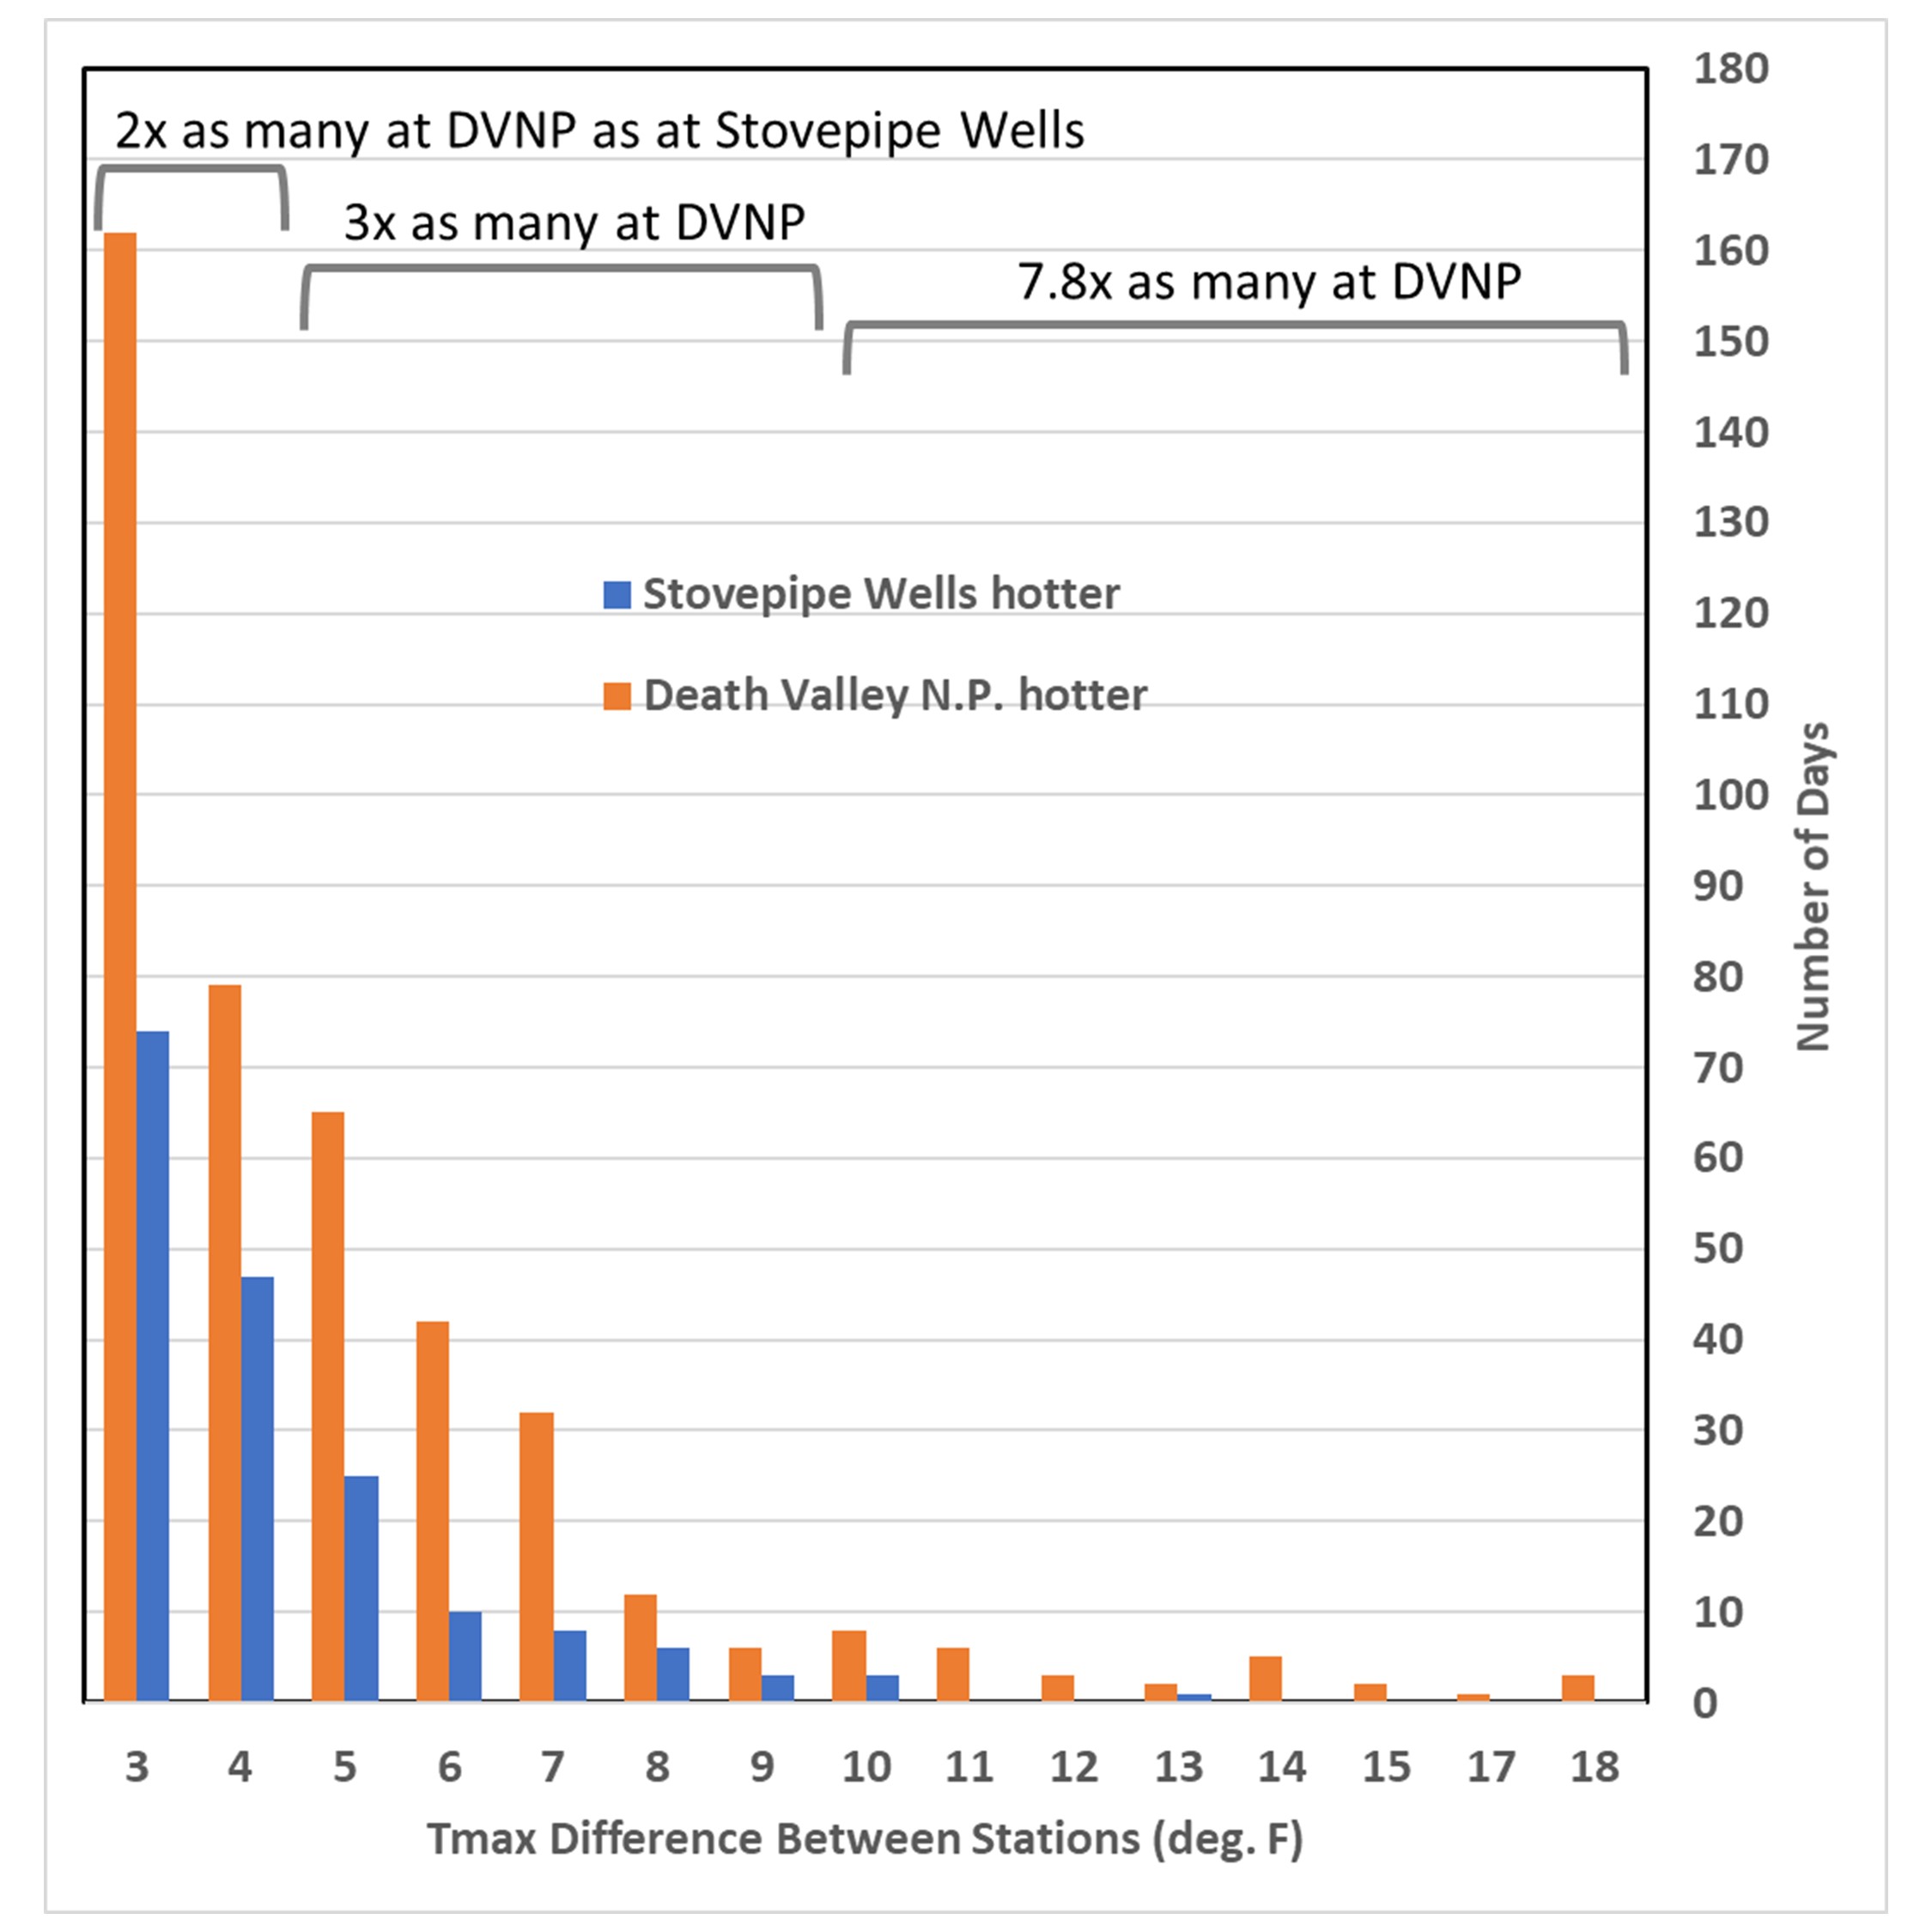
This can be better seen if we look at a frequency distribution of these station differences, adjusted for the 2 deg. F median difference between stations (Fig. 3).
Fig. 3. Frequency distributions of how many days where one Death Valley station is hotter than the other. This is after shifting of the distributions to account for a 2 deg. F difference in their median difference.
As shown in Fig. 3, DVNP station has many more days where it is hotter than Stovepipe Wells, than Stovepipe Wells has days that are hotter than DVNP station. For the 3-4 deg. F hotter category, the difference is 2X, for the 5 to 9 deg. F hotter category the difference is 3x, and for 10 deg. F or greater the difference is 7.8X.
This suggests there is something wrong with the Death Valley National Park instrumentation itself or the immediate environment around the temperature sensor that causes some days to be biased too hot. Bill Reid, who has researched this issue extensively, suspects that days with low wind have excessive heat build-up at the DVNP thermometer site, both in the general area around the instrumentation, and due to the non-aspirated design of the temperature sensor used there.
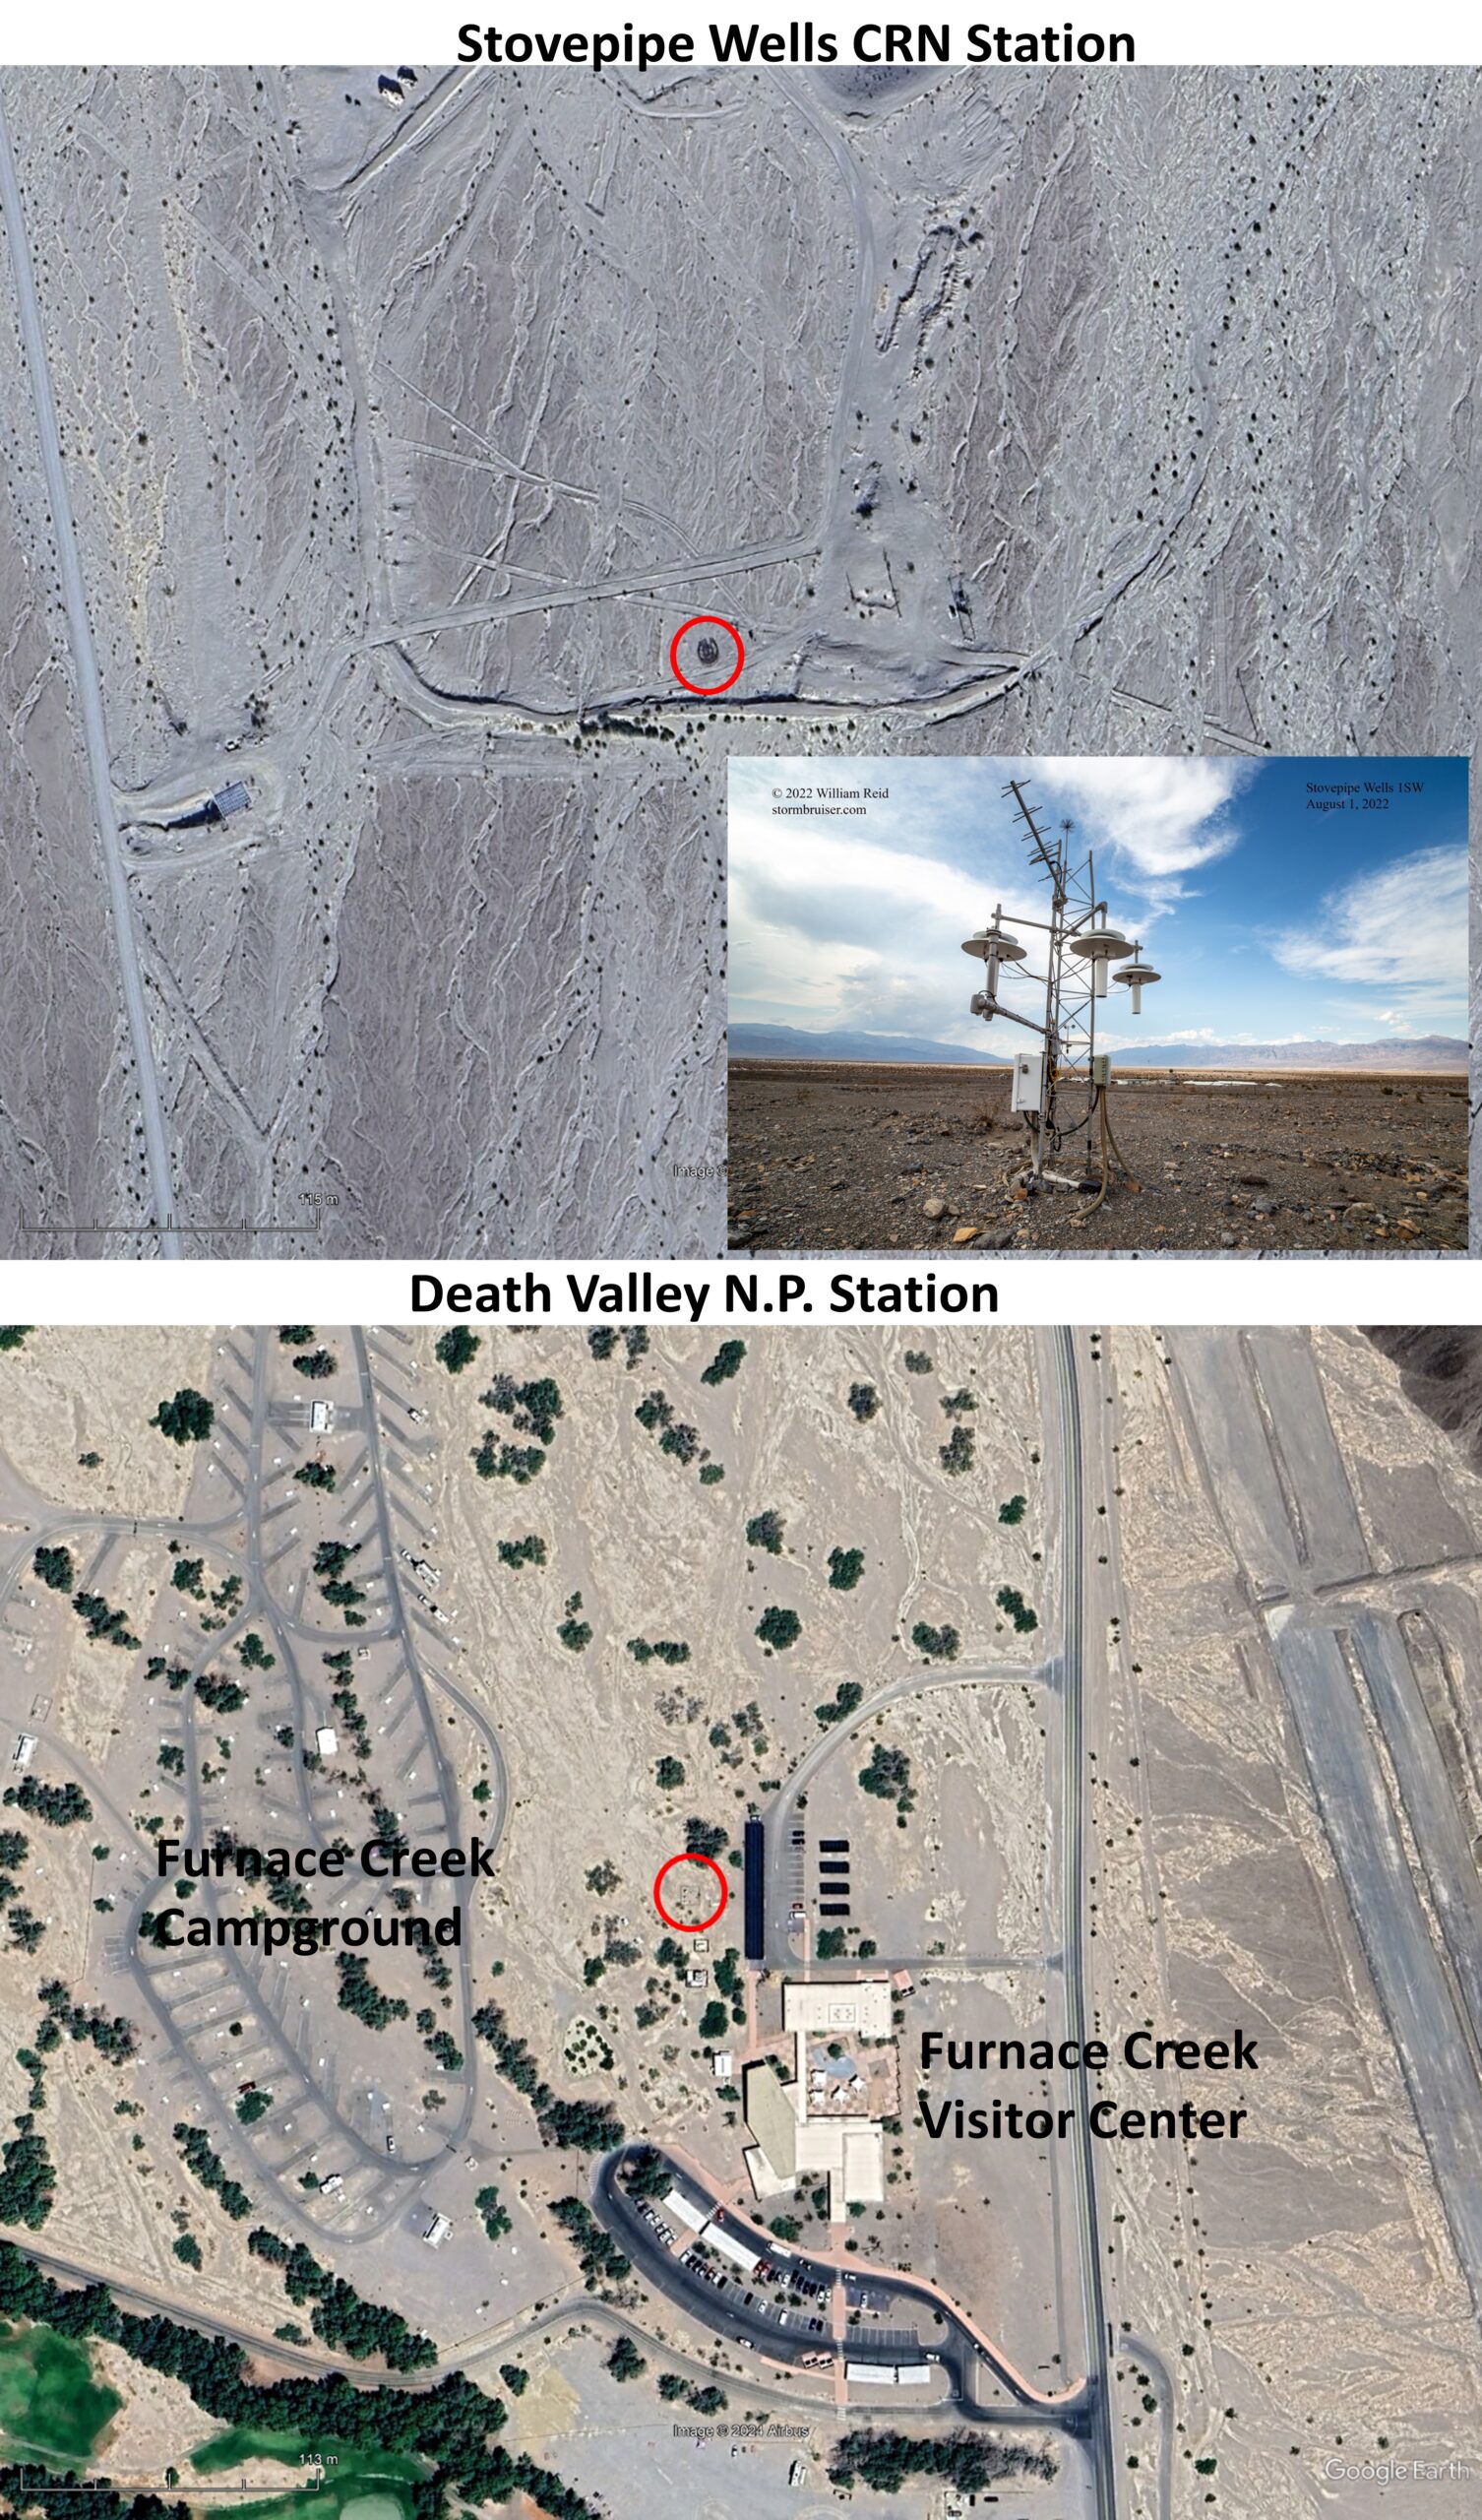
The difference in exposure at DVNP station and Stovepipe Wells is shown in Fig. 4.
Fig. 4. Google Earth imagery of Stovepipe Wells station (top) and Death Valley N.P. station (bottom), stations circled in red. The inset photo at top is of the Stovepipe Wells Climate Reference Network station, courtesy of William T. Reid. The E-W distance across these images is just over 0.5 km.
As can be seen in Fig. 4, the Death Valley N.P station has quite a bit of development surrounding the station, with parking lots, a paved campground, the Visitors Center, solar panels (black) and trees just to the south. The Stovepipe Wells site has almost no development and no vegetation. It is possible that during the prevailing southerly wind flow during the summer, the structures and trees to the south of the DVNP station lead to stagnation of air flow around the temperature sensor.
Conclusions
The evidence presented here, along with evidence presented previously by Bill Reid, Dirk Baker, and others, suggests that Death Valley National Park temperatures should not be relied upon for accurate daytime readings, and that near-record temperatures there are biased too high. The reasons for the biases are not obvious, but the evidence suggests poor sensor ventilation during the daytime when various structures in the vicinity heat up: whether the shield of the sensor itself, its supporting structure, or various manmade objects around the station site. It is also possible that the trees and other structures to the south of the station restrict air flow, further reducing effective convective heat transport away from the solar heated desert surface.
It is my opinion that “official” Death Valley temperatures should use the Stovepipe Wells site data, which come from state-of-the-art Climate Reference Network instrumentation. The traditional site near the Death Valley National Park Visitors Center should only be used for entertainment purposes.
Maybe the National Park Service should investigate adding a CRN station; a good location would be about 1.6 km southwest of the current station, well away from the Furnace Creek tourist area.

 .