Countdown to Agony

The day before the Lancet Countdown was released, the BBC ran a figure from it showing how droughts had changed in frequency over the past 70 years. Sceptic and alarmist alike would have expected a positive trend, although probably for different reasons. This sceptic though: he flew into a rage at what seemed a clear case of a lie in support of the Net Zero agenda. For it was impossible for the data to represent any version of reality; it indicated that before 1980, there were no deserts on the entire Earth, as the percentage of the Earth suffering from a 6-month drought before that time was trivial.

And what of the vast deserts that we know existed at that time? Erased.

My assumption at the beginning was that the Lancet Countdown’s authors had made a horlicks of compiling the data. It seemed the only logical possibility. We know there were deserts; their figure shows no deserts; the data must show deserts, so some slip has occurred, ‘tween cup and lip.

So your correspondent decided to emulate the figure, and (presumably) triumphantly demonstrate what it was supposed to look like, if the data were handled correctly.

Here’s how the Countdown put it:

[The drought] indicator uses the Standardised Precipitation Evapotranspiration Index to monitor the intensity and length of droughts on all land areas. The total proportion of global land affected by extreme drought for at least 1 month per year increased from 15% in 1951–60 to 44% in 2013–24. In 2023, 48% of the global land area was affected by at least 1 month of extreme drought—the second-highest level since 1951 and only 2% less than the record in 2020.

Sounds like tosh to me. But at least we have the identity of the drought index. So I put on my “Climate Auditor – Level Nought” badge and tried to emulate the figure. Because the data are in NetCDF format, I had to make a little program in R to handle it. I’m grateful to my son Dan for reading it through and checking the logic of it. [Should anyone want the code, it is available.]

Here’s my emulation, which should match the deep red line (the 6-month line) in the figure given in the Countdown’s supplementary information, and in the BBC news item:
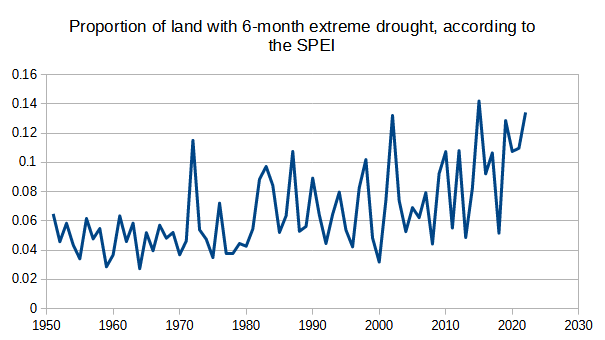
Well, it doesn’t match, but it shows a clear rise. [Asterisk: my data ends in 2022, because I stopped the loop counter 1 iteration too early.] Mine starts rather higher than the Countdown, and ends rather lower; but there’s no disputing the rise itself. Why the difference? I suspect this is in part due to the way I have interpreted things. My interpretation of a 6-month drought in a year includes 6-month droughts that overlap either the preceding year or the succeeding year as well as 6-month blocks within the year. Thus, if in October 1987 a drought began at a certain place and continued into March 1988, I counted that as a 6-month drought “occurring” in both years. And this may explain my higher beginning – but not my lower ending.

Having concluded that drought had gone up, according to the SPEI, and agreeing with the Lancet, I began to wonder whether some jiggery-pokery had gone on in the generation of the index itself. So I had to find out how the sausage was made.

Going back to the Lancet’s figure and the mere ~2% of the Earth’s surface that was suffering a 6-month drought prior to 1980: how can this percentage be reconciled with the known area of desert? A search of the internet tells us that a third of the Earth’s surface is desert. No-one is suggesting that deserts have spread, are they? In fact, it is well known that the surface of Earth is, on the average, “greening.” (An awful shorthand for the expansion of vegetation.) Of course, this is admitted grudgingly by some. Take this 2020 article by Burrell, Evans & de Kauwe in Nature Communications. Its title:

Anthropogenic climate change has driven over 5 million km2 of drylands towards desertification

Within which is said:

We also observed widespread global greening, with 18.0 million km2 of drylands having a significant positive vegetation change…

[Thanks to the miracle molecule, CO2 increasing the efficiency of water use by plants; but the authors decided instead to highlight in their title the rather smaller area that had gone the other way. And how exactly is this supposed to increase trust in climate science?]

So the bare minimum area for 6-month droughts prior to 1980 should be around 33%, not 2%. And that does not even consider the area of arid lands.

What is needed is a drought metric that shows that deserts are not experiencing droughts.

When you realise that, everything else becomes obvious. Here’s how the originators of the SPEI describe the way they have transformed it to make measurements at different sites compatible [p2]:

For this reason, it is necessary that SPEI series at different sites have the same average (x = 0) and Standard Deviation (SD = 1); the same is applicable to series of the SPEI recorded at the same location but at different time-scales.

Would you want a drought index to indicate how dry things are? I would. That way, deserts would have a high drought index score, and rainforests would have a low drought index score.

But that isn’t what happens here. In order to make the desert and the rainforest comparable, they both have an average SPEI index of 0. They also have the same level of variation. It seems crazy.

[ASTERISK: You may define drought as a period of low rainfall, or a period of unusually low rainfall. Under the second definition, a desert is not suffering a drought. However, since desert is a consequence of drought, I’m not down with that definition.]

But still: the area of drought has gone up globally, and you can’t argue with that.

Well, I can argue with it, and I will.

Before we go any further, we should make clear that the figure legends on the BBC report are untrue. Whether we describe this as misinformation or disinformation is up to us. They are wrong. The reason why there were no droughts before 1980 is because the index is not measuring drought.

It’s measuring an index of relative dryness and moisture where every place on the Earth has the same average value and standard deviation, no matter how dry or wet it is.

How is the index calculated? To answer that will surely show us what has gone on to produce such an outrageous increase in the index over the recent decades? [p1]:

…the SPEI uses “climatic water balance”, the difference between precipitation and reference evapotranspiration (P – ET0), rather than precipitation (P) as the input.

We can, in looking at the basis for this index, make the bold guess that precipitation, P, has not changed over the past hundred years. It seems quite clear that the lion’s share of the change in the underlying formula comes from the change in ET0. The climatologist, in searching for an increasing drought, would not overlook “just” precipitation, if that had gone down. As if. Here’s CRU TS precipitation, up to 2017 (from Harris et al’s description of CRU TS V4):
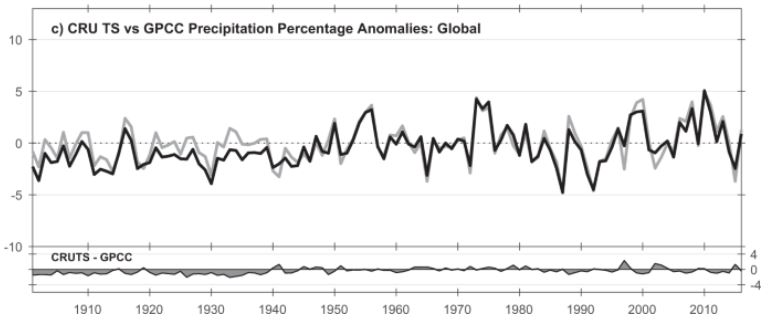
No change there. What about the other part of the index? What is ET0?

It’s reference evapotranspiration, calculated using some other climatic variables.

But before I describe the process in rough, let me just say a tad about the other variable: precipitation. SPEI uses CRU TS data. But CRU TS does not have records for every grid square (0.5 degrees) on every month since 1901, when the SPEI begins. In fact, in CRU TS a good bit of interpolation has gone on from “nearby” stations where there actually were measurements. And for places out of range of the interpolator, they are filled in by the climatology, assuming there is one.

Now ET0. How does CRU TS provide a number for reference evapotranspiration for every grid cell? These are the variables that we need (Harris et al again):

….we use the CRU TS gridded values of mean temperature, vapour pressure, cloud cover and static (temporally invariant except for the annual cycle) 1961–90 average wind field values.

Right, so we have mean temperature at quite a few places, or at least it can be estimated from the min and max temperatures, with a judicious bit of interpolation, and the usual pitfalls of UHI etc. What about the others?

Vapour pressure: do we have much data on that? Do we have humidity? Er, no. Instead, we calculate vapour pressure using Tmax and Tmin.

Cloud cover: do we have much data on that? No. Instead, we calculate it from… Tmax and Tmin.

Wind field values: well, they say themselves that this is simply the climatology, although presumably the climatology is itself of dubious worth.

So the only thing that really varies here is temperature. Everything else is a secondary variable driven by temperature. So when we get to the stage of calculating drought,

(P – ET0)

All we have got is precipitation minus a complex function of temperature.

As we know, the world is hotter than it was. CRU TS shows an increase starting in about 1980 (Harris et al):
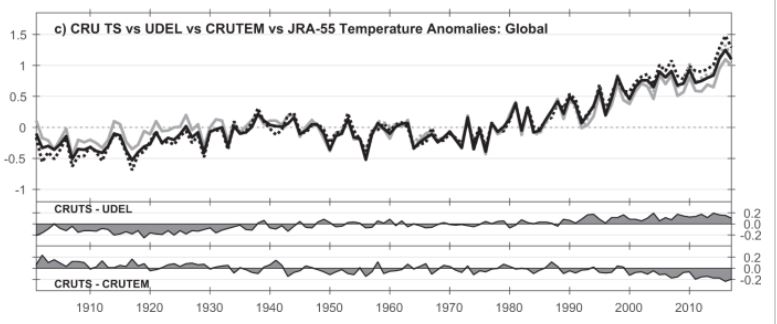
Therefore the value of (P – ET0) has, on the average, gone down since about 1980. Remembering that over the entire series, the overall average for every grid cell has to be 0, it’s obvious that:

In calculating the SPEI, then more recent values will be on average more negative, purely because of the rise in temperature.

Given this, it is now possible for us to produce wholly misleading figures claiming a large increase in drought, when what there has actually been, is a modest increase in temperature.

And how easy it is to slip such figures into the public domain, and hardly anyone bats an eyelid, even when confronted with obviously impossible figures!

Conclusion:

  1. The figure in the Countdown supplementary information is rubbish, and its reproduction at the BBC is misinformation or disinformation.
  2. Because precipitation is not playing ball, climatics have introduced new indices, which supposedly take into account the “true” effect of climate change on droughts, by including things that do not measure actual drought, and only serve to exaggerate the state of peril our world is in.
  3. Such indices do not, of course, include the positive effect of CO2 on making photosynthesis more efficient, which easily swamps whatever negative effect the climatics can generate with their added effect of increased temperatures.
  4. Droughts are not spreading or worsening.

References

Description of the standard precipitation evaporation index by Begueria et al: https://digital.csic.es/bitstream/10261/90646/1/BegueriaS_IntJClimatol_2013.pdf

Burrell et al:
Burrell, A.L., Evans, J.P. & De Kauwe, M.G. Anthropogenic climate change has driven over 5 million km2 of drylands towards desertification. Nat Commun 11, 3853 (2020). https://doi.org/10.1038/s41467-020-17710-7

Harris et al’s description of CRU TS V4:
Harris, I., Osborn, T.J., Jones, P. et al. Version 4 of the CRU TS monthly high-resolution gridded multivariate climate dataset. Sci Data 7, 109 (2020). https://doi.org/10.1038/s41597-020-0453-3

Lancet Countdown: https://www.thelancet.com/journals/lancet/article/PIIS0140-6736(24)01822-1/fulltext [Free to read with registration]

SPEI database: https://spei.csic.es/database.html

Addendum

The title of this post is of course a reference to Countdown to Ecstasy, the 1973 album by Steely Dan. Whether you know this song or not, now is the time to kick off your shoes, pop on your cans, start thinking about nuclear apocalypse, and press play. Heck, even light up a cobalt cigarette too, may it please you. You’ll be glad you did.

via Climate Scepticism

https://ift.tt/K2QBSIw

November 7, 2024 at 01:38PM

What President Trump’s Landslide Election Victory Means for Science

Guest “Somebody call a wambulance” by David Middleton

‘We need to be ready for a new world’: scientists globally react to Trump election win

Trump’s decisive defeat of Kamala Harris spurs fear about the future of the United States among many researchers.

Scientists around the world expressed disappointment and alarm as Republican Donald Trump won the final votes needed to secure the US presidency in the early hours of 6 November. Owing to Trump’s anti-science rhetoric and actions during his last term in office, many are now bracing for four years of attacks on scientists inside and outside the government.

“In my long life of 82 years … there has hardly been a day when I felt more sad,” says Fraser Stoddart, a Nobel laureate who left the United States last year…

[…]

Worries pouring in this morning align with those expressed by the majority of readers who responded last month to a survey conducted by Nature. Eighty-six per-cent of the more than 2,000 people who answered the poll said that they favoured Harris, owing to concerns including climate change, public health and the state of US democracy. Some even said they would consider changing where they live or study if Trump won.

[…]

Nature

“Some … said they would consider changing where they live or study if Trump won.”

“Well… bye”

Maybe this is the problem…

Eighty-six per-cent of the more than 2,000 people who answered the poll said that they favoured Harris…

This seems to imply that there was damn near one of those 95% scientific consensus thingies. I’m a scientist, a geologist, and I wasn’t surveyed. However, I’m fairly certain that the several dozen geoscientists and engineers I work with every day, would have expressed more than 85% support for President Trump. It all depends on who you ask.

Maybe these “scientists” need some therapy puppies

“Bonnie and Clyde” are ready and willing to help out.

Deal with it

Four years ago, we had to deal with the results of the shamdemic* and the 2020 coup d’état.

(*Shamdemic: government-imposed economic lockdowns and other tyrannical measures in response to ChiCom-19.)

Biden had literally promised to destroy our oil & gas industry and spent the next four years trying to deliver on that promise. We had to deal with that reality. He failed largely due to our victories in court, the resilience of our industry and the fact that the Marcellus Shale and most of the Permian Basin are under state and privately owned lands.

The silver lining to the shamdemic

They used the shamdemic to wage a tyrannical war on individual liberty. This assault on liberty changed our nation’s political dynamic. In 2020, could anyone have imagined that such a diverse a political alliance would form around Donald Trump? J.D. “Hillbilly Elegy” Vance, Tulsi Gabbard, Robert F. Kennedy Jr., Elon Musk, Vivek Ramaswamy, Dana White, Hulk Hogan, Kid Rock and now… Joe Rogan? I used to ridicule many of those people. Now they are heroes to me.

(Truth Social / realdonaldtrump)

The Trump II administration will make science great again.

Making energy great again

Trump vows to cut energy costs in half — and he has a real plan to do it

By  Post Editorial Board

Published Aug. 29, 2024

[…]

He’ll “slash red tape,” ramp up approvals of new power plants, spur nuclear energy, and roll back Democrats’ fossil-fuel restrictions.

Hear, hear! It’s the all-of-the-above strategy that led the nation to become in Trump’s first term.

And it would once again yield huge gains not just for America, but the entire Free World.

As former Interior Secretary David Bernhardt made clear on a campaign press call, such plans are vital to future prosperity.

“Between soaring demand and retiring coal, we are facing a great [energy] capacity shortfall of at least 30% by 2032,” Bernhardt warned — arguing that Team Harris-Walz can’t make up the difference thanks to “their net zero vision.” 

Democrats are too obsessed with reducing carbon emissions, and so block not only new gas- and oil-drilling, but also new pipelines, refineries, fossil-fuel power plants (and cars and stoves and heating) and so on.

Under Trump’s plan, Bernhardt predicted, “every manufacturing plant, every data center, every semiconductor facility and assembly line will want to be built in America — because America will be the place where the cost of energy is lower than anywhere else on Earth.”

Those lower costs will help rein in inflation in America as well: After all, energy — electricity for manufacturing or oil for transportation — accounts for a hefty share of the cost of nearly every product.

[…]

New York Post

While I don’t see a pathway to cutting energy costs in half, relative to where they are today, ditching the Paris Accord and net-zero mandates will undoubtedly lead to much lower energy costs than the current trajectory. Making energy more abundant and affordable will lead to greater prosperity, which will make more funding available for real science.

To the “scientists” fretting about Trump and his allies:

“You ain’t seen nothing yet!”

Watching the Starship booster rocket land on the launch pad was like all of my favorite 196’s space movies and TV shows become a reality.

The fact that Elon’s Starship looks just like Fireball XL5 makes this even more priceless!

Trump & Musk: Ad Astra!

Mars quest: President Trump and Elon Musk’s grand vision 

by Greg Autry and Brett Mecum, opinion contributors – 09/28/24

In September of 1962, John F. Kennedy famously told Americans, “We choose to go to the Moon.” Former President Donald Trump recently echoed this sentiment with “Elon, get those rocket ships going because we want to reach Mars.” 

Trump has often talked about reaching Mars. We find his new challenge to be a continuation of the fruitful space initiatives of his first administration, complementary to the bold return to the moon under Artemis. 

[…]

There would be two launch windows for an efficient Mars mission during a second Trump administration — in 2026 and 2028. The remaining requirements are technical and political.

[…]

When SpaceX first launched a Falcon 9 rocket in 2010, America held a big, fat zero percent of the global commercial launch market today. Today, most payloads are launched by SpaceX, which now flies more rockets than the entire planet did in 2010.

In 2010 there were about 1,000 active satellites in orbit. Today, Musk’s Starlink constellation operates more than six times that number, more than the rest of the commercial, military and governmental world combined.  

Trump’s space record is equally intimidating. No president has had a greater overall impact on U.S. space policy. Trump reestablished the National Space Council. He created the Space Force. He initiated NASA’s return to the moon under Artemis. 

[…]

We have no doubt that Starships will be standing on Mars by 2029 if the government doesn’t get in Musk’s way. After several test flights, Starship is looking capable, and landing one on Mars is easier in some ways than the moon mission that NASA has contracted it for. 

[…]

To achieve that, the second Trump administration must immediately streamline and simplify launch permit and license requirements. Musk has noted that launching each Starship requires “multiple fish licenses,” on top of FAA safety reviews. Requiring each launch to clear several hurdles is a waste of time we cannot afford in a globally competitive market.

[…]

America has always been at its best facing a crisis or a challenge. When we have the will, we have always found bold leaders able to answer the clarion call. Trump and Musk are ready to go: Are we? 

Greg Autry served as White House liaison to NASA in the Trump administration and is the co-author of “Red Moon Rising: How America Will Beat China on the Final Frontier.”  Brett Mecum serves on the Arizona Space Commission.

The Hill

Returning to the Moon and a manned mission to Mars… I can’t think of a better way to make science great again! So… Let’s…

Make Space Great Again!

Featured Image Source

Instagram Real Michael Solakiewicz https://ift.tt/ShJ8UF1

Reference

Tollefson, Jeff. ‘We need to be ready for a new world’: scientists globally react to Trump election win. Nature. Springer Nature. Nov 6, 2024

via Watts Up With That?

https://ift.tt/NTEUJnh

November 7, 2024 at 12:08PM

Malham Tarn DCNN 4017 – Gone for all the wrong reasons.

54.0999 -2.16381 Met Office Assessed CIMO Class 4 Installed 1/1/1949 closed sometime recently

Malham Tarn is probably the epitome of North Yorkshire – one of God’s own country’s finest points. The weather station was established, like very many others, to record weather conditions for transport and communications purposes in relatively extreme locations. The roads around Malham are notoriously treacherous at times of the year – but that doesn’t seem to deter the local motor cyclists who “enjoy” the odd burn up around there!

I started reviewing this site only to discover that it was recently closed for quoted reasons that seemed unusual if not improbable

Malham Tarn is a glacial lake at 381 metres amsl. Whilst it is reasonable to say its unique status means the weather station can only be representative of its own distinct locality that certainly does not make the site’s data worthless. The temperature readings ceased on 12/8/2022 but it appears that rain gauge readings have continued. The Field Studies Council managed the weather station whilst the overall site is owned by the National Trust. The FSC felt their operation there was no longer financially viable given the protection constraints on the site imposed by National Trust.

“Changes in customer needs and at the location itself made the centre no longer viable for our charity. The understandable need to protect such a rare environment meant that access to the Tarn became increasingly restricted, disappointing some of our learners. Options to grow and develop our business were likewise restricted. Unreliable water supplies and sometimes no water at all meant that visitors had to relocate at short notice.  In 2022 we closed to visitors.”

Somewhat odd to quote a lack of water supply by a glacial lake but there must be reasons. The weather station effectively closed down when the FSC vacated the site.

This is the view of the beautiful weather station setting from the FSC Facebook page.

It seems somewhat odd for the Met Office to have accepted closure of the manually reporting site rather than automating this site which has a 75 year continuous history. This is especially curious given the “Climate Change” effects that the National Trust claimed for this immediate area.

Those highly qualified “experts” at the National Trust claimed

“AN 18th century barn at Malham Tarn is a casualty of climate change and has collapsed as a result of soil shrinkage, the National Trust has said.

The Trust has created a mapping tool to outline the threats and ‘worst case’ climate impacts on heritage and landscapes across the country by drawing up a “game changer” climate change map plotting areas where they may be possible threats.”

So it didn’t collapse due to being 300 years old and quite possibly improperly maintained by its custodians the National Trust?

Perhaps these “experts” at the National Trust should restrict themselves to preserving the fabric of the buildings entrusted to them instead of making such ill informed pronouncements (bordering on propaganda) regarding issues they clearly have no understanding of. And just perhaps they could have taken on the continuation of the weather station within their own estate if they were so concerned about “Climate Change” and its effects. Or are they not concerned with real world data?

via Tallbloke’s Talkshop

https://ift.tt/Qp3bXol

November 7, 2024 at 11:18AM

York Minster Sell Its Soul For Solar Panels

By Paul Homewood


h/t Martin Brumby


We are used to the BBC lying, but I would imagine it would be a serious offence for a churchman:


 image

Two people in hi-vis jackets and white helmets carrying a solar panel onto the slate roof of York Minster

image

https://www.bbc.co.uk/news/articles/cy8np3dj7jdo


So what is all this extreme rainfall “officials” are rambling on about?

The longest series of rainfall data in NE England is at Durham, and daily rainfall patently is not getting worse there.

And the same applies to monthly rainfall. In fact the last time Durham had more than 150mm of rain in a month was in 2010:


 time series


https://climexp.knmi.nl/gdcnprcp.cgi?id=someone@somewhere&WMO=UKE00156852&STATION=DURHAM&extraargs=

image

https://www.metoffice.gov.uk/pub/data/weather/uk/climate/stationdata/durhamdata.txt


So, what about all of this “decay and movement” the BBC is rattling on about.

According to York Minster, they have a 100-year rolling programme of conservation work, needing £2.5m a year:


image

image

https://yorkminster.org/discover/conservation/


Current priorities include the St Cuthbert window, irreplaceable glass and refurbishment of the Grand Organ.

There is also ongoing work in the South Quire Aisle:

image

image

image


This work is addressing six centuries of exposure to the elements, not a couple of decades of global warming, as the BBC would like you to think.

These sort of problems are not new.

As reader Martin Brumby recalls, there was a major refurbishment project in 1965. He tells me he visited the works and still has the booklet about the work, which he has sent me.


image

image


£2 million was a lot of money in those days, and was obviously a real threat.


The BBC article goes on to glowingly report the installation of solar panels on the Minster roof.

I suspect that this silly scare story has been propagated as a puff piece for renewables, and not a serious technical assessment.

No doubt it will rake in some more funding!

via NOT A LOT OF PEOPLE KNOW THAT

https://ift.tt/1D4db52

November 7, 2024 at 10:56AM