Llysdinam DCNN 8304 – A Century of Dubious Data.

52.21571 -3.45166 Met Office Assessed CIMO Class 5 Installed 1/1/1882

The UK press seems preoccupied with filling its pages with any nonsense it can – it seems the Met Office is always willing to provide them with silly enough material.

So what is the reality behind this nonsense?

Firstly this is the “Daily Extremes” that the Met office publishes with LLysdinam as its star performer.

Tim Channon reviewed this site back in 2012 and described it quite bluntly “This site is extraordinarily poor for an AWS” {automatic weather station} He correctly judged it as a Class 5 site (inaccuracy by siting up to 5°C) as the Met Office subsequently assessed. Realistically it should also be judged as suffering from significant shading effects. At the time Tim could not get any close up imagery or further site details, however, that has now changed.

Firstly just to establish the level of hubris displayed by the Met Office, this is what they say about some of their long term sites

“In the UK, the Met Office has a long tradition and expertise in collecting accurate observations to monitor climate and weather.

We manage an extensive network of surface observing stations. Six of these sites, Eskdalemuir, Rothamsted, Balmoral, Armagh, Morpeth (Cockle Park), and Llysdinam, have now been awarded Centennial Station status by the World Meteorological Organization (WMO), recognising their global importance for collecting long records of accurate observations and for providing a unique history of recent climate.”

With the benefit of closer inspection below, I shall be as equally blunt as Tim was – this site is unfit for purpose of climate data reporting. The Met office claim of “collecting long records of accurate observations and for providing a unique history of recent climate.” ….. from a walled garden intentionally designed to elevate temperatures and create an artificial micro climate is patently untrue. The Met Office fully understands the effects of walled gardens on elevating temperatures – draw your own inferences from that.

This video has extensive views of the screen.

A typical screen grab shows this.

This begs the questions – if I install a regulation Stevenson Screen with accurate calibrated instrumentation in my walled back garden would the Met Office accept my figures? Are Met Office records now just a competition between walled gardens vying for the hot spot of the day? Whatever happened to integrity of data……and plain honesty?

Contributor “Oldbrew” recently drew attention to the Royal Meteorological Society’s guidance for home private weather stations. https://www.rmets.org/sites/default/files/2019-02/aws-guide.pdf It states

“Ideally, the screen should be fixed in an open place with good airflow on a level surface above short grass at the standard height. It should be no nearer than 30 metres (100 feet) from extensive concrete, aggregate or a road surface. Measure the height of surrounding objects above screen level: the distance from the screen to these objects should be at least two times these heights.
These are the ideals but what of the amateur siting his equipment in a suburban garden? There may be trees in the garden and if it is possible to move the screen far enough away from them it approaches too closely to the walls of the house, garden fence or hedging, or even off the lawn and into the herbaceous border………”

Clearly the Met Office has long ceased to be a credible data collecting organisation not even meeting standards advised for amateurs and Llysdinam proves the point.

via Tallbloke’s Talkshop

https://ift.tt/NYmKdnP

November 5, 2024 at 10:19AM

“Glaciers, Icebergs Melt As World Gets Warmer”

According to the IPCC and Michael Mann, glaciers which formed during the Little Ice Age were disappearing during the coldest period of the last millennium.

“glaciers in nearly all parts of the world receded regularly during the last sixty years but especially rapidly during the 1930-40 decade.”

All glaciers examined from Greenland through Scandinavia to Europe are shrinking. And the shrinkage is not limited to high latitudes. Some glaciers in the European Alps have vanished completely. In East Africa, the glaciers on three high volcanoes—Kilimanjaro, Mt. Kenya and Ruwenzori—have been diminishing since they were first observed in 1880. The vast Muir Glacier in Alaska’s Glacier Bay has retreated a full 14 miles since 1902.”

Sydney Morning Herald    Saturday 29 September 1951

29 Sep 1951 – “HERALD” SATURDAY MAGAZINE Glaciers, Icebergs Meit As World Gets Warmer – Trove

Climate Change 2001: The Scientific Basis

About Tony Heller

Just having fun

This entry was posted in Uncategorized. Bookmark the permalink.

via Real Climate Science

https://ift.tt/5Ms6pKr

November 5, 2024 at 09:58AM

Urban Legends of Climate Change: Palm Springs, California

This is the first of what will likely be a series of posts regarding urban heat island (UHI) effects in daily record high temperatures. My previous UHI work has been using the GHCN monthly average station data of “Tavg” (the average of the daily maximum [Tmax] and minimum [Tmin] temperatures). So, I’m moving from Tavg to Tmax (since record high temperatures are of so much interest), and daily rather than monthly values (although I will also sometimes include monthly results to provide context).

This post is mostly a teaser. Toward the end I will describe a new dimension to our UHI work I’m just starting.

The 2024 Poster Child for U.S. Warming: Palm Springs, CA

I was guided by a Google search on U.S. record high temperatures for 2024, and it seems Palm Springs, California was the place to start.

With a name like “Palm Springs” this place sounds like a wonderful spot to lounge under palm trees and enjoy the cool, refreshing spring water that surrounds you. Instead, the location is largely a desert, with the original downtown spring spitting out 26 gallons a minute of hot water. The “palms” do exist… they are “desert palms”, naturally growing in clusters where groundwater from mountain snowmelt seeps up through fissures connected to the San Andreas fault.

Like all U.S. metropolitan areas, the population growth at Palm Springs in the last 100+ years has been rapid. Even in the last 50 years the population has nearly doubled. Natural desert surfaces have been replaced with pavement and rooftops, which reach higher temperatures than the original desert soil, and the “impervious” nature of artificial surfaces (little air content) means the heat is conducted downward, leading to long-term storage of excess heat energy and, on average, higher temperatures. More on “impervious” surfaces later….

The Palm Springs Airport Weather Observation Site

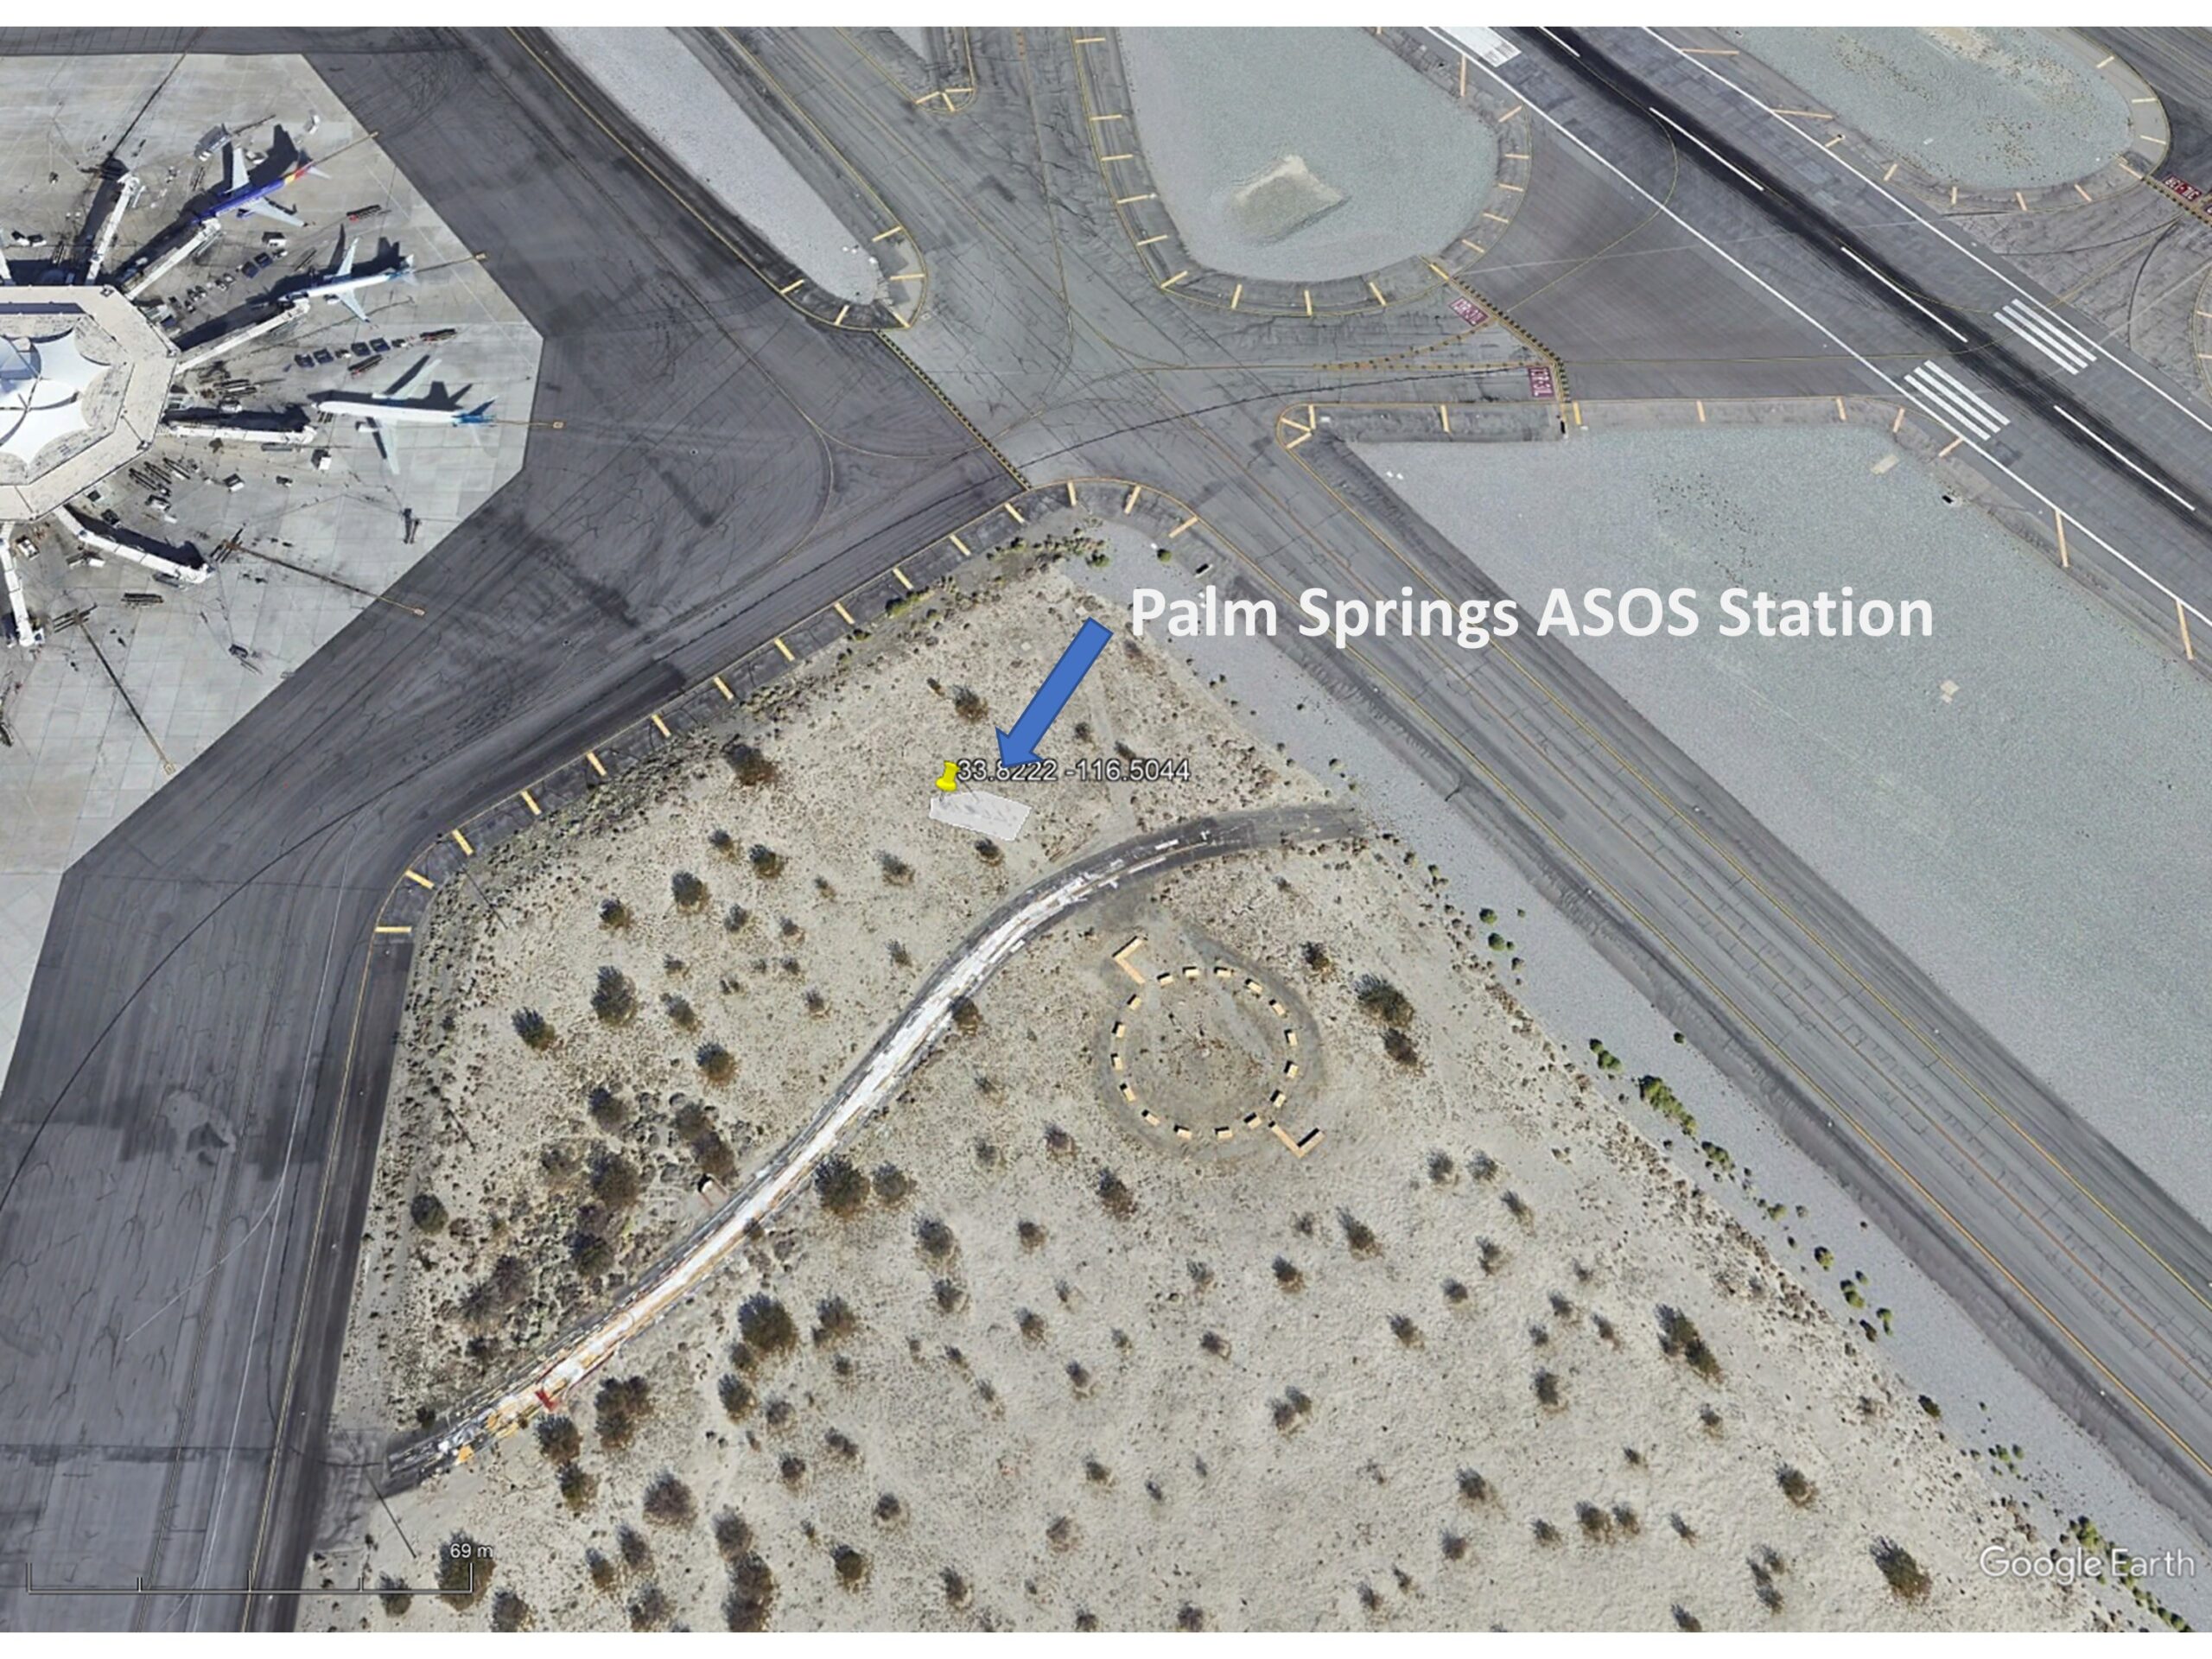
The following Google Earth image shows the current location of the official ASOS (Automated Surface Observing Station) site at the Palm Springs Airport, which recorded an all-time record high temperature of 124 deg. F on July 5 of this year.

What is somewhat amusing is that ASOS meteorological instrument siting guidance favors natural surfaces for placement, but since most of these weather stations are at airports (and since they primarily support aviation weather needs, not climate monitoring needs), the “natural” location is usually right next to runways, aircraft, and paved roads.

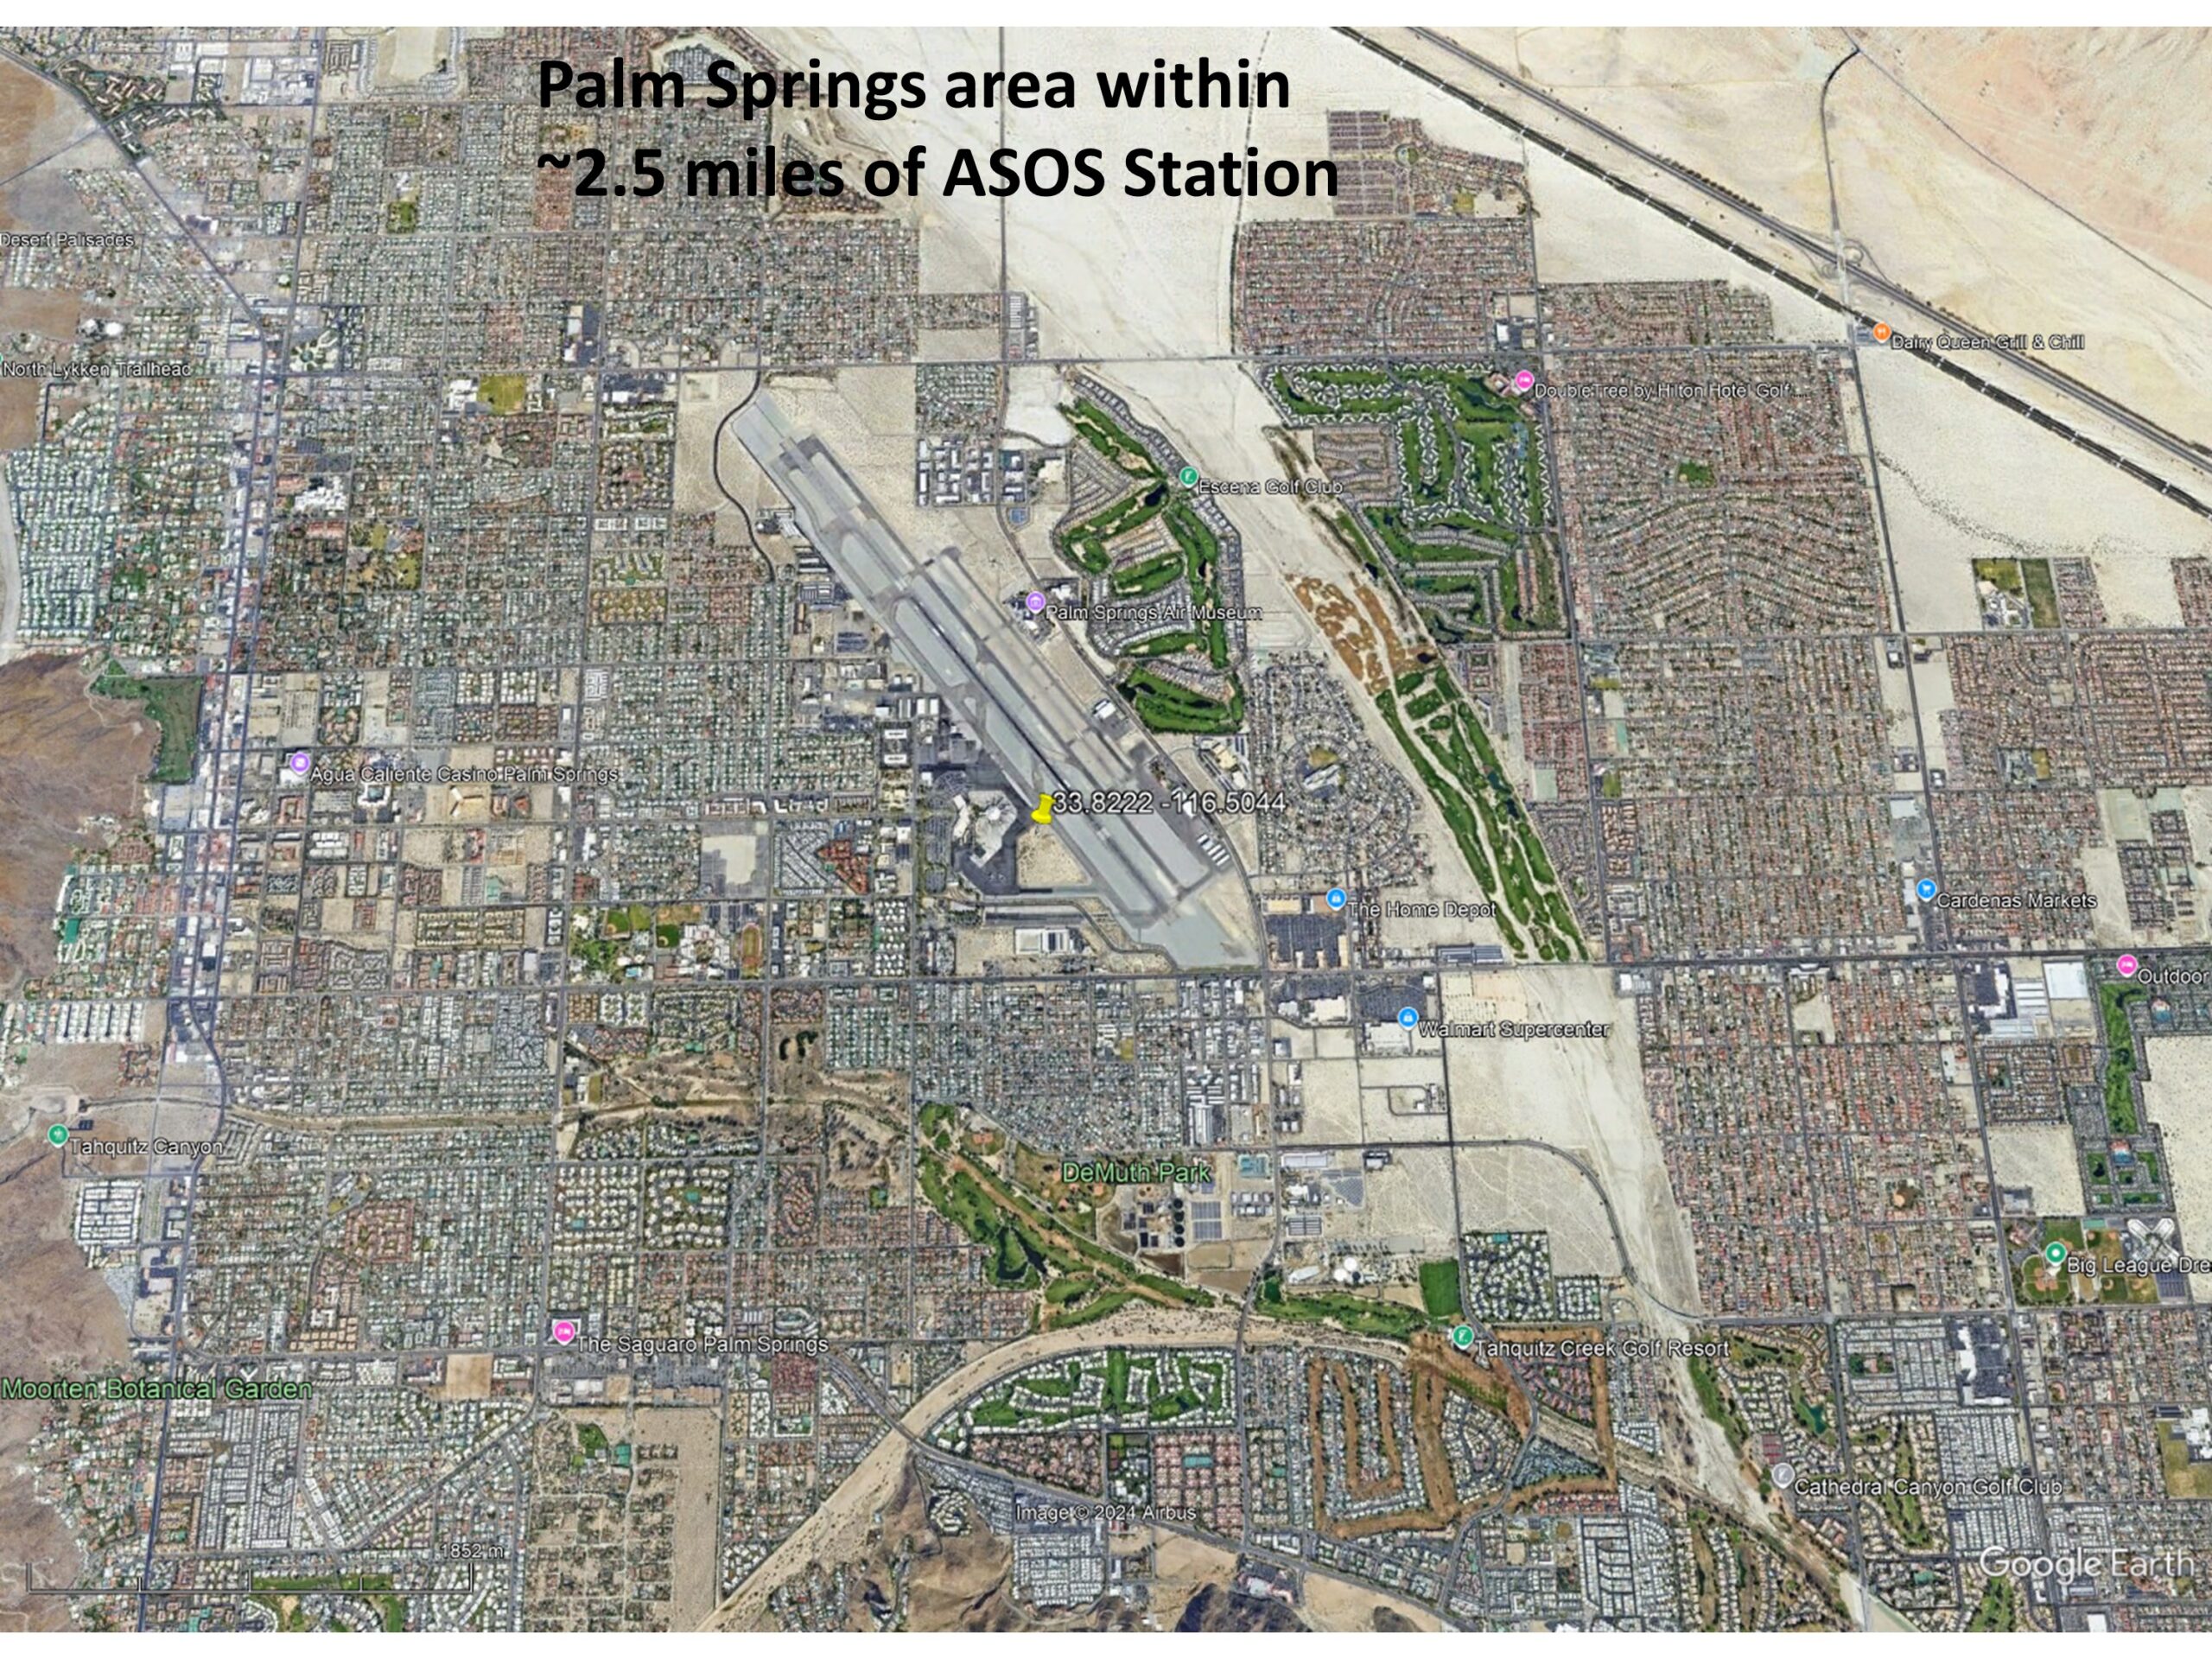
The next Google Earth image is zoomed out to show the greater Palm Springs area, with the ASOS site in the center.

Record July Temperatures and Urbanization

It only makes sense that people want to know the temperature where they live, and most of the U.S. population resides in urban or suburban locations. Yet, the temperatures they experience are, probably without exception, higher than before people moved there and started building roads, buildings, and airports.

But what is misleading for those following the global warming narrative is that record high temperatures reported at these locations almost always mention climate change as a cause, yet they have no way of knowing how much urbanization has contributed to those record high temperatures. (Remember, even without global warming, high temperature records will continue to be broken as urbanization increases).

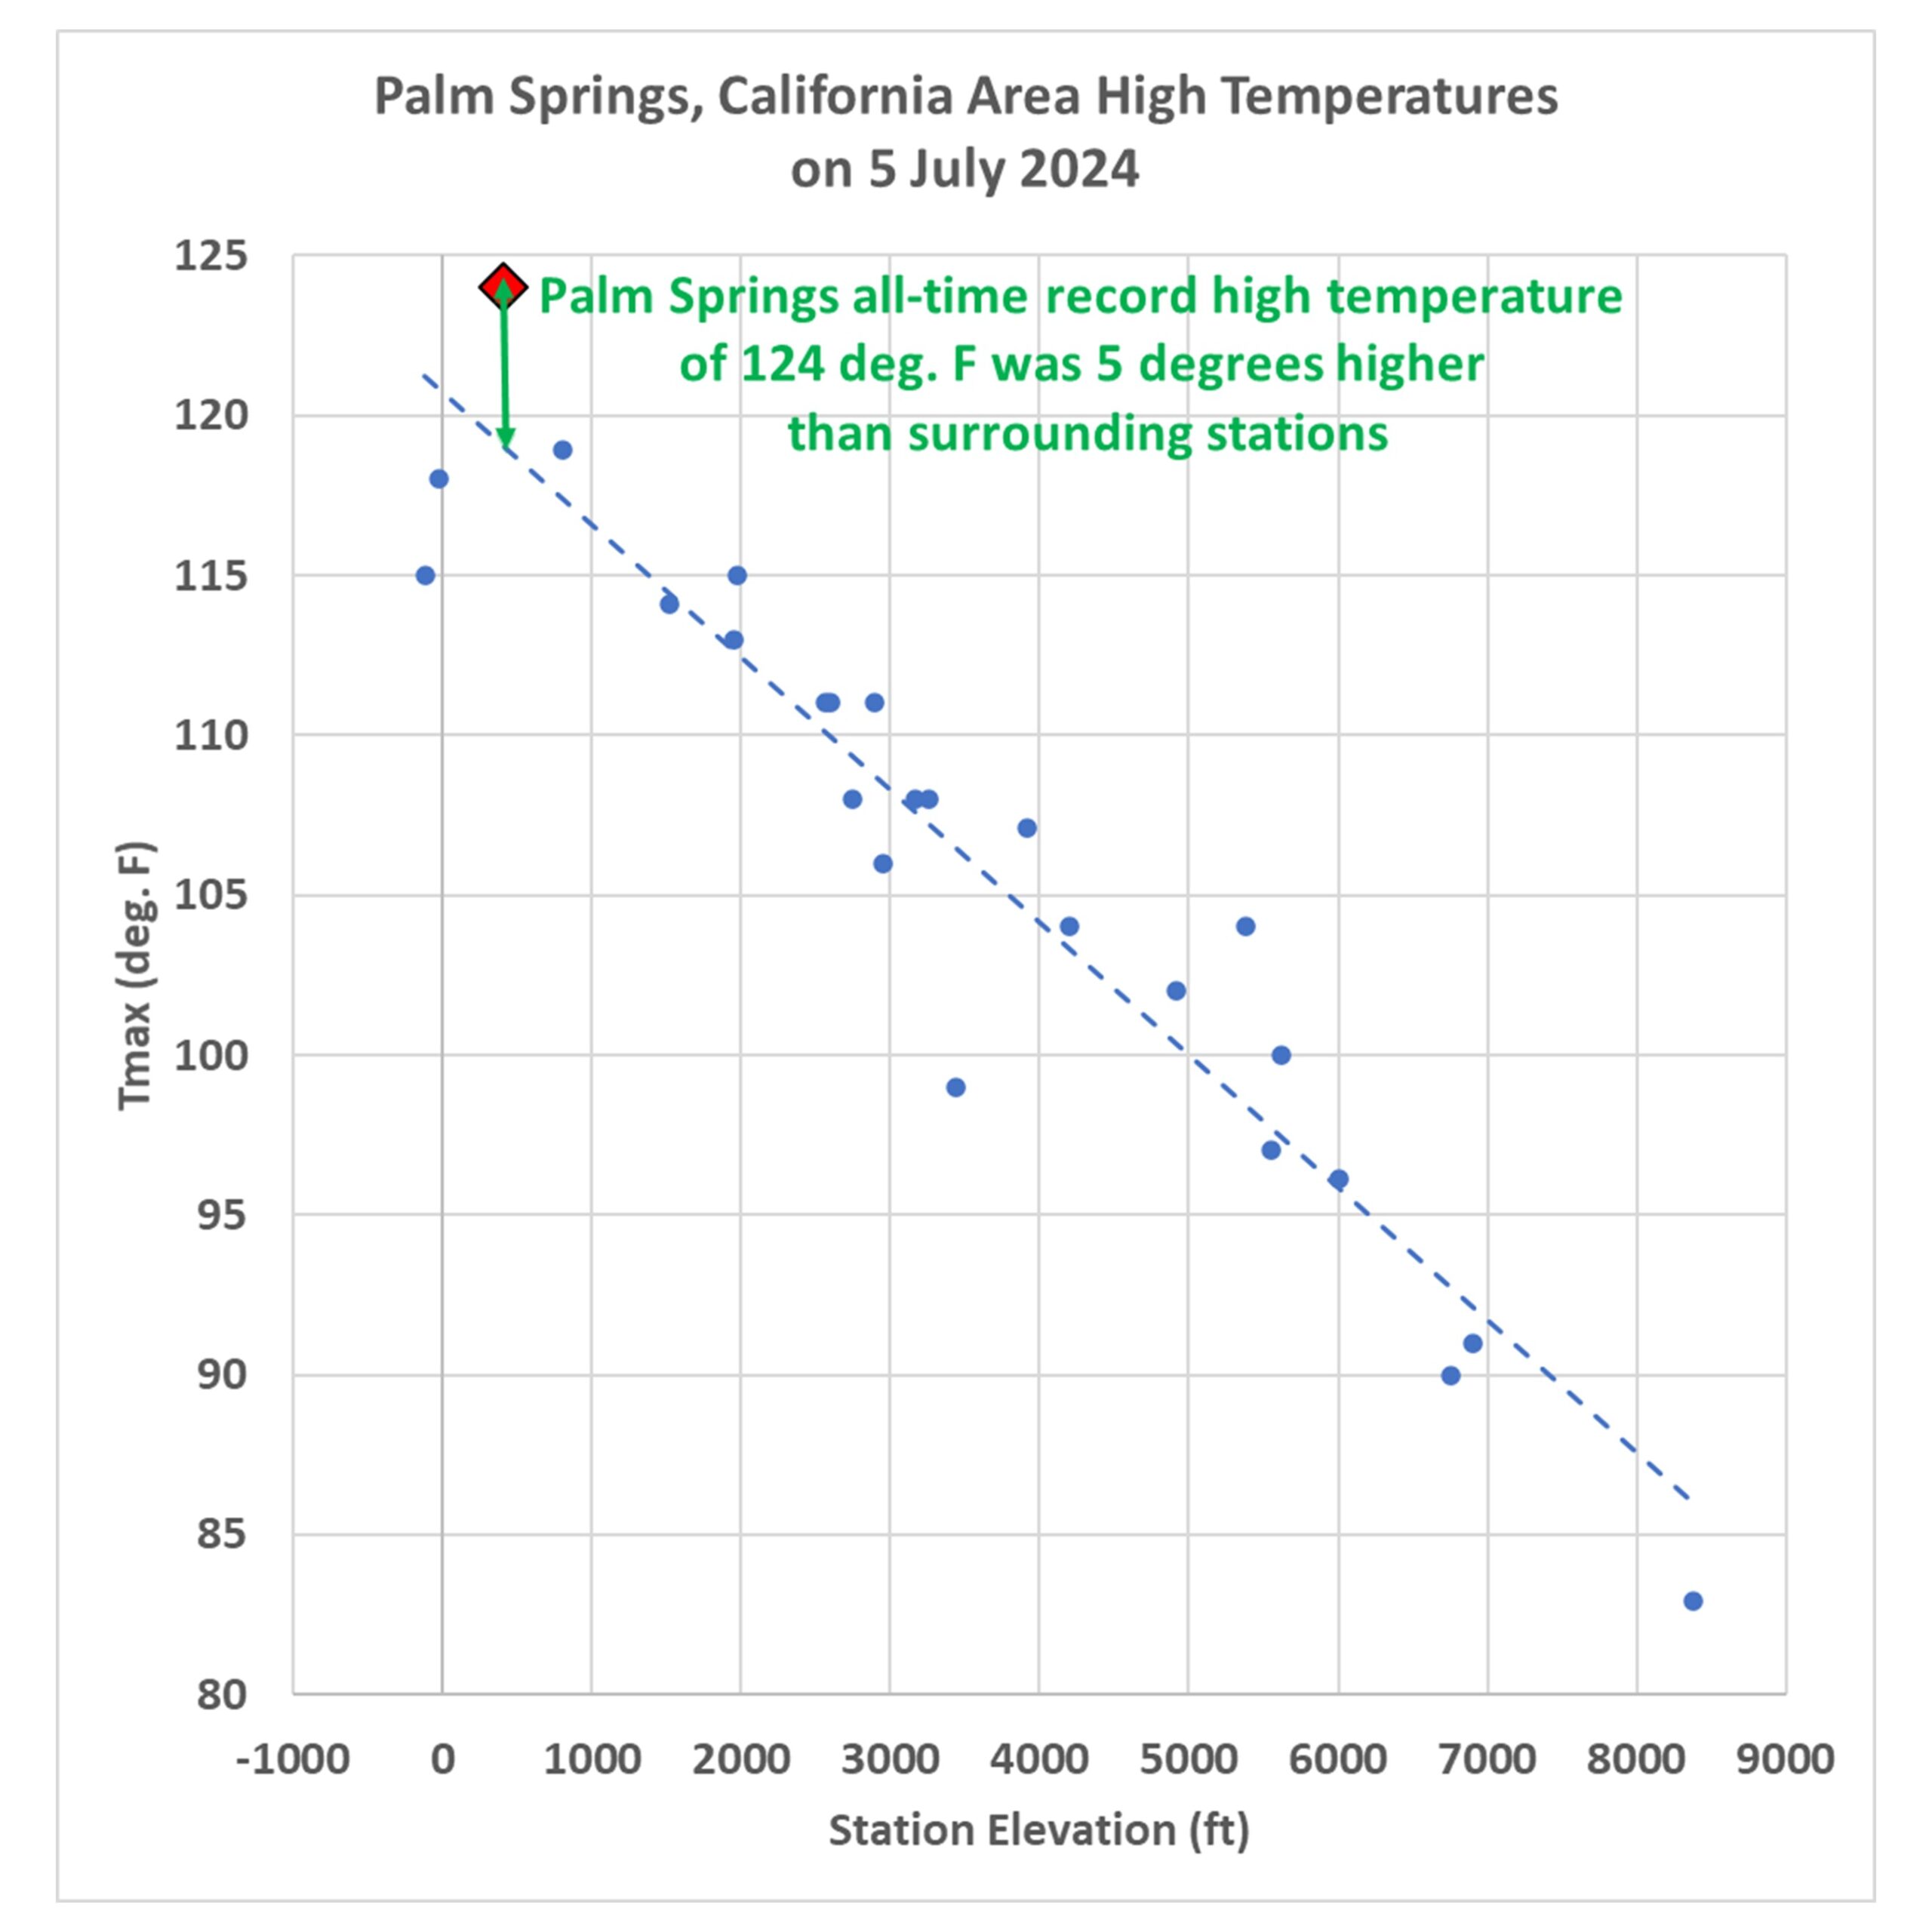
As mentioned above, on July 5, 2024 Palm Springs broke its all-time high temperature record, reaching 124 deg. F. There are 26 other daily GHCN stations within 40 miles of Palm Springs, all with varying levels of urbanization, but even more importantly, at very different elevations. If we plot the high temperatures reported for July 5 at those stations as a function of station elevation, we see that Palm Springs is an “outlier”, 5 degrees warmer than would be expected based upon its elevation-corrected expected temperature (the dashed regression line):

Now, keep in mind that many (if not most) of those 26 surrounding stations have their own levels of urbanization, making them hotter than they would be in the absence of pavement and roofs. So, that 5 deg. F excess is likely an underestimate of how much urban warming contributed to the Palm Springs record high temperature. Palm Springs was incorporated in 1938, and most population growth there has been since World War II.

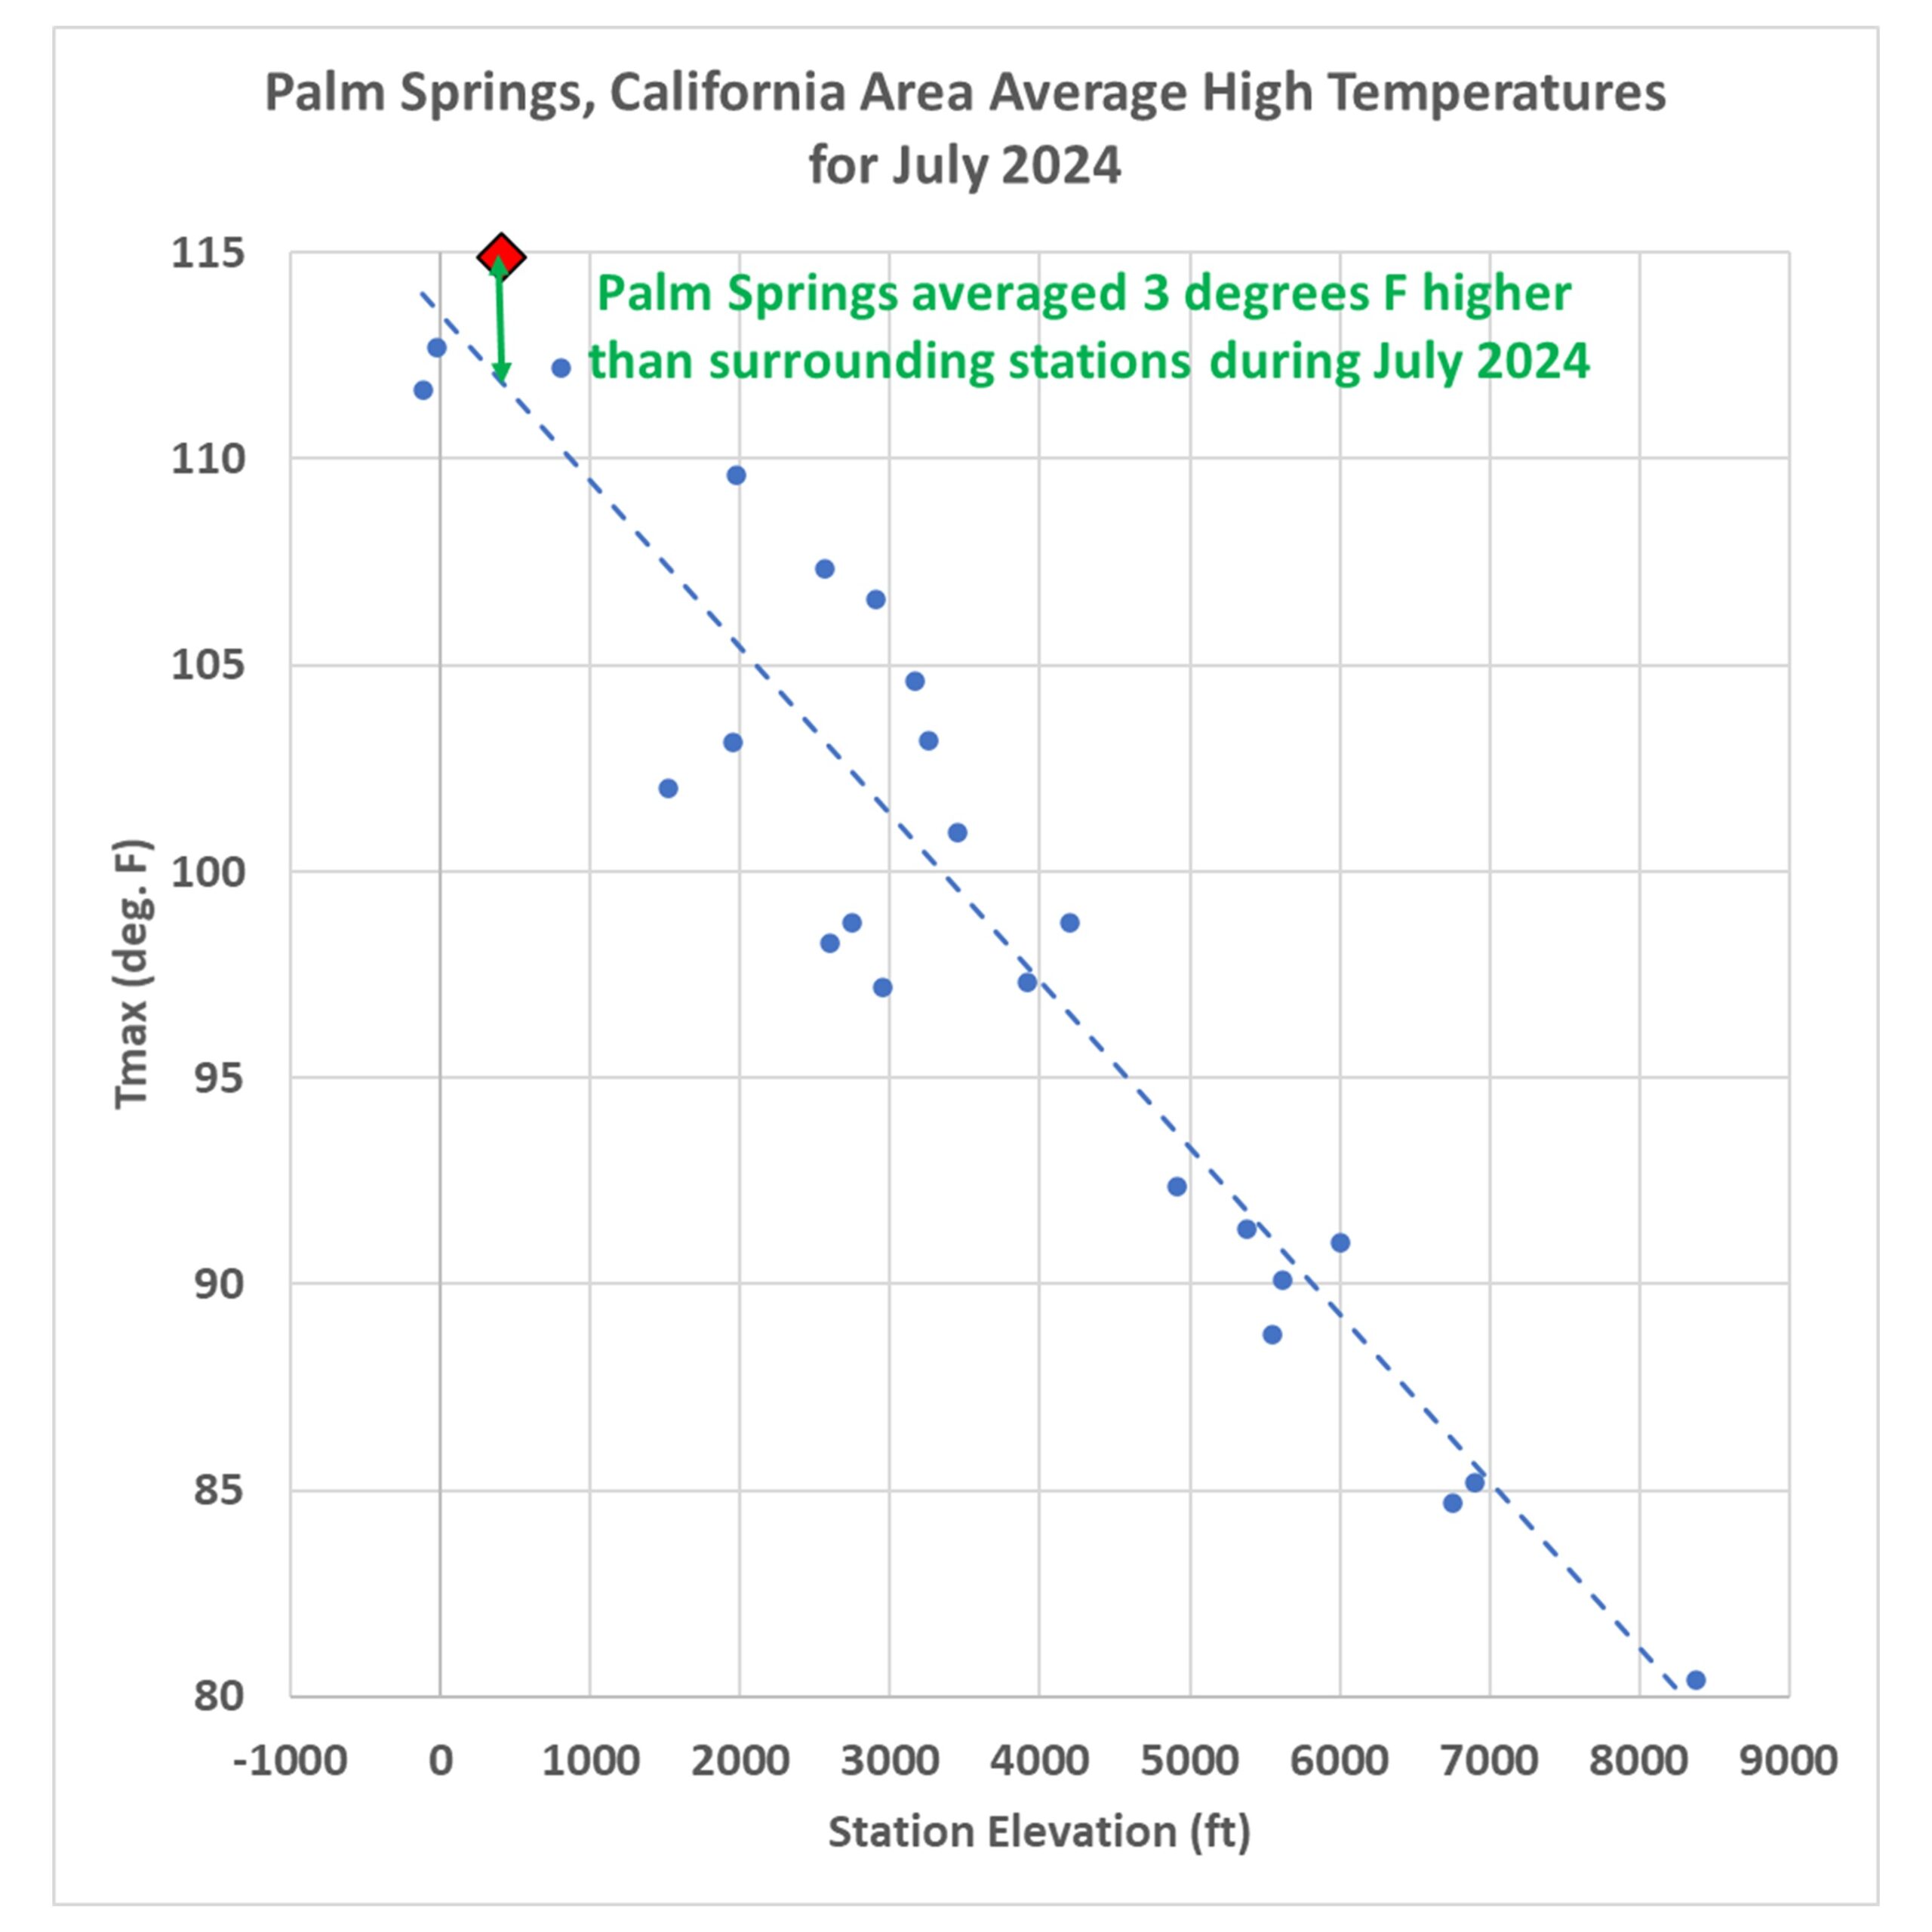
If you are curious how the previous plot looks for the average of all July temperatures, here it is:

For the month of July, Palm Springs averaged 3 deg. F warmer than the surrounding stations (after adjusting for elevation effects, and keeping in mind that most of the *other* stations likely have their own levels of urbanization).

Clearly, Palm Springs has had spurious warming influence from the airport and surrounding urbanization which did not exist 100 years ago. But how much?

Impervious Surface Data as a Surrogate for Urbanization

This blog post is a prelude to a new project we’ve started where we will compare daily (as well and monthly) temperatures to a relatively new USGS dataset of yearly impervious surface coverage from 1985 to 2023, based upon Landsat data. I had previously experimented with a “Built Up” dataset based upon Landsat data, but it turns out that was just buildings. The “impervious surface” dataset is what I believe will have the greatest direct physical connection to what causes most UHI warming, roads, parking lots, roofs, etc. I think this will produce more accurate results (despite being only ~40 years in length) than my population density work (which is, we hope, close to being accepted for publication).

via Roy Spencer, PhD.

https://ift.tt/x84g5t9

November 5, 2024 at 09:16AM

Miliband Lies About NESO Report

By Paul Homewood   Ed Miliband has been caught out making two big fat lies:       https://ift.tt/b5lWPH1 “Clean Power” is not achievable when you need a full fleet of gas power stations in reserve, to use when the wind does not blow! . And electricity won’t be cheaper, even if you count Carbon… Continue reading Miliband Lies About NESO Report

via NOT A LOT OF PEOPLE KNOW THAT

https://ift.tt/avTBwn5

November 5, 2024 at 09:16AM