Greens Detest ‘Little Guys’ Who Get in Their Way

Rural and coastal little guys delay and block massive ‘green’ energy projects

Paul Driessen

Environmentalists insist they love “little guys.” At least in the abstract, until those folks get in the way, raise inconvenient questions, or try to block “renewable energy” projects intended to “save the planet” from “manmade climate cataclysms.”

Then the little folks learn the environmentalists are really working with (and for) Big Wind, Big Solar, Big Utilities, Big Finance, powerful politicians and crony bureaucrats – the Climate Industrial Complex. Stand in its way, and farm families, small rural communities and even Native American groups can face protracted, expensive battles. But they often emerge victorious.

Energy analyst and journalist Robert Bryce reports that these little guys have rejected or restricted 735 US wind and solar projects since 2015, including 58 solar and 35 wind proposals so far this year. Transmission line, grid-scale battery and other plans also face growing resistance.

Rural Americas don’t want these huge installations destroying traditional ways of life, hurting property values, raising electricity rates, wrecking vital croplands and habitats, ruining scenic vistas, killing birds, bats and other wildlife – and creating serious fire and toxic gas risks from lithium-ion electricity storage batteries.

They don’t want their countryside dotted with huge landfills, piled high with billions of tons of broken, storm-destroyed and obsolete solar panels, wind turbine blades and other renewables trash.

The number and scale of many proposed projects is daunting – and the Complex’s dream of “transitioning” the entire United States from fossil fuels to an all-electric energy, transportation and industrial system would require vastly more.

Before being scaled back in a failed effort to reduce local and state opposition, the Lava Ridge Wind Project would have installed 400 huge turbines on some 200,000 acres of federal land in Idaho. That’s 310 square miles; 5.5 times Washington, DC. Most of its output would go to California, which already imports nearly one-third of its electricity.

The Koshkonong solar project near Christiana, WI would cover 6,400 acres (10 sq mi) and put a 667-MWh battery storage system near a local elementary school.

The Biden-Harris plan for 30,000 megawatts of offshore wind energy translates into 2,500 12-megawatt turbines rising 850 feet above the waves. But all those turbines wouldn’t provide enough electricity (31,541 MW) to power New York State on a hot summer day, if the wind is blowing.

The state’s plan to spend $2 billion for 24,000 MWh of backup batteries for windless/sunless days would provide enough electricity to run the state for barely 45 minutes! Sufficient batteries would cost trillions.

Each offshore blade is 350 feet long and 140,000 pounds; 2,5000 turbines would mean almost 500 miles of blades weighing 1,050,000,000 pounds! Imagine cleanup and landfill costs after a major hurricane.

And yet a 2020 Princeton University report called for massively expanding US wind and solar capacity, to fight climate change and rebuild America.

However, as Mr. Bryce points out, those plans would require solar projects blanketing an area the size of Massachusetts, Rhode Island and Connecticut combined – plus wind installations sprawling across lands equal to Illinois, Indiana, Ohio, Kentucky and Tennessee!

That’s without factoring in wind and solar power needed to charge grid-scale backup batteries to store enough electricity to power America for even a day or week of windless, sunless days.

Other projects are equally enormous, expensive and fanciful.

Summit Carbon Solutions wants to build a pipeline to carry carbon dioxide from 57 ethanol plants in five states – and inject the CO2 into geologic formations beneath North Dakota. Summit can provide no guarantees that the pressurized gas will stay in the ground, and not erupt suddenly and violently, killing wildlife and people by rapidly replacing breathable air – as a natural CO2 reservoir did at Cameroon’s Lake Nyos in 1986.

The cumulative impacts of all these wind, solar, battery, transmission line and other projects would be incalculable – on lands, wildlife, families, budgets and human health.

Adding to the cost, construction and raw material requirements, home, neighborhood and regional grids would have to be expanded and upgraded to handle the ballooning electricity demands, and the surges and plummets associated with unpredictable, weather-dependent wind and solar power.  

All this is irrelevant to Climate Industrial Complex members, who want to virtue-signal and  extol the “pivotal role” they are playing in driving America’s “renewable energy transformation,” meeting arbitrary greenhouse gas emission reduction targets, and preventing “climate catastrophes.”

Property rights advocate Tom DeWeese says concerned citizens can fight back by asking tough questions about these policies and projects. For example:

* What benefits has our community gotten from the massive solar and wind farms we already have? From the taxpayer subsidies and rate hikes we already have to pay? What benefits will we receive from the huge new projects you are promoting now?

* Why are you trying to end local land use controls, use eminent domain to take our property, and destroy small local and minority businesses to build these enormous projects?

* How will ruining our wild and agricultural areas, killing wildlife and reducing our living standards reduce global greenhouse and “save the planet,” if China and India alone emit 38% of the world’s greenhouse gases (versus 11% by the USA) and are building new coal-fired generating plants every week?

Proud, principled, vocal resistance is essential, if citizens are to defend their jobs, lands, health, living standards and freedoms.

Paul Driessen is senior policy advisor for the Committee For A Constructive Tomorrow (www.CFACT.org) and author of books and articles on energy, environmental, climate and human rights issues.

This article originally appeared in the Washington Times online (10/22/24) and print (10/23/24) editions.

https://www.WashingtonTimes.com/news/2024/oct/22/environmentalists-detest-little-guys-who-get-in-th

via Watts Up With That?

https://ift.tt/CYTh5Sb

October 31, 2024 at 04:00PM

Seven years to go! Extremely bad science is the new normal for the climate

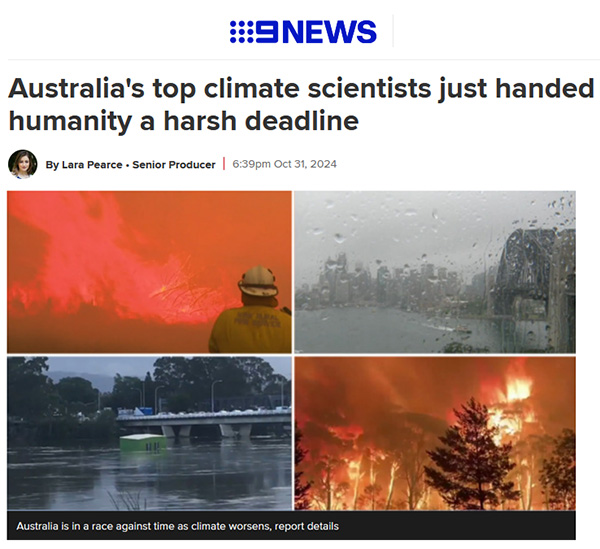
Australia's top climate scientists just handed humanity a harsh deadline. BOM-CSIRO Blob report 2024

By Jo Nova

Brave scientists at the CSIRO and BoM have dug hard through the sacred Arc of the Climate Covenant, CMIP-6,  to discover the horrible truth that we only have seven years (just seven!) until we pass through the sanctified Target-of-Paris on Halloween of 2031.

Channel Nine shares this “harsh deadline for humanity” and tells us the chance to limit global warming to the Paris Agreement goal of 1.5 degrees “will expire” then, like 2 for 1 sale coupon. They don’t quite explain what happens on November 1st, 2031 — but most people will assume it’s just like what happened after Prince Charles and Al Gore and the UN said we only had ten years to go (which was nothing).

But the horror show continues, not in our climate, but in our science: where the work of past scientists is deleted, and dubious datasets get adjusted with secret algorithms and thermometers near incinerators and over hot bitumen carparks that may be 1,000 kilometers away.  The CSIRO-BOM Blob have massaged Australia’s temperature record so it can fit their favourite climate model. Dishonestly, both institutions hide the heat of the Federation Drought, where places all across Australia recorded temperatures over 50 degrees in 1896. BoM and CSIRO delete the cooling trend their own experts recorded from 1900 to 1950 in Australia. (Deacon et al).

The fake rise in temperatures graphed by the BOM after adjustment.

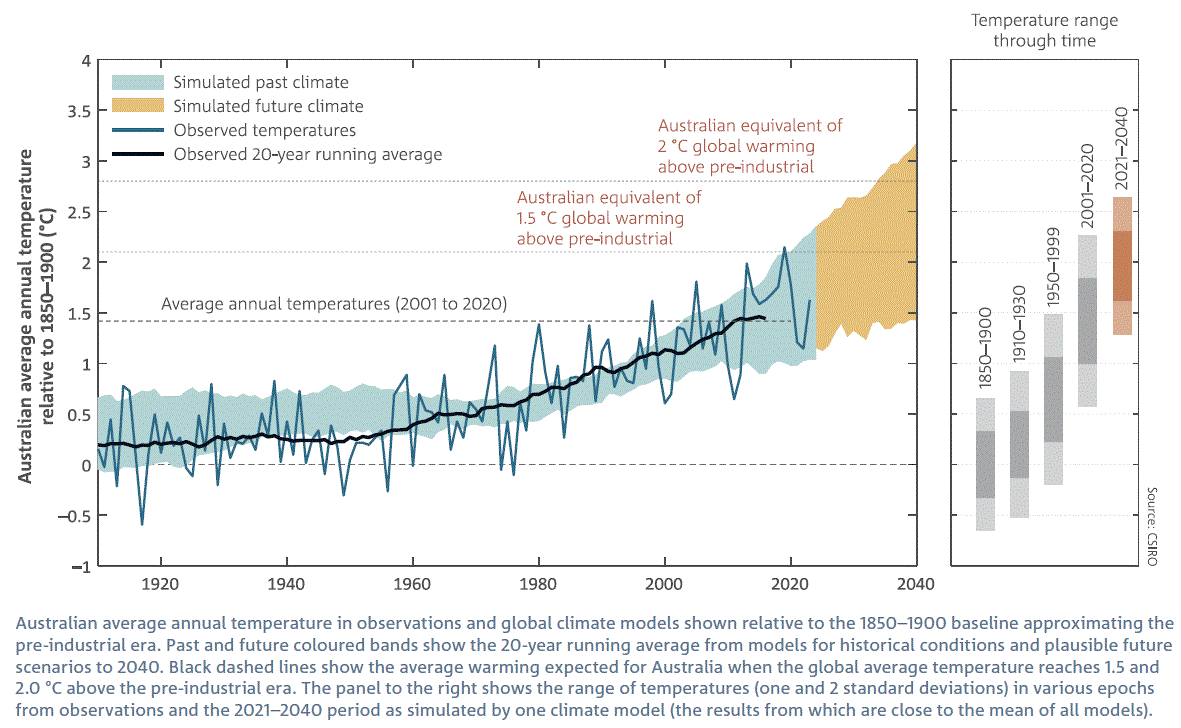
A carefully curated curve. BOM CSIRO State of the Climate 2024.


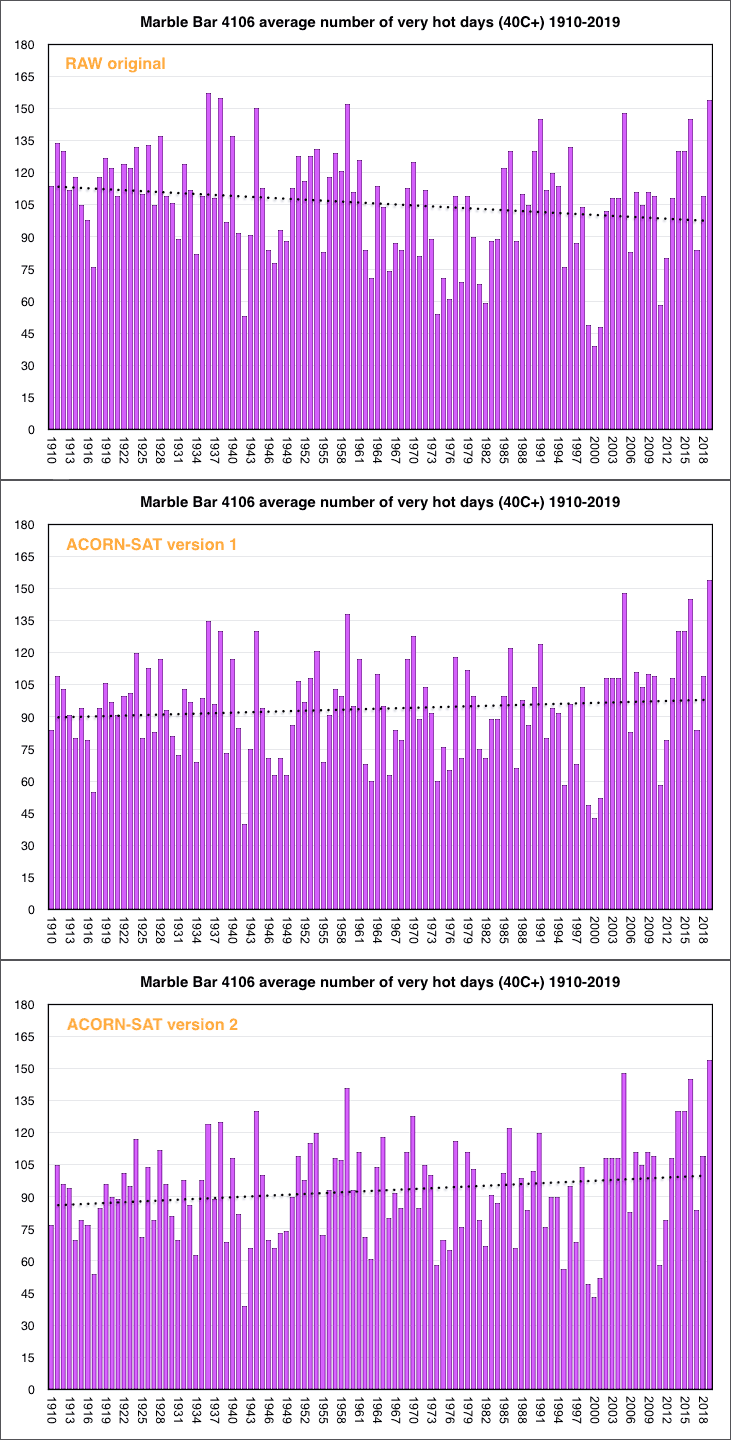
The BOM and CSIRO pretend the temperatures are accurate in the graph above. They don’t tell Australians that they keep adjusting the data, even a hundred years after it happened. Some poor towns didn’t know they were two degrees colder in World War I until the BoM “discovered” that in 2014. The people of Marble Bar thought they had the hottest heatwave in world history in 1923 until the BOM traveled back in time to delete it, I mean “correct it”. Temperatures in 1910 have fallen 22 degrees Fahrenheit in the last 10 years.

At the current rate of decline, the 1920 miners of Marble Bar will be in an ice age by the end of the century.

marble bar very hot day trends

The irony is that the BOM ignore the hot temperatures of the 1800’s because they were not in standardized modern Stevenson screens, yet the BOM is happy to take those lauded Stevenson screen measurements from 1920 and drop them in a high speed homogenization-blender to adjust them by as much as 2 degrees.

So the BOM can “adjust” the data to get any trend they want. Then there’s the added heat of a million tons of concrete and brick keeping our cities warm. And on top of that scientific hamburger, thermometers boxes shrank from 240 litres to 60 litres, and glass instruments became electronic ones. They don’t mention that their super accurate new gizmos can pick up brief changes in temperature that the old glass ones can’t. And possibly they can pick up the airport radars too.

Maximum record temperatures may be a one-second-record, literally there and gone in a moment, and if it was radar interference, not even there at all.

When asked, the BOM say they have calibrated and tested the thermometers side by side, to  but they won’t release the data. As if the thermometer readings at Canberra airport are a national security issue.

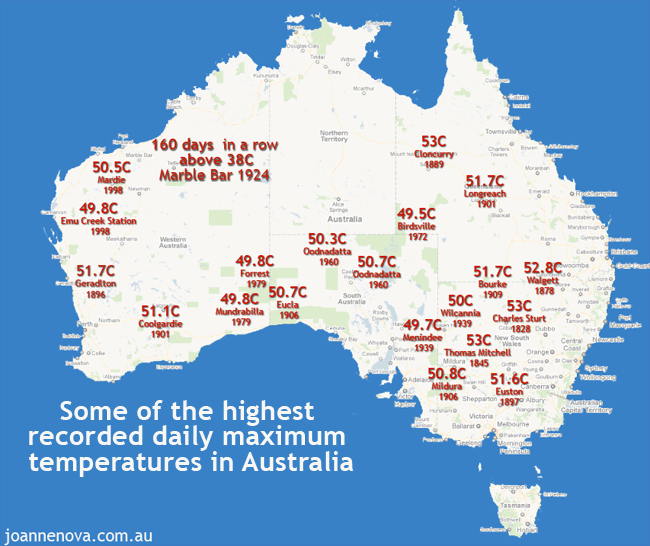
They also don’t mention that scientists in Australia were reporting that Australia was cooling from the 1890s to 1952. (Deacon et al) The ghastly heat of 1896, the Federation Drought, and the 50C record temperatures all over Australia all go down the memory hole.

Australian heatwaves, mapped, 50C temperatures, 1800, 1896. Historic heatwaves.

Historic heatwaves. 50 degree temperatures were everywhere, right across Australia in the 1800s and 1900s.|

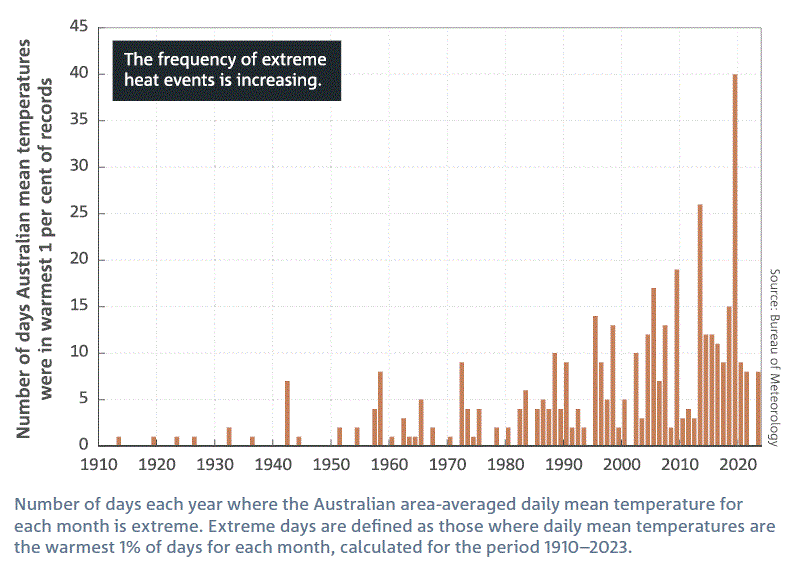
Not surprisingly, after we adjust all the records, we find extreme heat events are increasing

And this is the shocking graph the BOM-CSIRO blob gave us in 2024:

BOM CSIRO State of the Climate 2024.

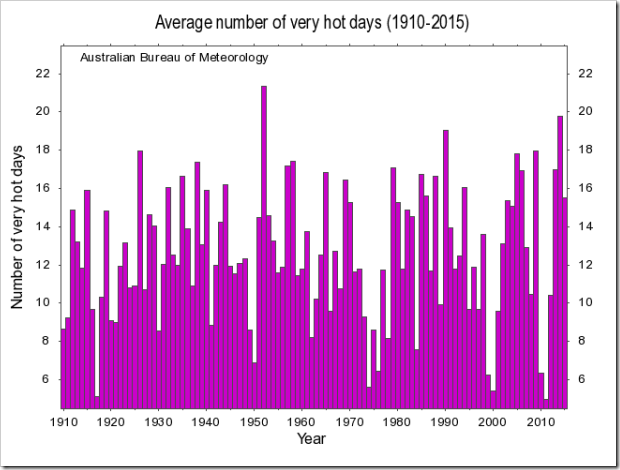
But ten years ago the BOM showed Australians a different graph, one which looked like this, til they took it off their own website. So there is bound to be some excuse. A different permutation or combination of variables, an older dataset, some plausible deniability.

But the fact remains, that the BOM-CSIRO-blob are not trying to give Australians the whole truth and nothing but the truth:

Number of very hot days in Australia up to 2016. BOM

Number of very hot days in Australia up to 2016.  It was on the BOM site…

Reading the tea-leaves on rain in Australia

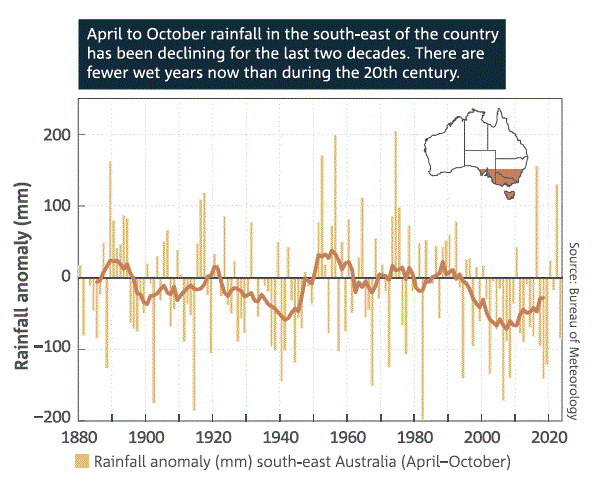
By selecting some contrived permutation the BOM-CSIRO-Blob can create the illusion that something unusual is happening. Here, they show the April to October rainfall in one particular part of the country as if this has some special meaning. (Their climate models fail on rainfall trends nearly universally).  The Blob can cherry pick permutations until they find something. But here, even the best trend they can get doesn’t resemble our CO2 emissions. Why was the winter rain almost as low in 1940? The BOM don’t know. They could make up some reason post hoc, but they can’t predict it.

Rainfall decline in SE Australia. BOM CSIRO

Rainfall decline in SE Australia. BOM CSIRO State of the Climate 2024.

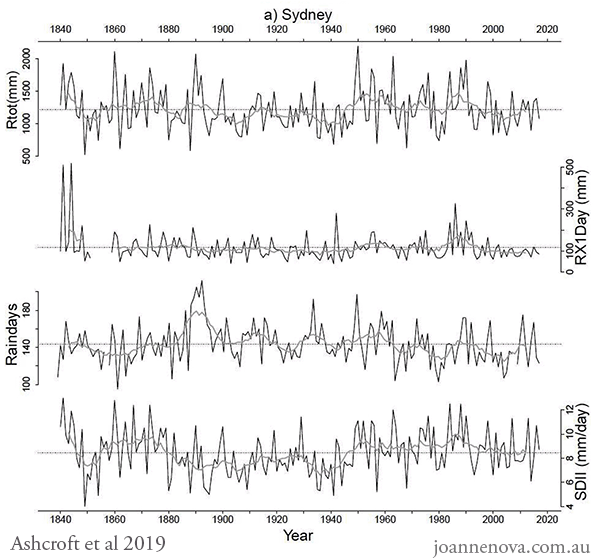
If the BOM-CSIRO-blob wanted, they could show Sydney-siders the total rainfall record for the last 130 years. But they can’t because it would be obvious to everyone that it has nothing to do with CO2. It could just be noise in the system, oceanic oscillation, or cycles controlled by the sun.

This was the total rainfall in Sydney from 1840 to 2019, and the total number of rainy days, the peak amount of rain that falls in a single day and the intensity of the downpours. Why isn’t it in the State of the Climate? Why haven’t the BOM updated this graph?  (From the Ashcroft paper of 2019).


Rainfall trends, cycles, Australia, Sydney, Graph, 2019, 1840 - 2020

Rainfall trends, cycles, Australia, Sydney, Graph, 2019, 1840 – 2020..| Abbreviations: Rainday counts (RD), monthly rainfall totals (Rtot), and highest daily rainfall (Rx1day). The Simple Daily Intensity Index (SDII): the amount of rainfall received divided by the number of raindays recorded over a month and year.

The exact same pattern is visible, by the way, in rainfall records from Melbourne and Adelaide too. But almost no one in Australia would know that. The ignorance isn’t an accident.

Thank the BOM. Thank the CSIRO. Thank the ABC.

REFERENCES

LindenAshcroftabDavid J.KarolyacAndrew J.Dowdyb(2019) Historical extreme rainfall events in southeastern Australia, Weather and Climate Extremes Available online 10 May 2019, 100210

Deacon, E.L. (1952) Climatic Change in Australia since 1880, Australian Journal of Physics, Volume 6, Pages 209-218.  [PDF]

State of the Climate 2022, Bureau of Meteorology

State of the Climate 2022, CSIRO

State of the Climate Report CSIRO 2014. CSIRO

Previous State of the Climate Reports, CSIRO

And even more droughts and trends graphs here.


0 out of 10 based on 0 rating

via JoNova

https://ift.tt/wBEqgT9

October 31, 2024 at 03:45PM

TV host slams ‘climate alarmism’ among Western media

By Paul Homewood


Chris Kenny slams climate alarmism:


via NOT A LOT OF PEOPLE KNOW THAT

https://ift.tt/JFS4LyH

October 31, 2024 at 02:33PM

Robust Beach Ridge Evidence Indicates Mid Holocene Sea Levels Were 1-5 Meters Higher Than Today

Three new studies use evidence from elevated beach ridges to assess sea levels were 3-5 m higher than today near Thailand, 1-1.5 m higher near Australia, 2-5 m higher along the North Sea just a few millennia ago.

The higher sea levels in the tropical regions (Australia, Gulf of Thailand) were “primarily driven by eustatic processes,” not a result of vertical land motions.

This means the Mid to Late Holocene highstands were mostly a consequence of the larger volume of water in ocean basins at that time relative to today, when there is more water locked up on land as ice.

Terry et al., 2024 (Gulf of Thailand)

“At an elevation of 3.3–5.3 m above modern sea level, the sequence is interpreted to represent a Holocene raised beach. The unlithified sediments comprise rounded quartz and mylonite pebbles and cobbles, oriented predominantly NE–SW, supported by fossiliferous sands that are rich in marine shells, coral fragments and occasional terrestrial gastropods. The juxtaposition of the marine and non-marine gastropoda of contemporaneous ages mC14 and OSL age-dating of shell material and mineral sands suggest the raised (storm) beach formed between 3.5 and 4.0 ka BP, i.e. ∼ 2.5–3.0 ka after the MHH peak, at a height of ∼ 1.3–3.3 m above the local RSL position at that time (according to glacial isostatic adjustment modelling). Given the otherwise paucity of data from the upper GoT, the Ko Khang Khao raised beach provides nakes a compelling story for a coastal storm deposit, thrown up either by a winter monsoon storm, or by a palaeotyphoon that managed to penetrate the upper Gulf. Overlapping results of ew information that expands our current understanding of geographical variations in RSL across Southeast Asia during the Late Holocene.”

 Image Source: Terry et al., 2024

Kennedy et al., 2024 (Australia)

“Holocene sea-level in Victoria is considered to be primarily driven by eustatic processes and is most likely similar to that of eastern Australia broadly (Bryant, 1992; Kennedy et al., 2020b; Lewis et al., 2013). A maximum elevation during the Holocene occurred at around +1.0–1.5 m 6000–6500 calibrated years ago (cal BP) has been suggested based on dating of raised notches (Cape Liptrap; Baker et al., 2001; Gardner et al., 2009) and estuarine sediments (Anglesea; Kennedy et al., 2021) in southern Victoria  … As the estuary closely tracked sea level during the mid-Holocene it can therefore be used to provide further indication on the spatial extent of the maximum sea level elevation recorded elsewhere in eastern Australia (Lewis et al., 2013) and on the other side of the Tasman Sea (Clement et al., 2016; Kennedy, 2008; Kennedy et al., 2022) during this period. Evidence for a mid-Holocene sea level highstand along the open coast of Victoria, southern Australia, has generally been scant. Fixed biological indicators at Cape Liptrap (165 km east-south-east) suggest a higher sea level of 1.5 m at around 5.5–5.0 ka (Gardner et al., 2009; Haworth et al., 2002), while at Anglesea elevated estuarine shells at +1.14 m date at 6704–6381 cal BP (Kennedy et al., 2021; Figure 9). As the average elevation of the infilled part of the estuary is +2.34 ± 0.51 m and composed of estuarine sediments this further suggests deposition during a period of higher sea level. Combined with the shallowest age (1 m from the surface, +1.021 m above MSL) within Aireys/Painkalac of 6930–6440 year cal BP being very similar to that of Anglesea provides further evidence that a period of higher sea level during the mid-Holocene occurs along the south east coast of Australia.”

Image Source: Kennedy et al., 2024

Freiesleben et al., 2024 (North Sea)

“The postglacial sea-level history in the Limfjord area is based on radiocarbon dating of terrestrial-to-marine transitions in sediment cores, and mollusc shells in raised marine deposits showing a rapid sea-level rise in the Early Holocene (Petersen 1979; Bennike et al. 2019; Jessen et al. 2019) followed by a Middle Holocene peak in sea level 2–5 m higher than present as documented by the raised beach ridges and Littorina shorelines (Mertz 1924).”

Image Source: Freiesleben et al., 2024

via NoTricksZone

https://ift.tt/UzBSVsx

October 31, 2024 at 02:19PM