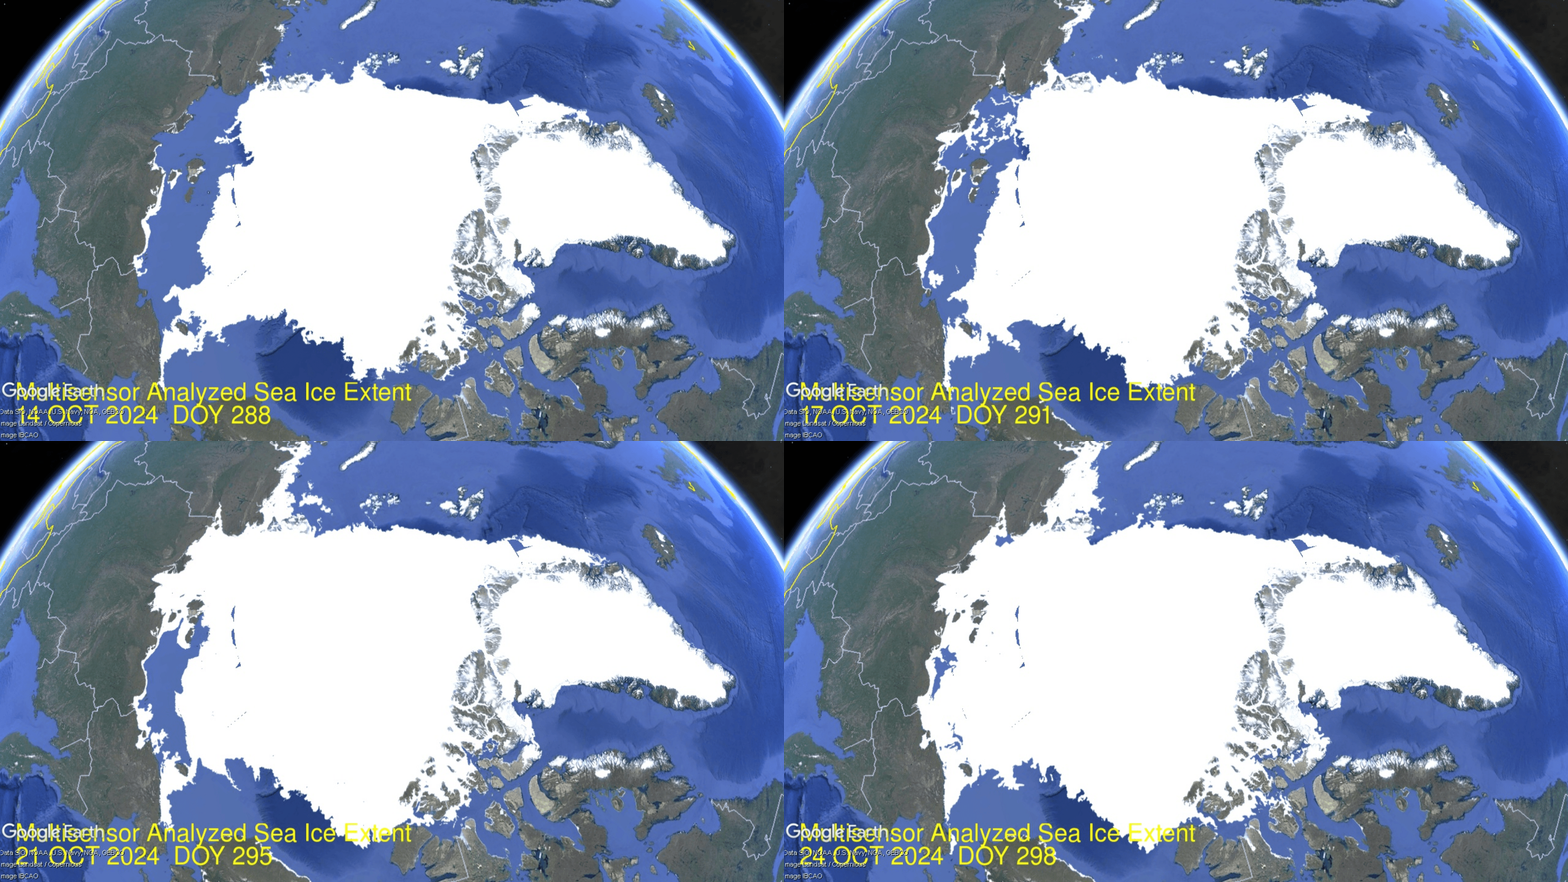
Arctic Shipping Update: NSR Freezes in 10 Days

The previous post below sounded the alarm about ice halting Arctic shipping early.  October 14, the two choke points are in place:  Chukchi (bottom left) blocking entrance to Bering sea, and Laptev (upper left) stopping traffic to European seas. By yesterday  Laptev and East Siberian seas are completely covered, each over 95% of last March max extents. Chukchi is at 50% with its coastline covered. Kara (top left) is also adding ice rapidly. Less obviously Canadian Archipelago (lower center) doubled in 10 days up to 300k km2.

Ice-strengthened supramax Kumpula (Arc 4) on the NSR being escorted by nuclear icebreaker Vaygach. (Source: Courtesy of ESL Shipping)

The report comes from Malte Humpert at gCaptain  Early Winter Ice Halts Arctic Shipping Traffic Weeks Ahead of Schedule.  Excerpts in italics with my bolds.

The summer shipping window on Russia’s Northern Sea Route is coming to a rapid close weeks ahead of schedule. A number of vessels and convoys are rushing to complete their transits before the route shuts down in the next three weeks.

Source: Northern Sea Route Information Office

Unlike the last couple of summers when Russia’s Arctic coastal waterways were fully clear of sea ice, residual winter ice persisted in the eastern section this year. This has resulted in the early onset of ice formation especially in the Laptev, East Siberian, and Chukchi Seas.

NSRIO: Ice is still present in the eastern sector of the NSR preventing free passage of ships without ice class. The nuclear icebreaker Sibir has been operating in the East Siberian and Chukchi Seas since the end of June together with the nuclear icebreaker Vaygach, which has been in the area since mid-July. In several areas of the Chukchi and East Siberian Seas heavy ice conditions are still observed, which directly affects the admission of low ice class vessels to these areas. The western part of the NSR is mostly ice-free. Above is a map of ice conditions as of August 7, 2024.

Russia’s Northern Sea Route Administration announced that vessels with no ice class will have to vacate the waterway by October 15, around 2-3 weeks ahead of schedule. For vessels with light and medium ice classifications the navigation season will end on October 20 and October 31 respectively.

The last permitted start of convoys heading east will be October 10, leaving just one more week for vessels to begin their Arctic transit.

This year’s early shutdown comes three years after narrowly avoiding a major incident three years ago. In October 2021 Russian authorities reacted too late to begin closing down the NSR as winter sea ice drifted into the main shipping channel and trapped two dozen vessels for more than a month. A 30 centimeter or one foot thick ice layer had formed by the end of October across hundreds of miles of Arctic Ocean.
 
Several icebreakers, including the powerful nuclear vessel Yamal, rushed to the scene from Murmansk over 3,000 nautical miles away to help free the stranded vessels. Over the course of more than 6 weeks several icebreakers worked to break the vessels free and escort them to safety out of the eastern section of the Northern Sea Route. The situation did not fully resolve until the end of December when the last vessels were freed.

Vessels stuck in thick winter sea ice in November 2021 awaiting rescue. (Source: Rosatomflot)

Currently a number of container ships, oil tankers, bulk carriers
and LNG tankers are passing through the route.

In the Far East two LNG carriers and two oil tankers, including the Suezmax tanker Sai Baba, are currently passing through the waters adjacent to the Bering Strait. They are staying clear of multi-year ice around Wrangel Island which has persisted and troubled shipping all summer. A nuclear icebreaker had remained on standby for much of the summer keeping the shipping lane open.

Select container ships, crude oil tankers, and bulk and LNG carriers currently on the NSR. (Source: Shipatlas)

Further west along the route, the first-ever conventional Panamax container ship in the Arctic is about halfway through its transit. The vessel had originally intended to also conduct its return voyage via the Arctic, but will now likely have to return to Asia via the Suez Canal or South Africa route.

A massive Capesize bulk carrier without any ice class, Dodo, is also rushing to complete its eastbound voyage to Caofeidian, China.


via Science Matters

https://ift.tt/hFYyPRA

October 25, 2024 at 10:20AM

Saturday

0 out of 10 based on 0 rating

via JoNova

https://ift.tt/CYW6gyt

October 25, 2024 at 09:36AM

Craibstone No 2 DCNN 1271- Compare and Contrast

57.17603 -2.25939 Met Office Assessed CIMO Class 4 Installed 9/9/2021

There has been a weather station at Craibstone continuously since 1921. It was formerly located at the agricultural Craibstone College which is now part of SRUC “Scotland’s Rural College” ( Colaiste Dhùthchail na h-Alba) at the Aberdeen Campus. Site development and the A90 road improvements required a re-location of the long running and well operated station. A lot of sensible thought went into this move. The current automatic site is now in “experimental” fields still operated by the College. Well away from the urban outskirts of Aberdeen the site now looks like this………

Street View imagery often foreshortens views. The line of trees to the north scales to 80 metres distant from the screen, the central swathe of grass is 20 metres wide and the screen is set back 100 metres from the minor road.

The 2008 image of the area (13 years prior to installation) is a good indicator of the agricultural trial fields (with deliberately separated crop segments) that the college manages.

There do not appear to be any shading problems, the area vegetation is variable but not atypical of the region and well separated from the screen. The only possible concern may be the apparent slight slope. The Met Office quote an elevation of 134 metres amsl. An examination of the area Ordnance survey sheet shows the 130 metre contour at the road 100 metres to the south with the 135 metre contours no nearer than 80 metres in any direction. The high point to the east at 168 Metres is over 400 metres away.

My personal view is that the Met Office assessment seems unduly harsh given there are unlikely to be any artificial influences on the site. This site could not make Class 1 but Class 2 is quite possible or at very worst Class 3. However comparing and contrasting Craibstone No 2 with another nearby Class 4 assessed site rather makes a mockery of whoever did the assessments. Is Craibstone really no better than this notorious Class 4 site just 2.7 miles away?

Should Craibstone really be assessed as a poorer site than this Class 3 station at Heathrow below?

I contend that Met Office assessments are not consistent and there are many poorly located and unreliable high profile and more urban sites that are being unrealistically marked as significantly better than they really are. Conversely many good quality and truly representative lesser known rural sites are marked down. Craibstone is not perfect but it is certainly much more accurate, well considered and more reliable than very many others.

via Tallbloke’s Talkshop

https://ift.tt/U6u0XEG

October 25, 2024 at 09:04AM

Urban Heat Island Effects Have Not Yet Been Removed from Official GHCN Warming Trends

Our paper (co-authored by John Christy and Danny Braswell) on computing the urban heat island (UHI) effect as a function of population density (PD) is now in the final stages of review after a 3rd round of edits, and I’m hopeful it will be accepted for publication soon. So far, I’ve only used Tavg data (the average of daily maximum and minimum temperatures) in developing and testing the method, and the paper uses only contiguous U.S. summertime data (June, July, August), which is what I will address here.

The method allows us to compute UHI trends using global gridded PD datasets that extend back to the 1800s. These UHI trends can then be compared to GHCN station temperature trends. If I do this for all U.S. GHCN stations having at least 120 years of complete monthly (June, July, or August) data out of 129 potential years during 1895-2023, the following plot shows some interesting results. (I begin with the “raw” data so we can then examine how homogenization changes the results.)

  1. The greater a station’s population growth, the greater the observed warming trend. This is pretty convincing evidence that the raw GHCN data has substantial UHI effects impacting the computed trends (probably no surprise here). Note the UHI temperature trend averages 66% of the raw temperature trends.
  2. The regression line fit to the data intercepting zero shows that those stations with no population growth have, on average, no warming trend. While this might lead some to conclude there has been no net warming in the U.S. during 1895-2023, it must be remembered these are raw data, with no adjustments for time-of-observation (TOBS) changes or instrumentation type changes which might have biased most or all of the stations toward lower temperature trends.

Since most of the rural stations (many of which have experienced little population growth) are in the western U.S., and there can be differences in actual temperature trends between the eastern and western U.S., let’s look at how things change if we just examine just the eastern U.S. (Ohio to the Florida peninsula, eastward):

This shows the Eastern U.S. has features similar to the U.S. as a whole, with a regression line intercept of zero (again) indicating those stations with no population growth have (on average) no warming trend in the raw GHCN data. But now, amazingly, the average UHI trend is over 95% of the raw station trends (!) This would seemingly suggest essentially all of the reported warming during 1895-2023 over the eastern U.S. has been due to the urbanization effect… if there are no systematic biases in the raw Tavg data that would cause those trends to be biased low. Also, as will be discussed below, this is the the period 1895-2023… the results for more recent decades are somewhat different.

Homogenization of the GHCN Data Produces Some Strange Effects

Next, let’s look at how the adjusted (homogenized) GHCN temperature trends compare to the UHI warming trends. Recall that the Pairwise Homogenization Algorithm (PHA) used by NOAA to create the “adjusted” GHCN dataset (which is the basis for official temperature statistics coming from the government) identifies and adjusts for step-changes in time at individual stations by comparing their temperature time series to the time series from surrounding stations. If we plot the adjusted data trend along with the raw data trends, the following figure shows some curious changes.

Here’s what homogenizations has done to the raw temperature data:

  1. Stations with no population growth (that had on average no warming trend) now have a warming trend. I can’t explain this. It might be the “urban blending” artifact of the PHA algorithm discussed by Katata et al. (2023, and references therein) whereby homogenization doesn’t adjust urban stations to “look like” rural stations, but instead tends to smooth out the differences between neighboring stations, causing a “bleeding” of urban effects into the rural stations.
  2. Stations with large population growth have had their warming trends reduced. This is the intended effect of homogenization.
  3. There still exists a UHI effect in the homogenized trends, but it has been reduced by about 50% compared to the raw trends. This suggests the PHA algorithm is only partially removing spurious warming signals from increasing urbanization.
  4. Homogenization has caused the all-station average warming trend to nearly double (+89%), from +0.036 to +0.067 deg. C per decade.I cannot explain this. It might be due to real effects from changes in instrumentation, the time-of-observation (TOBS) adjustment, an unintended artifact of the PHA algorithm, or some combination of all three.

Does This Mean Recent Warming In The U.S. Is Negligible?

Maybe not. While it does suggest problems with warming trends since 1895, if we examine the most recent period of warming (say, since 1961…a date I chose arbitrarily), we find considerably stronger warming trends.

Note that the GHCN trends since 1961 are nearly the same from raw (+0.192 C/decade) as from homogenized (+0.193 C/decade) data. The average UHI warming trend is only about 13% of the raw GHCN trend, and 10% of the homogenized trend, indicating little of the GHCN warming trend can be attributed to increases in population density.

But there still remains an urbanization signal in both the raw and adjusted data, as indicated by the non-zero regression slopes. One possible interpretation of these results is that, if the homogenization algorithm is distorting the station trends, and if we can use the raw GHCN data as a more accurate representation of reality, then the regression intercept of +0.10 deg. C/decade becomes the best estimate of the all-station average warming trend if NONE of the stations had any growth in population. That is little more than 50% of the homogenized data warming trend of +0.192 deg. C/decade.

What Does It All Mean?

First, there is evidence supporting the “urban blending” hypothesis of Katata et al., whereby the homogenization algorithm inadvertently blends urban station characteristics into rural temperature data. This appears to increase the all-station average temperature trend.

Second, homogenization appears to only remove about 50% of the UHI signal. Even after homogenization, GHCN temperature trends tend to be higher for stations with large population growth, lower for stations with little population growth. There is some evidence that truly rural stations would have only about 50% of the warming averaged across all U.S. stations, which is consistent with Anthony Watts’ estimates based upon restricting analysis to only those best-sited stations.

These results suggest there is now additional reason to distrust the official temperature trends reported for U.S. weather stations. They are, on average, too warm. By how much? That remains to be determined. Our method provides the first way (that I know of) to independently estimate the urban warming effect over time, albeit in an average sense (that is, it is accurate for the average across many stations, but its accuracy at individual stations is unknown). As my career winds down, I hope others in the future will extend this type of analysis.

[To see what the total UHI signal is in various calendar months around the world as of 2023, here are the hi-res images: Jan, Feb, Mar, Apr, May, Jun, Jul, Aug, Sep, Oct, Nov, Dec. More details of our method, along with links to monthly ArcGIS-format files of global UHI grids since 1800 (Version 0) are contained in my blog post from November, 2023.]

via Roy Spencer, PhD.

https://ift.tt/LzsjvBi

October 25, 2024 at 08:38AM