West Entraps Itself, China Amused

Joel Kotkin explains in his National Post article Western nations cripple their economies with green initiatives while China and others laugh.  Excerpts in italics with my bolds and added images.

Despite massive subsidies and world forums,
green power still only represents one-fifth of global energy

North America, with its vast resources, may be in a position to save the economies of the west. But governments on both sides of the border seem more concerned with green virtue signaling than actually finding a workable approach to carbon emissions that does not undermine our economies and ability to defend ourselves.

The prevailing notion, both in Ottawa and D.C., is that our countries should ignore our resources, and how best to use them, in order to fulfill a messianic vision of massive, rapid emissions reduction.

Canada’s proposed carbon tax, pushed through media at government expense, and zealously promoted by Mark Carney, who thinks mass decarbonization, as epitomized by Europe, provides the road map to prosperity, despite the continent’s consistent economic lethargy.

This approach has also poisoned politics as not all provinces are affected equally by the initiative. The institution of the carbon tax and other measures by government and through the relentless pressure of green non-profits, to get a 40 per cent emissions cut by 2030 may be the toast of investment bankers betting on cashing in on forced changes. But for taxpayers, the impact will vary by province. Fossil fuels account for five per cent of Canada’s overall GDP but four times as much in Calgary, Newfoundland and Labrador.

However, as much this appeals to academics and wealth
pearl-clutchers in cities, it translates into higher prices than normal.

As the NDP’s Jagmeet Singh suggested, it places unfair “burdens” on the working class, one reason for his opposition to the tax. Worse still, the biggest green targets of what climatistas label as “industrial carbon” could devastate those same NDP voters — blue collar workers in mining, like manufacturing, logistics and agriculture.
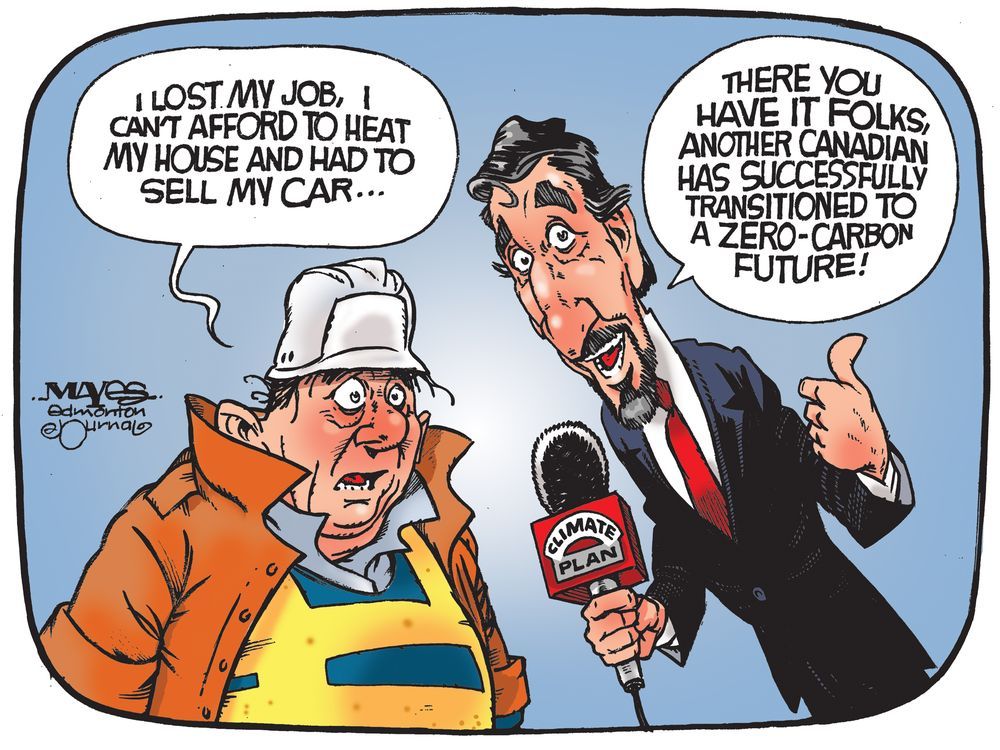
Canada does not need another way to slow its economy. One recent estimate suggests that the proposed $170 a ton proposal would slice 1.8 per cent from the country’s already anemic GDP and cost upwards of 185,000 net jobs. Even Liberals admit something close to a 1 per cent decline. Some may see these draconian attempts to wipe out fossil fuels as the Lord’s work, but on the ground level it seems closer to class warfare.
Trudeau and his supports insist these policies are critical for saving the planet. Yet, attempts to follow such approaches elsewhere have not ended well. In Europe, most obviously Germany, as well as California, the shift to “renewable energy” has led, as it usually does, to high prices that already are driving German industry off the continent. Although not nearly as well-endowed with energy as North America, the climate lobby in Europe makes sure to throttle anything, such as offshore oil in the UK — in pursuit of green puritanism.
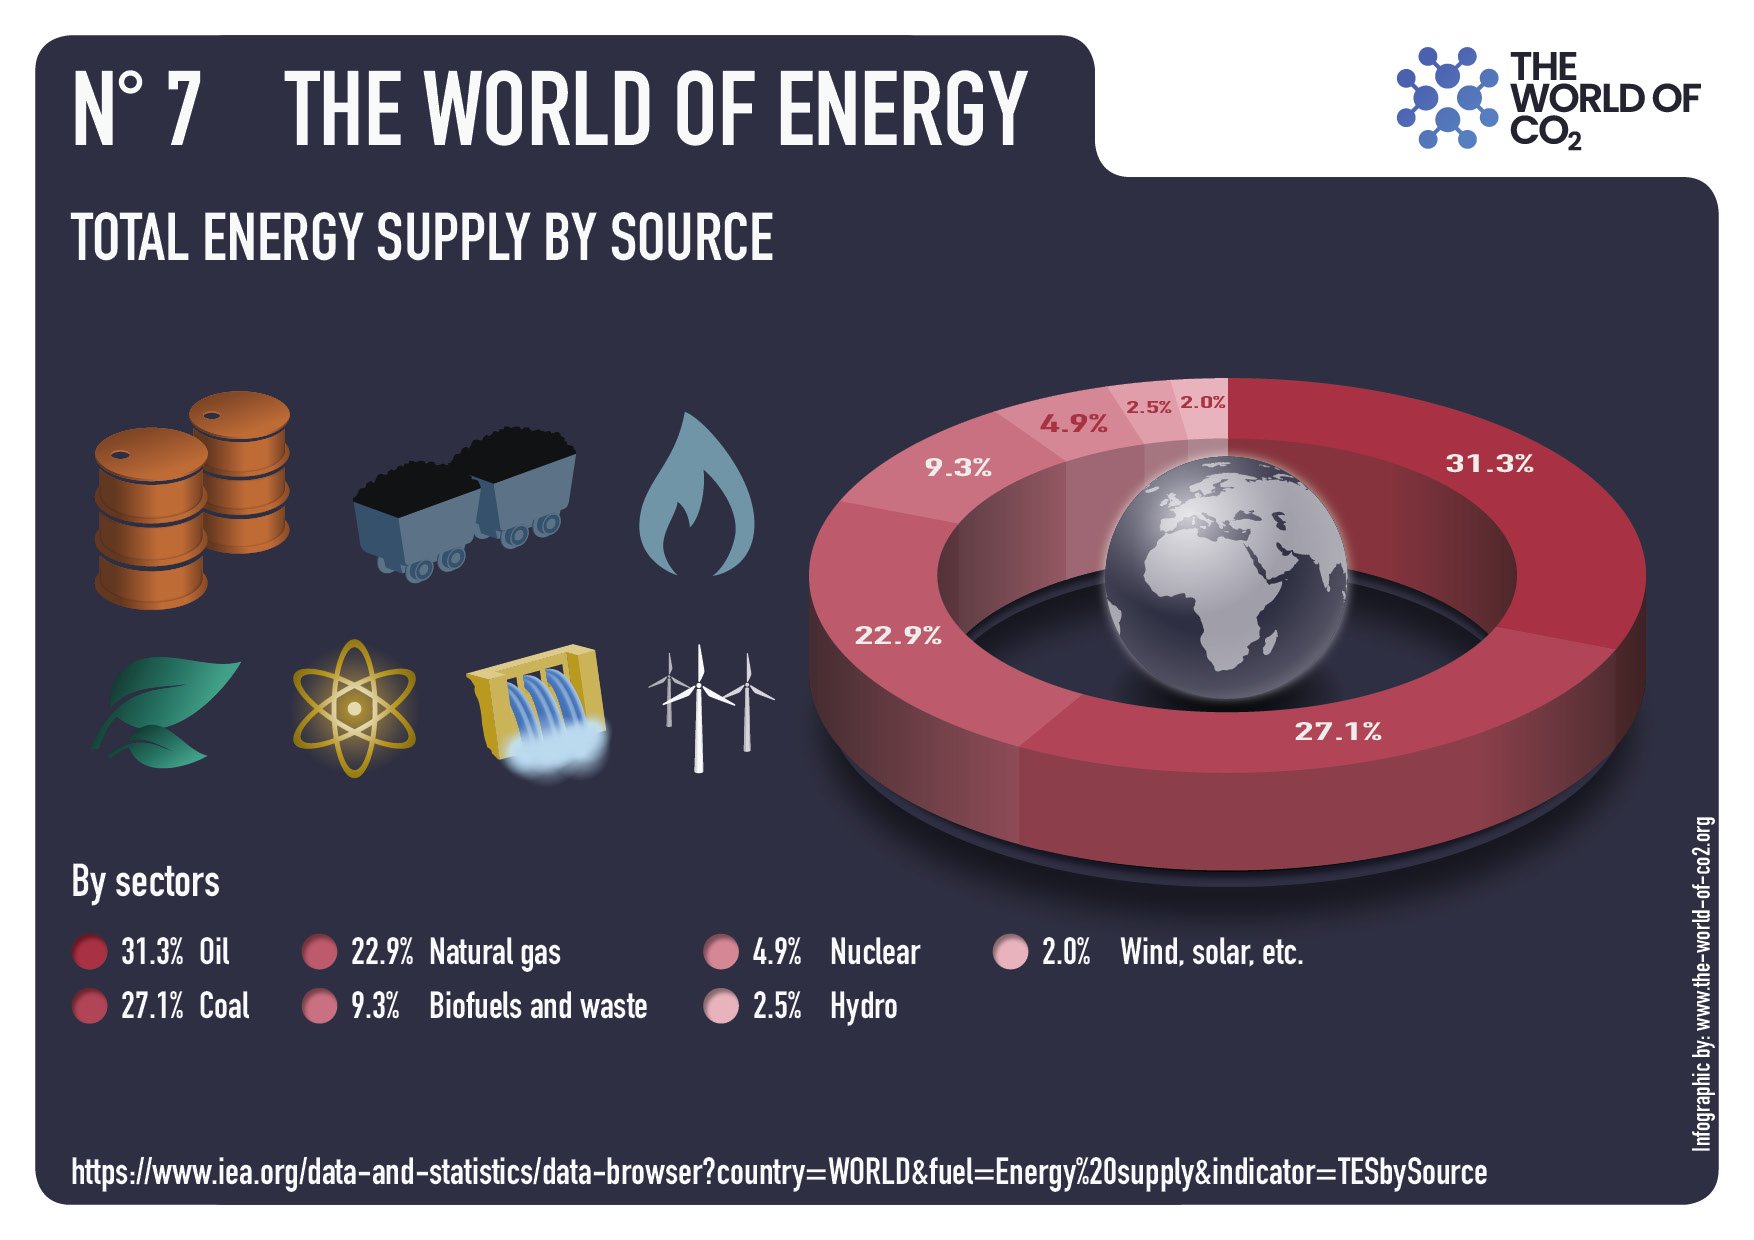
There’s something delusional in many of these initiatives. A key mistake is the common green assertion that fossil fuels are becoming obsolete and should be wiped out for the benefit of fitting a new economy. Yet, in the real world, despite billions in subsidies for “green power,” fossil fuels still represent roughly four fifths of global energy generation, just as it did twenty years ago. This is after expenditures of over one trillion were spent on solar and wind. The West has been reducing per capita emissions for years, but this is utterly subsumed by growth in developing countries, notably China, which not only buys huge amounts of natural gas but continues to open new coal-fired plants at a rapid rate.

North Americans be forewarned that in imposing burdens on themselves, but not competitors, green governments are essentially guaranteeing their own decline. Already in the EU, nearly a million industrial jobs have been lost over the past few years, with investment shifting to countries like China and India, which freely use coal and fossil fuels to keep costs down.

Britain’s path may give the starkest preview of the future Biden and Trudeau have in mind for us. Since 1990 the manufacturing sector’s share of GDP has dropped roughly 50 per cent along with several million jobs. This parallels a two thirds drop in UK energy production, while consumption has fallen by only one third. Three decades ago, a net energy exporter, the UK now increasingly depends on imports from the Middle East and other unstable regions.
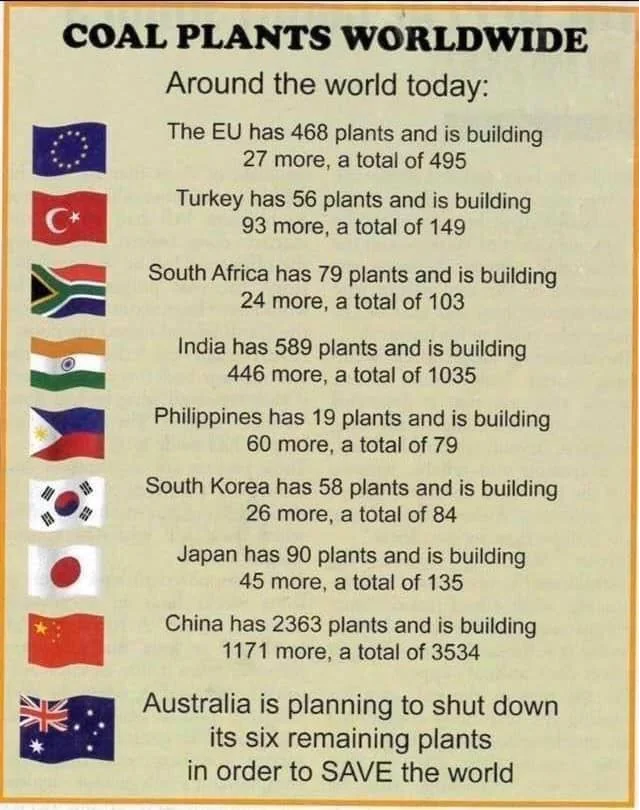
The winner here is clearly China, a country that emits more GHG than all developed countries put together. Ironically, carbon reduction policies fit brilliantly into its strategy to use its coal and other fossil fuel energy to power their takeover of the “green economy.” China has placed itself in the catbird’s seat on renewable energy, including utter domination of solar panels and electric vehicles. China already produces twice as many EVs as the US and the EU combined, and seeks to leverage its total domination of the solar-panel industry — its battery capacity is now roughly four times ours. China also exercises effective control of the requisite rare earth minerals and the technologies used to process them.
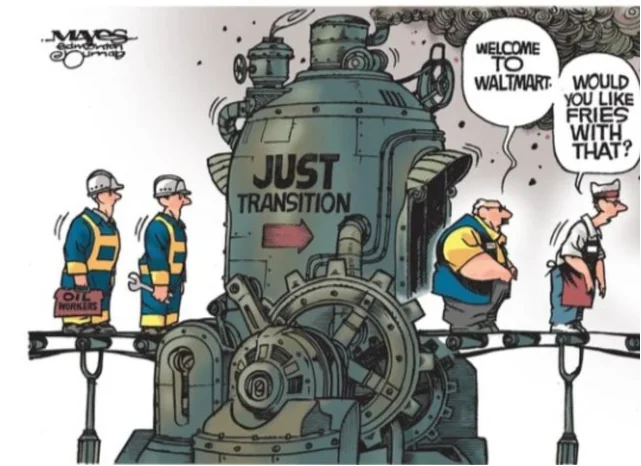
As the west’s own overpriced EVs sit on lots, China plays us for utter fools as we undermine our own industrial economy. The forced march to EV will be particularly tough on the 125,000 who work in Canada’s car factories. Manufacturing and mining, much of it energy-related, represent, along with real estate, two of the country’s largest industries. Under the current circumstances, they are heading for a spectacular fall. Overall, the EV industry in the U.S. uses 30 per cent less domestic labor than traditional gasoline car manufacturing, and under current circumstances can only hope for some basic assembly work using Chinese components.

These policies will affect every industry and consumer as cars and things like heaters are all forced to electrify. Britain’s shift to EVs is projected to double the demand for electricity by 2040, and its government is already looking to ban the use of home chargers during peak hours. By 2050 in California, state consultants estimate total energy demand will skyrocket, by some estimates rising 60 to 90 per cent. Not surprisingly, the state will face “acute electricity shortages” over the coming decade, according to one recent analysis.

Rising demands for electricity for artificial intelligence seems likely to add to this burden. Microsoft alone is opening a new data centre globally every three days. These power-hungry operations are expected to grow from 4.5 per cent of energy demand to 10 per cent by 2035. Artificial intelligence and data center demand are leading to massive expansions in projected energy use around the world at a time of restricted supply. Google, renowned for its green virtue signaling, has boosted its own emissions by 50 per cent since 2019.

Ultimately, the oligarchs will likely get their juice from sources like decommissioned nuclear energy, while the average family will take the economic hit in order to fulfill the agenda pushed by the likes of Steve Jobs’ widow, Lauren, Michael Bloomberg, the Rockefellers, Jeff Bezos and venture capitalist John Doerr. These, and other oligarchic allies, are waging a sophisticated and well-financed media and institutional campaign to catastrophize the climate issue as a way to ban gas stoves, stop new LNG facilities, and crack down on plastics.
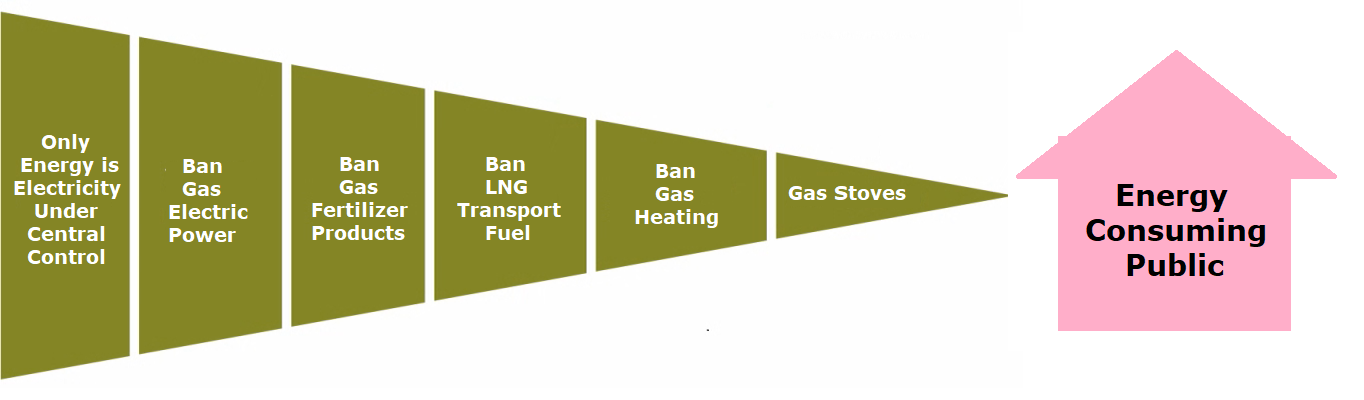
Finally, there is the issue of security, particularly relevant in an age of declining western power. The new green mandates, if adopted, presage yet another force to further reduce the industrial prowess of western countries, while driving more industries to China, India, and other countries who produce their goods with dirtier fuels and develop resources with less environmental care. At the same time, third world countries, for the most part, are not embracing “net zero,” as it is totally infeasible for them and will likely resist western lectures on climate policy.

All of this is occurring as a concert of ugly energy producers — Russia, Iran, and Venezuela — press their advantage on western countries. They stand to benefit from continued de-industrialization as one way to further weaken the military capacity of the west. Taking away North American liquified natural gas from Europe simply makes the continent more dependent on such malefactors as Qatar, a primary backer of terrorists and their supporters, and may lead the west, hat in hand, to beg from even worse regimes, like Russia and Iran.

The good news — while green virtue-signaling may appeal to Trudeau, Biden, and Harris — these policies could be impacted by political realities. Worried about voters in industrial states like Michigan and Pennsylvania, Harris, even as she embraces environmental bromides, has backed away from EV mandates and opposition to fracking, albeit with dubious credibility. Yet, perhaps she realizes, or those around her do, that these policies do not sell well compared to promoting more affordable and reliable energy. Trudeau, if he wants to remain relevant, may similarly need to flip the script if he hopes to forestall an utter political defeat.

via Science Matters

https://ift.tt/1EdBXyN

October 22, 2024 at 01:48PM

No, The Carbon Sinks Aren’t Sinking

Guest Post by Willis Eschenbach (@WEschenbach on eX-Twitter)

The usual font of misinformation, the Guardian, has an article claiming the following:

In 2023, the hottest year ever recorded, preliminary findings by an international team of researchers show the amount of carbon absorbed by land has temporarily collapsed. The final result was that forest, plants and soil – as a net category – absorbed almost no carbon.

Hmmm, sez I as my bad number detector starts ringing … sounds fishy. Something on the order of 55% of emitted CO2 is sequestered and 45% remains airborne. Of this, some 75% is sequestered on land. So if land sequestration has “collapsed”, we should see an immediate jump in airborne CO2 of about 75% * 55% ≈ 41%. But I don’t recall seeing that in the data … hmmm.

And indeed, this jump in atmospheric CO2 is what the “preliminary findings” paper linked above uses as the basis of their claims about the carbon sinks, viz (emphasis mine):

In 2023, the CO2 growth rate was 3.37 ± 0.11 ppm at Mauna Loa, 86% above the previous year, and hitting a record high since observations began in 1958, while global fossil fuel CO2 emissions only increased by 0.6 ± 0.5%. This implies an unprecedented weakening of land and ocean sinks, and raises the question of where and why this reduction happened.

…

The CO2 growth rate in the decade 2013-2022 has averaged at 2.42 ± 0.08 ppm yr -1 . In 2023, it increased to a record high value of 3.37 ± 0.11 ppm yr -1 at the Mauna Loa station (MLO).

Whoa, biggest jump in the record, which “implies an unprecedented weakening of land and ocean sinks“! EVERYONE PANIC!!

So as is my habit, I went to the Mauna Loa site and got the CO2 data. It’s monthly, so I converted it to annual data. Here is the result, showing the growth rate for a given year as the average value for the previous year subtracted from the average value for the given year.

Figure 1. Annual change in atmospheric CO2

Hmmm, sez I once again… the change from 2022 to 2023 looks perfectly average, and at 2.5 ppmv, it’s certainly not the 3.37 ppmv they claim. Why would that be? They can’t be calculating the difference in annual averages.

A closer look at what the NOAA folks are doing when they calculate what they call the “annual mean rate of growth” explains the mystery.

The annual mean rate of growth of CO2 in a given year is the difference in concentration between the end of December and the start of January of that year. If used as an average for the globe, it would represent the sum of all CO2 added to, and removed from, the atmosphere during the year by human activities and by natural processes.

There is a small amount of month-to-month variability in the CO2 concentration that may be caused by anomalies of the winds or weather systems arriving at Mauna Loa. This variability would not be representative of the underlying trend for the northern hemisphere which Mauna Loa is intended to represent.

Therefore, we finalize our estimate for the annual mean growth rate of the previous year in March, by using the average of the most recent November-February months, corrected for the average seasonal cycle, as the trend value for January 1. Our estimate for the annual mean growth rate (based on the Mauna Loa data) is obtained by subtracting the same four-month average centered on the previous January 1.

Now, that all sounds perfectly legit, but doesn’t explain the large 2023 value. So I looked at the monthly data. Figure 2 below shows the more recent of the four-month November-February periods that they are averaging.

Figure 2. Year over year difference, monthly CO2 data. Blue bars highlight the periods from November to February used in their calculations

Following their instructions, I can replicate their calculations exactly. And in Figure 2, we can see why they’ve gotten such a high number—by chance, the data centered on Jan 1, 2024 occurred during a peak time of annual CO2 rise, and the data centered on Jan 1, 2023 occurred during a low time.

What difference does that make? Well, they’ve taken a four-month average starting in November, and compared that to the same period of the previous year … but they could just as easily have started their four-month average in January or June and done the same calculation of annual change.

But here’s the thing. If they’d chanced to start their four-month average in January rather than November, instead of the difference from 2022 to 2023 being the largest jump in the record, it would only be the 24th largest out of the 64 years. If they’d started in February, 11th largest. And if they’d started in June, it would be the 7th largest jump in the record.

And of course, this means that their claim that the carbon sink “is failing” is a totally falsified artifact of their calculation method. It depends entirely on the random choice of the month they’ve used to start their four-month average, and if they’d started in January, they’d have been forced to conclude that there’s nothing unusual going on with the carbon sink in the slightest.

Having been caught by confirmation bias more than once, I can only have compassion for the authors. They were looking for a climate disaster, they thought they’d found one, and unfortunately, because that confirmed their preconceptions, they didn’t look any deeper.

However … they’re still totally wrong. The data doesn’t show any change in the carbon sinks. It’s just an artifact of the odd way that they are calculating the “annual” change.

My very best to everyone, I’m going outside to see the moon.

w.

As Usual: When you comment, I ask that you quote the exact words you’re discussing … it avoids endless misunderstandings.

via Watts Up With That?

https://ift.tt/PL0DdT6

October 22, 2024 at 12:04PM

Dunbar DCNN1699 – Another Cricketing Venue.

56.00458 -2.52833 Met Office assess CIMO Class 4 Installed 1/1/1930

Firstly, whilst I understand this is possibly not the best a site can be, I fail to understand how this is so lowly rated site (considered inaccurate up to 2°C) can be regarded inferior to some sites in terrible locations which are rated better at Class 3 i.e. Heathrow.

Another slightly quirky location by a cricket pitch (as in Coventry:Coundon and Linkenholt Post Office – and there are more cricket pitch sites) it is certainly a flat and open location not subject to shading or artificial wind breaks.

Here is the close up which perhaps reminds more of a security location than a weather station.

Clearly they do not want anyone messing about with the instrumentation which is a good thing – the Met Office had to recently permanently close Lochgilphead due to continued vandalism. Security there though was non existent as shown below.

Back to Dunbar and there is a charming insight into data reading from someone who temporarily fulfilled that function and well worth reading.

https://jherring.wordpress.com/tag/weather-station/

He makes many comments regarding the sunshine recording, after all Dunbar is often reported to be the sunniest place in Scotland. As you can see from the reasonably good quality of the site, the necessary security, the diligent reading and maintenance so often associated with civic sites makes this not perfect, but certainly a trustworthy site. Then again this site rarely boasts temperature “extremes” of any kind.

As a footnote, perhaps it is not so surprising to have weather stations alongside cricket pitches as they are potentially good open space sites….And as for Scottish cricketers – I live near the St Lawrence Ground Canterbury and down here we all fondly remember our former county (and “country”) England Captain and club President Mike Denness, a true Scot.

via Tallbloke’s Talkshop

https://ift.tt/vCSgbJN

October 22, 2024 at 10:39AM

NC Floods, CA Drought, and The Role of Randomness

The recent devastating floods in western North Carolina were not unprecedented, but were certainly rare. A recent masters thesis examining flood deposits in the banks of the French Broad River over the last 250-300 years found that a flood in 1769 produced water levels approximately as high as those reported in the recent flood from Hurricane Helene. So, yes, the flood was historic.

Like all severe weather events, a superposition of several contributing factors are necessary to make an event “severe”, such as those that led to the NC floods. In that case, a strong hurricane combined with steering currents that would carry the hurricane on a track that would produce a maximum amount of orographic uplift on the east side of the Smoky Mountains was necessary in order to produce the widespread 12-20 inch rainfall amounts, and the steering currents had to be so strong that the hurricane would penetrate far inland with little weakening.

Again, all severe weather events represent the somewhat random combining of amplifying components: In the case of Hurricane Helene, they produced the unlucky massive flooding result that the region had not seen in hundreds of years.

The Random Component of Precipitation Variability

The rare superposition of several rare contributing factors, or the more common superposition of more common factors, can be examined through statistics when one examines many events. For example, it has long been known that precipitation statistics gathered over many years exhibit a log-normal frequency distribution. Simply put, the lowest precipitation amounts are the most frequent, and the highest amounts are the least frequent. This is the statistical result of the superposition of contributing factors, such as (in the case of excessive rainfall) abundant humidity, an unstable air mass, low-level convergence of air, a stationary or slow-moving storm (In western NC, the mountains providing uplift are stationary), etc.

Extreme precipitation events are (of course) the most rare, and as such, they can exhibit somewhat weird behavior. This is why hydrologists disagree over the usefulness of the term “100-year flood”, since most weather records don’t even extend beyond 100 years. One would probably need 1,000 years of rainfall records to get a good estimate of what constitutes a 100-year event.

Simulating Extreme Rainfall Events through Statistics

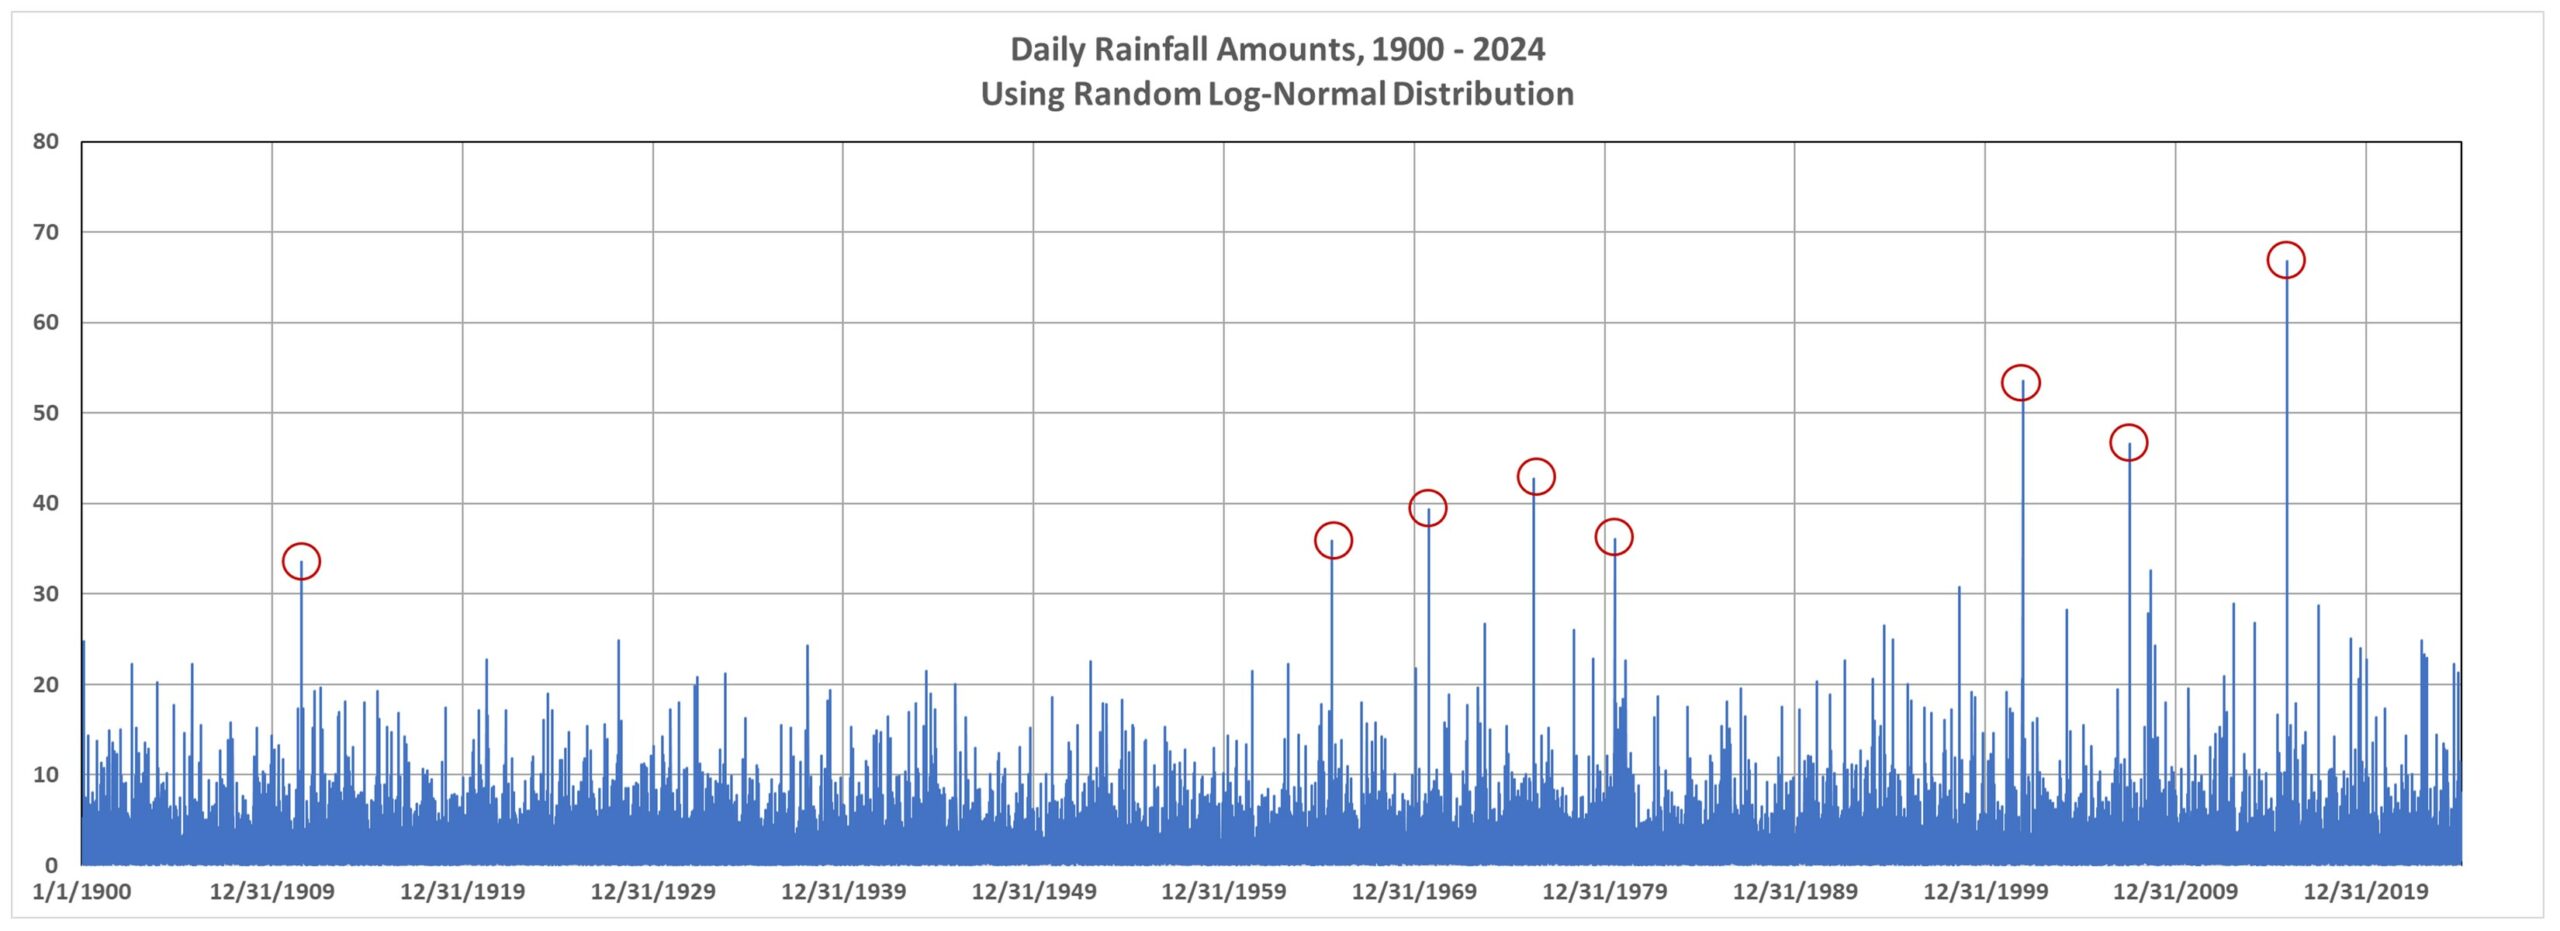
It is easy in Excel to make a simulated time series of rainfall totals having a log-normal distribution. For example, the following plot of hypothetical daily totals for the period 1900 through 2024 shows an seemingly increasing incidence of days with the heaviest rainfall (red circles). Could this be climate change?

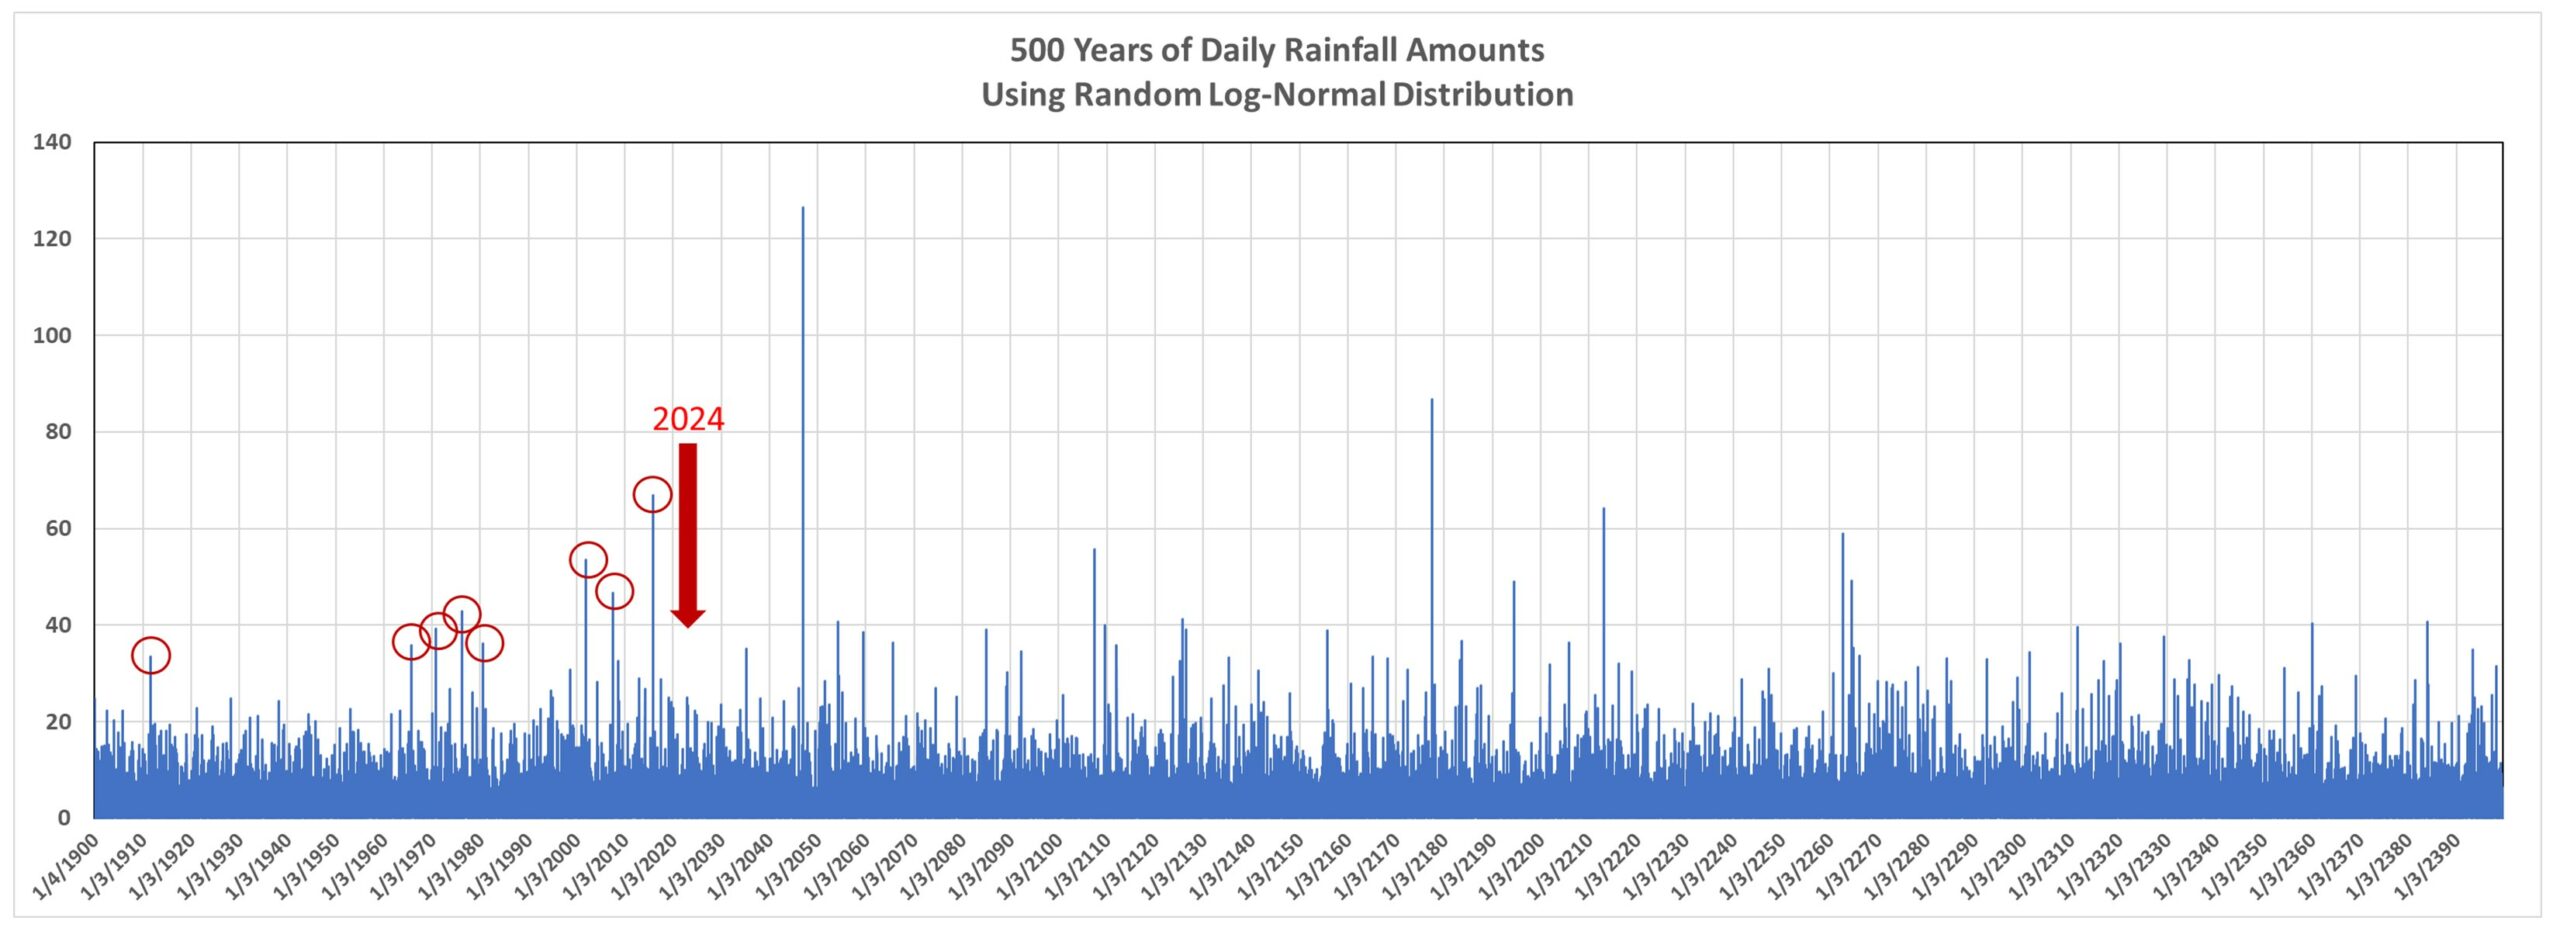
But remember, these are randomly generated numbers. Just like you can flip a coin and sometimes get 4 heads (or 4 tails) in a row doesn’t mean there is some underlying cause for getting the same result several times in a row. If we extend the above plot from 125 years to 500 years, we see (following plot) that there is no long-term increasing trend in heavy rainfall amounts:

Black Swan Events

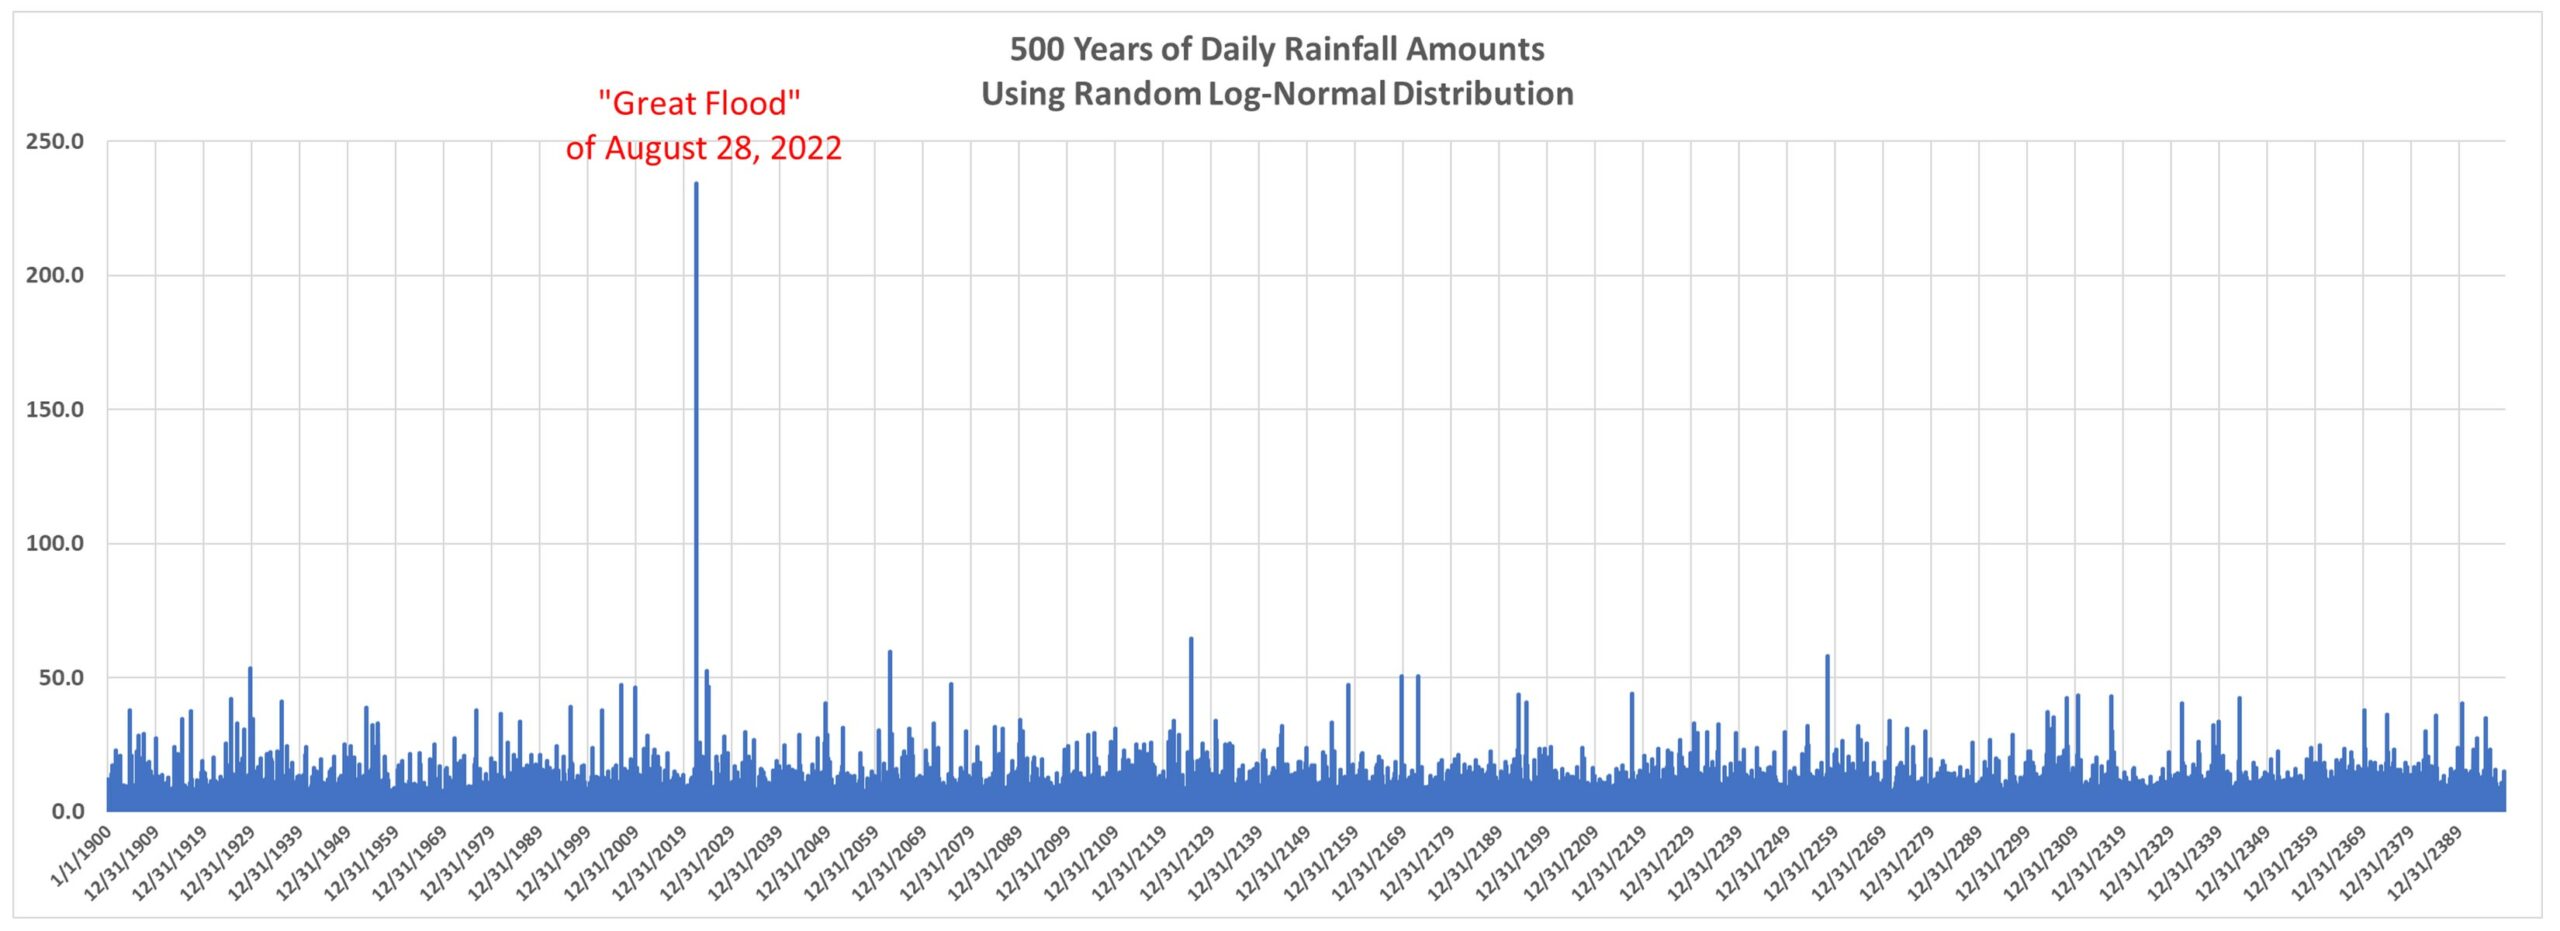
Or, how about this one, which I will call “The Great Flood of August 28, 2022”?:

Note that this event (generated with just log-normally distributed random numbers) far exceeds any other daily event in that 500-year plot.

The point here is that too often we tend to attribute severe weather events to some underlying cause that is emerging over time, such as global warming. And, I believe, some of the changes we have seen in nature are due to the (weak and largely benign) warming trend most regions of the world have experienced in the last 100 years.

But these events can occur without any underlying long-term change in the climate system. To attribute every change we see to global warming is just silly, especially when it comes to precipitation related events, such as flood… or even drought.

A “Random Drought”

Now changing our daily random log-normal precipitation generator to a monthly time scale, we can look at how precipitation amounts change from decade to decade. Why monthly? Well, weather variations (and even climate cycles) tend to have preferred time scales. Several days for synoptic weather patterns, quasi-monthly for some kinds of persistent weather patterns, and even yearly or decadal for some natural internal climate cycles.

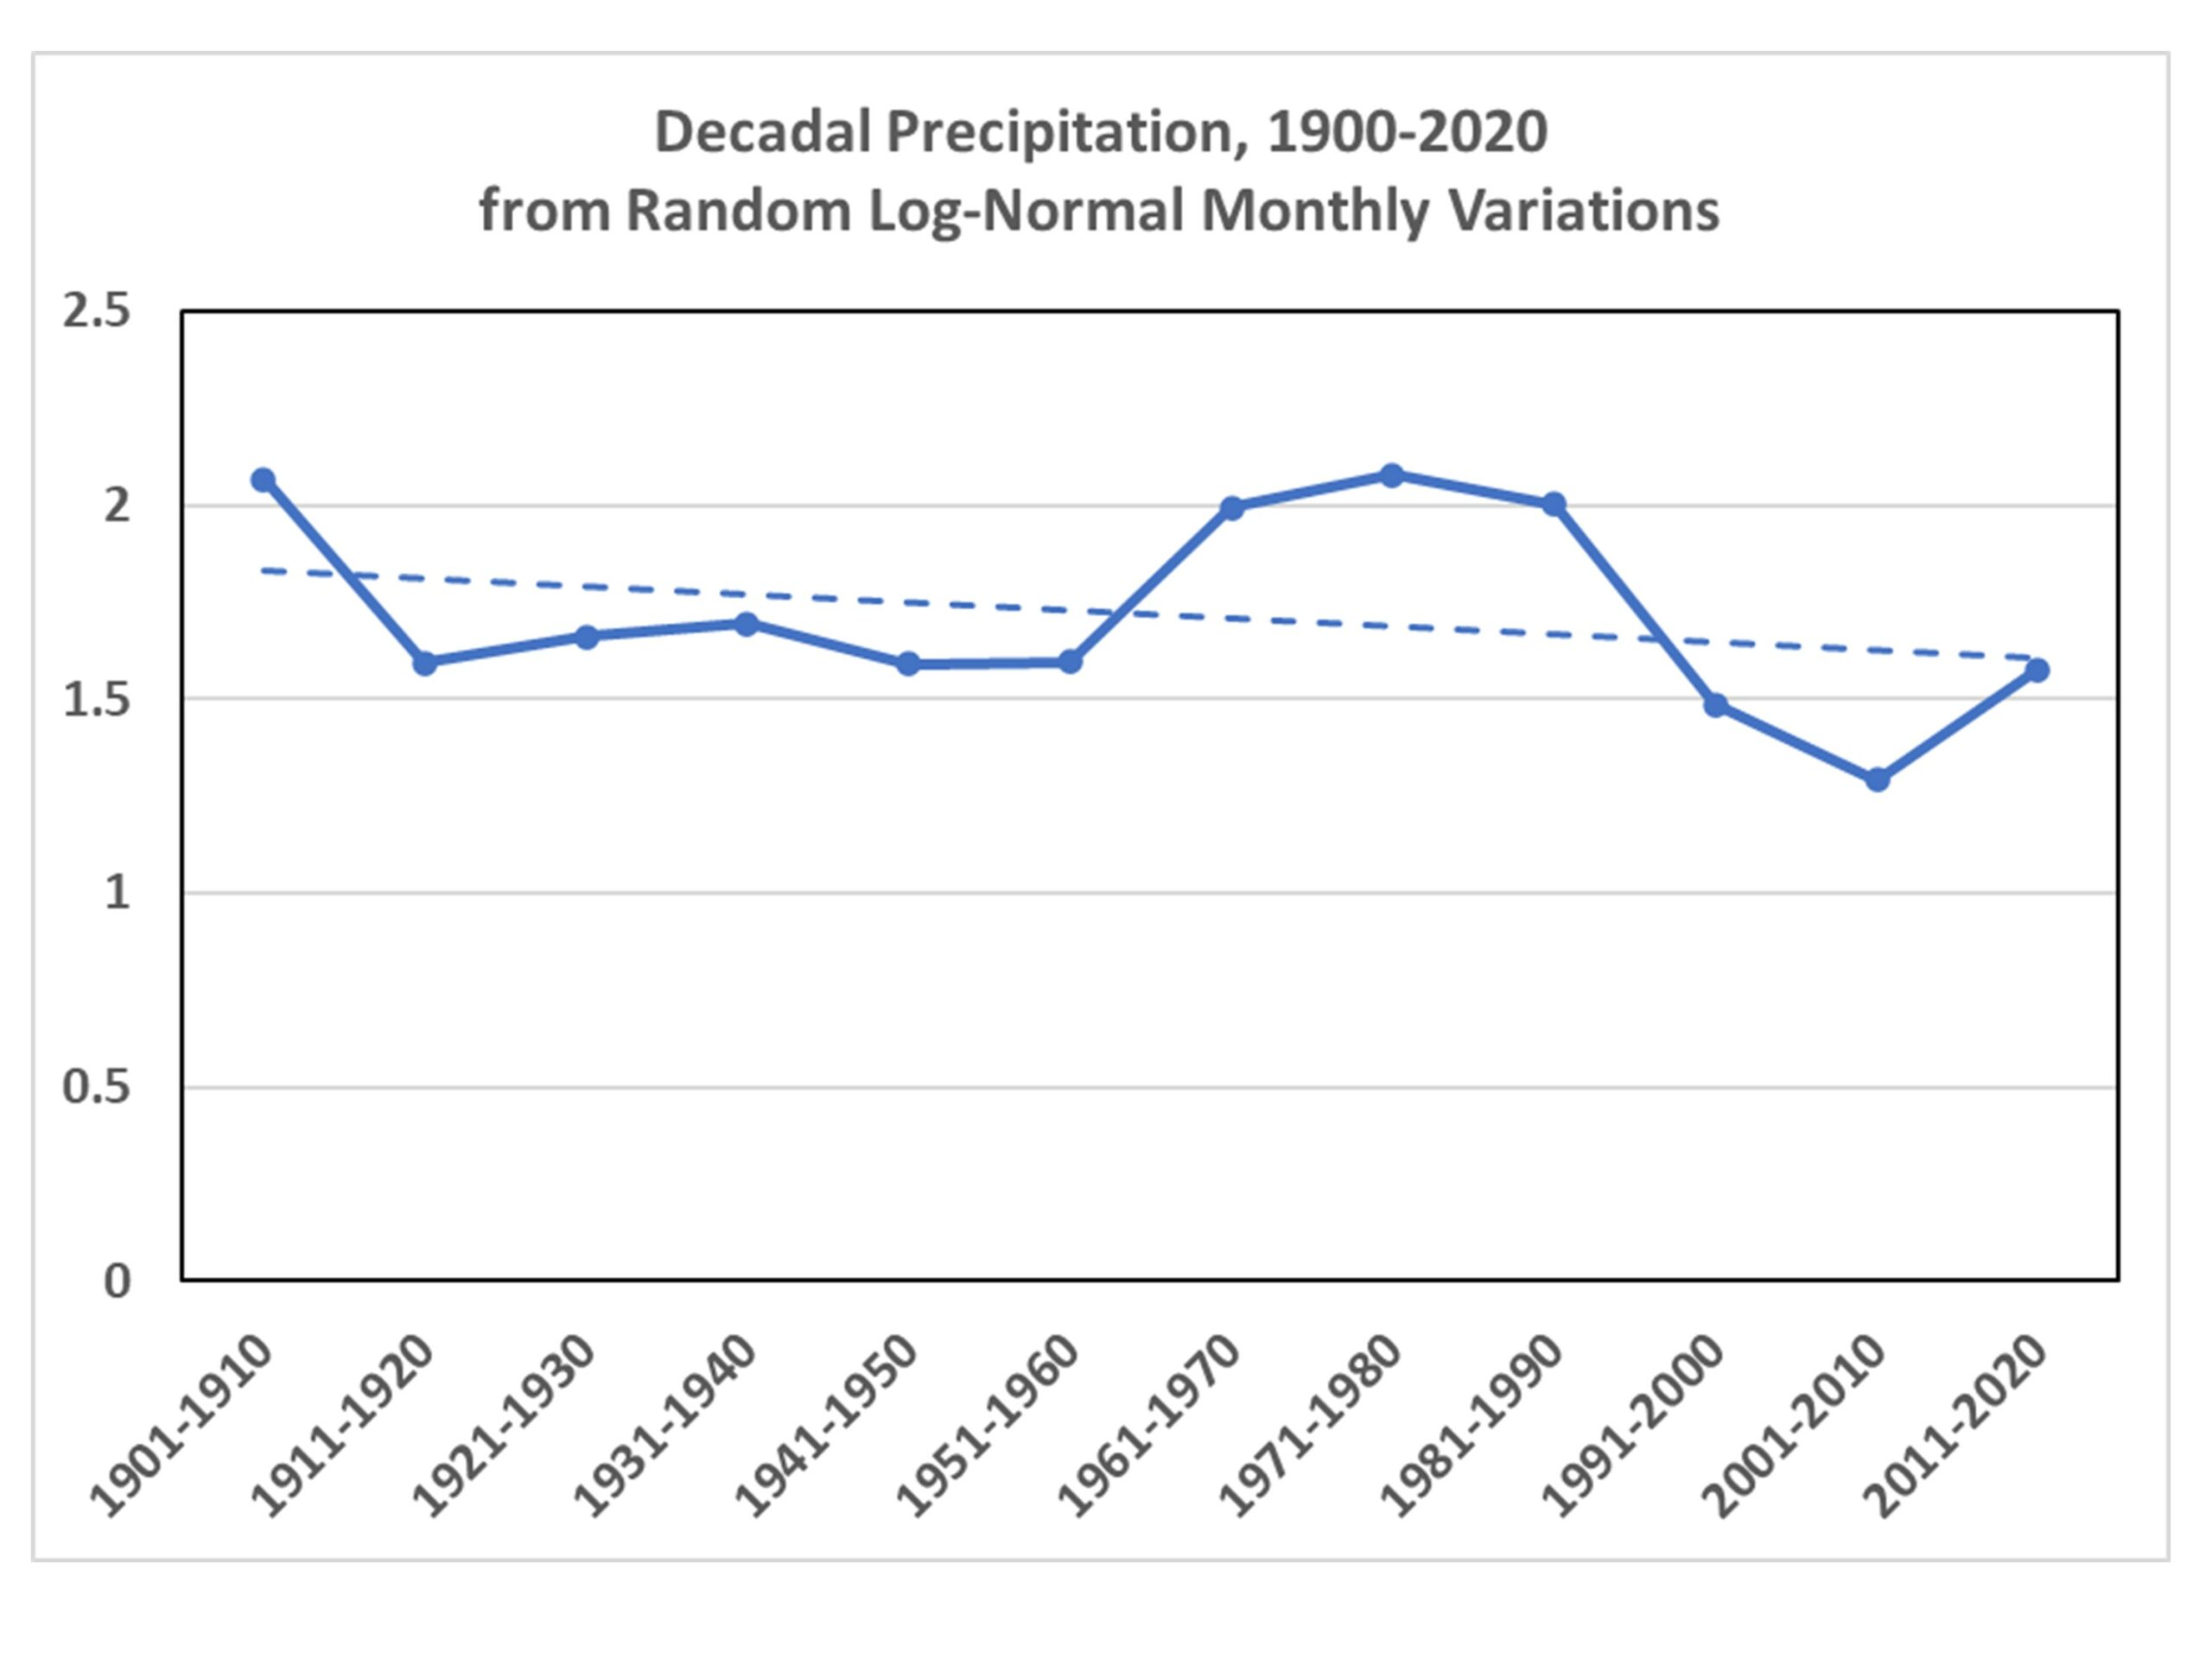
When I generate random log-normal time series at monthly time scales, and compute decadal averages over the last 120 years, seldom is the long-term trend close to zero. Here’s one what shows low precipitation for the most recent three decades, just purely through chance:

That looks like something we could attribute to drought in California, right? Yet, it’s just the result of random numbers.

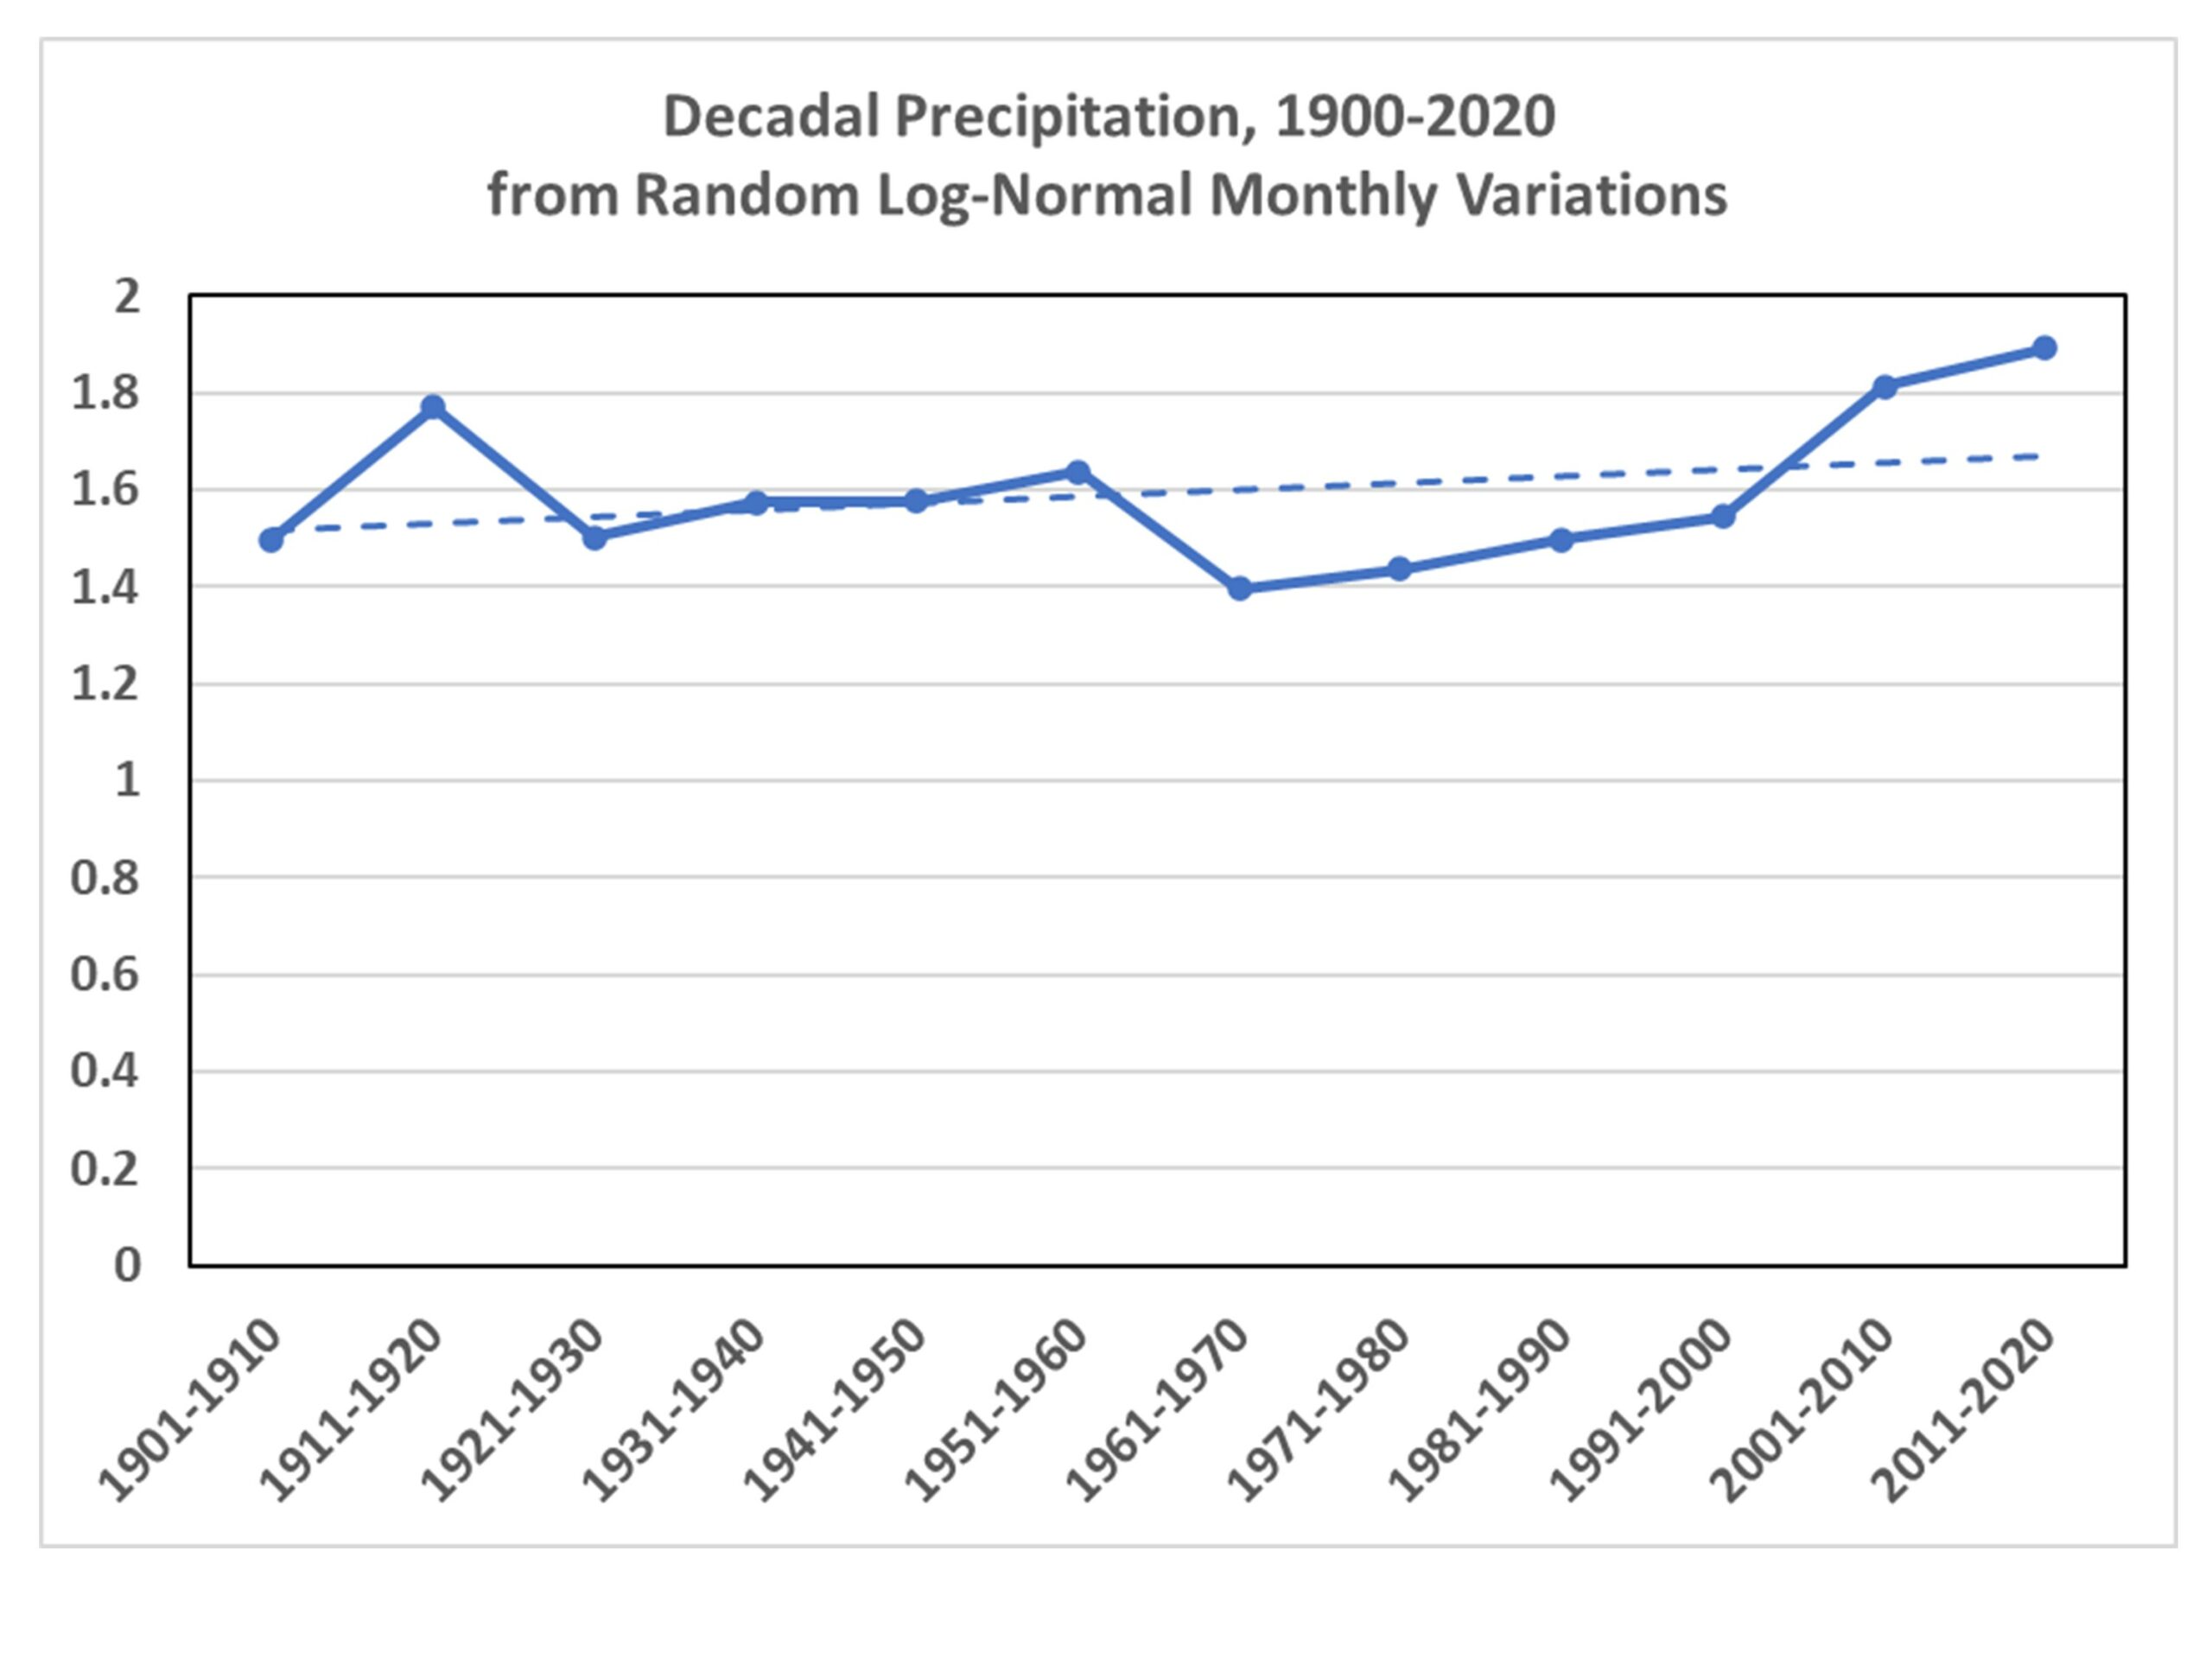
Or, we can choose one of the random simulations that has an increasing trend:

I’m sure someone could tie that to global warming.

A Final Word About 100-Year Flood Events

There seems to be some misunderstanding about 100-year events. These almost always apply to a specific location. So, you could have 100-year events every year in the U.S., and as long they are in different locations, there is nothing unusual about it. A 100-year flood in western North Carolina this year could be followed by a 100-year flood in eastern North Carolina next year. That doesn’t mean 100-year floods are getting more frequent.

I’m not claiming that all severe weather is due to randomness. Only that there is a huge random component to it, and that’s what makes attribution of any kind of severe weather event to climate change essentially impossible.

via Roy Spencer, PhD.

https://ift.tt/6VrEQ54

October 22, 2024 at 09:34AM