
0 out of 10 based on 0 rating
via JoNova
October 13, 2024 at 10:16AM

With Arctic ice melting season winding down, warmists again stoked fears about ice disappearing in the North. In fact, the pattern of Arctic ice seen in historical perspective is not alarming. People are over-thinking and over-analyzing Arctic Ice extents, and getting wrapped around the axle (or should I say axis). So let’s keep it simple and we can all readily understand what is happening up North.
I have noticed at some other blogs people complain about my monthly Arctic ice updates focusing on extents starting in 2007. This post will show why that time period is entirely reasonable as a subject for analysis. I will use the ever popular NOAA dataset derived from satellite passive microwave sensors. It sometimes understates the ice extents, but everyone refers to it and it is complete from 1981 to present. Here’s what NOAA reports (in M km2):
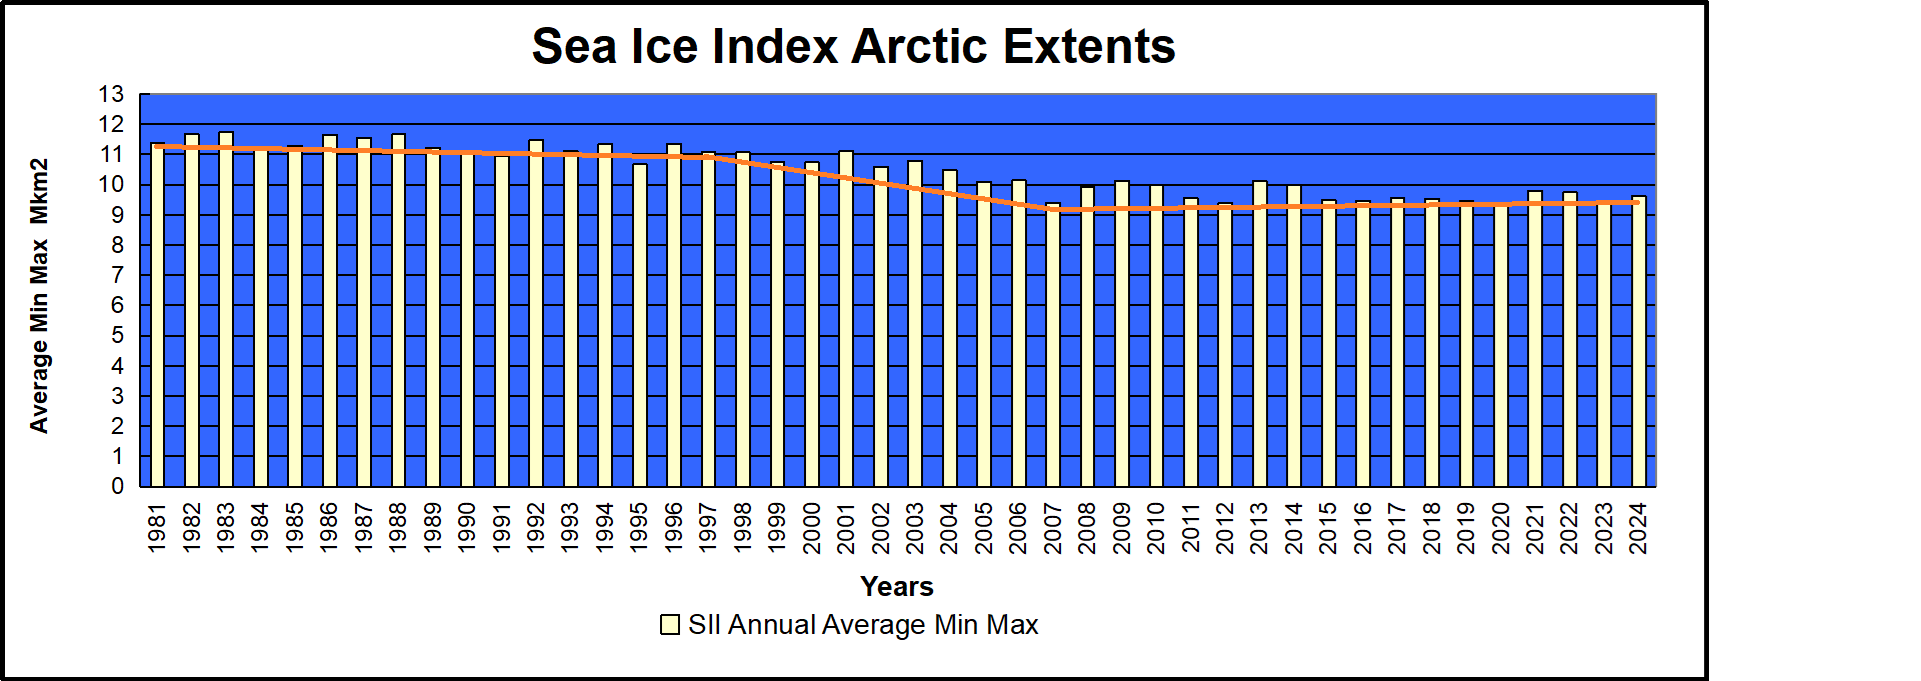
We are frequently told that only the March maximums and the September minimums matter, since the other months are only transitional between the two. So the graph above shows the mean ice extent, averaging the two months March and September. The data comes from Sea Ice Index (SII).
If I were adding this to the Ice House of Mirrors, the name would be The X-Ray Ice Mirror, because it looks into the structure of the time series. For even more clarity and simplicity, here is the table:
NOAA NH Annual Average Ice Extents (in M km2). Sea Ice Index v3.0 (here)
| Year | Average | Change | Rate of Change |
| 1981 | 11.385 | ||
| 1997 | 11.077 | -0.308 | -0.019 per year |
| 2007 | 9.405 | -1.672 | -0.167 per year |
| 2024 | 9.773 | +0.368 | +0.013 per year |
The satellites involve rocket science, but this does not. There was a small loss of ice extent over the first 17 years, then a dramatic downturn for 10 years, 9 times the rate as before. That was followed by the current 17-year plateau with a slight gain comparable to the beginning loss. All the fuss is over that middle period, and we know what caused it. A lot of multi-year ice was flushed out through the Fram Strait, leaving behind more easily melted younger ice. The effects from that natural occurrence bottomed out in 2007.
Kwok et al say this about the Variability of Fram Strait ice flux:
The average winter area flux over the 18-year record (1978–1996) is 670,000 km2, ;7% of the area of the Arctic Ocean. The winter area flux ranges from a minimum of 450,000 km2 in 1984 to a maximum of 906,000 km2 in 1995. . .The average winter volume flux over the winters of October 1990 through May 1995 is 1745 km3 ranging from a low of 1375 km3 in the 1990 flux to a high of 2791 km3 in 1994.
https://www.researchgate.net/publication/261010602/download
Conclusion:
Some complain it is too soon to say Arctic Ice is recovering, or that 2007 is a true change point. The same people were quick to jump on a declining period after 1996 as evidence of a “Death Spiral.”
Footnote:
No one knows what will happen to Arctic ice.
Except maybe the polar bears.
And they are not talking.
Except, of course, to the admen from Coca-Cola

via Science Matters
October 13, 2024 at 09:25AM
If carbon capture and storage (CCS) was fracking for gas, it would have been banned years ago. Both processes can cause earth tremors – equivalent to a man falling off a chair in the case of fracking, but potentially much greater with carbon capture. This is because it involves millions of tonnes of pressurised carbon dioxide being pumped into rock cavities possibly compromised by prior drilling holes. Waste water from pressurised oil and gas projects has been known to escape from degraded drill plugs causing geysers 100-foot high. Such a catastrophe on land with millions of tonnes of CO2 waiting to escape is not a good prospect. On August 21st, 1986 the sudden high pressure release of magmatic CO2 from the bed of Lake Nyos in Cameroon led to heavier-than-air CO2 suffocating all living beings in the surrounding villages including 1,746 people.
CCS divides a green movement riven with disagreements as its climate crisis grift starts to fall apart in the face of reality. Capturing CO2 and burying it in the ground has been described by one influential green think tank as a “colossal waste of money”. Wasting taxpayers’ money is not something most greens lose sleep over, but they dislike CCS because it allows a role, albeit limited, for future hydrocarbon use. As we recently reported in the Daily Sceptic, the penny has finally dropped in the U.K. that there is no backup to a 2030 renewable energy grid except gas, so the Mad Miliband has authorised a £22 billion CCS black hole. It is a colossal waste of money, but it provides a fig leaf to cover the continued use of hydrocarbons.
If governments in the United States and Europe are going to pump many billions of tonnes of pressurised gas into the substrata beneath our feet heavily pockmarked with thousands of filled drill holes, it might be a good idea to look into the wisdom and safety of this course of action. Such a task cannot be left to mainstream media, although they were quick to run stories of earthquakes and tap water catching fire in the cause of demonising gas fracking (yes really, check it out).
First some geology. Natural gas is found next to oil fields near the surface but it also accumulates at much deeper levels. It is held in place by a layer of sedimentary rock such as limestone or sandstone. In the U.S., the Permian basin runs across west Texas and south western New Mexico and its rich deposits have been drilled for over a hundred years. The area is riddled with hundreds of thousands of drill holes. Location records and safety checks on some of these holes are now non-existent.
In 2016, a group of Penn State researchers observed that when CO2 is stored underground in a process known as geological sequestration “it can find multiple escape pathways due to chemical reactions between CO2, water, rocks and cement from abandoned wells”. There are concerns that CO2 could leak into groundwater drinking aquifers or dissolve into saltwater deposits. As a result, the high acidity saltwater-CO2 can dissolve certain types of rocks as well as cement casing on abandoned wells. There are fears that a plume of CO2-saturated brine could break free to the surface, with presumably millions of tonnes of pressurised gas looking for a chance to follow.
Engineering professor Mary Kang of McGill University claims she has seen “countless instances” of plugged oil wells failing to hold. Cement is no match for earthquakes, heat and time, notes Eric Van Oort, an engineering professor at the University of Texas-Austin. “You have tectonic stresses, high temperatures – things are changing and shifting in the subsurface,” he said. He was of the view that plugged holes may start leaking in the future.
Current plans in the UK are to bury the CO2 under offshore waters. Hence some of the staggering costs involved. But nowhere is safe from the forces of nature and the British Geological Survey recently said that CCS needed to be “vigorously monitored” to provide an assurance of long-term storage integrity. That would be vigorously monitored for the thousands of years it is planned to keep the CO2 underground. Good luck with that one. Regulatory frameworks governing geological CO2 storage are being developed worldwide with issues of leakage and long-term stewardship being addressed. Again, good luck with asking future generations thousands of years hence to keep coughing up £22 billion (note to reader: feel free to invent your own very large figure at this point) to ensure vast quantities of highly pressurised gas are safely stored beneath the surface.
DeSmog was recently topped up with £400,000 from the Left-wing money tree Rowntree Foundation to continue promoting fracking scare stories and its notorious ‘blacklist’ of so-called climate deniers. On October 4th, it reported that a blowout in the Permian basin had created a 100-foot tower of oily water. Drilling and fracking uses millions of gallons of water a day in the area, noted DeSmog. “It’s a ripper,” said Hawk Dunlap, a libertarian candidate for the Railroad Commission. “It could be coming from anywhere and it’s not going to be an easy fix,” he said. DeSmog reports that Dunlap said the region where the geyser erupted has been plagued by earthquakes amid record wastewater production.
DeSmog is all in on the invented climate crisis and a fervent supporter of the political Net Zero fantasy. It obviously hates all hydrocarbon use and has reported on the problems of carbon capture. For its part, mainstream media just sticks with demonising fracking. Donkey nodding politicians in many jurisdictions accept the need for huge quantities of money to be poured down the CCS hole but are obviously uninformed about the risks involved.
Chris Morrison is the Daily Sceptic’s Environment Editor.
via Watts Up With That?
October 13, 2024 at 08:04AM

56.22082 -3.04261 Met Office assessed CIMO Class 4 Installed 1/9/2015…..Maybe
A poster on Notalotofpeopleknowthat advised me he would shortly be visiting Fife and asked if there were any weather station sites there I would like him to photograph for me. Delighted with the offer I researched the area and came up with the same sorry pattern I had noticed down in Kent of many closed good sites and very few, mostly poor, current ones. I also uncovered further evidence of odd record keeping of dates from the Met Office.
So first a review of Baintown and its “history.”……..

The google streetview image indicates a back garden site at the bottom of the carefully tended vegetable patch, half way up the hill known as “Bonnybank”. A sloping site in an agricultural landscape with no tamper proof screening is a world away from the security seen in many “municipal” sites. My initial thoughts were, why again was the Met Office still installing such rather “amateur” manual recording sites of such mediocre standards on 1st September 2015 as their archive shows. But then I noticed the above street view image date of MAY 2009. A further search of google earth pro indicates the site predates its claimed installation date by probably more than 10 years. It seems to be a genuine former amateur’s site that for some reason the Met Office has “adopted” into its climate reporting stations list. Quite a number of other Met Office sites have such questionable “opening” dates.
This oddity was not as peculiar as it may seem until I tried to locate other Fife stations.
There are just 3 – and Baintown is the highest ranked
The entire county has Baintown – CIMO Class 4, Auchtermuchty Rossie – Class 5 (manual and installed 1992) and the Leuchars automatic aviation site which is also Class 5. So where are, or should be, all the others?
Belliston opened 1949 closed in 2017. Braefoot Bay opened in 1986 closed in 2008. Cupar (Elmwood Agricultural College) opened 1973 closed in 2018. Cupar Sugar opened 1938 closed in 1972. Fifeness opened 1981 closed in 2007. St Andrews opened 1913 closed in 1984. Pitreavie No 2 opened 1959 closed in 1985. Glenrothes opened 1970 closed in 1978. Kirkcaldy opened 1950 closed in 1979. Could none of these places have retained a good site? Are students at Elmwood Agricultural College in Cupar unable or unwilling to learn about the highly relevant subject of the weather and continue to manage a weather station?
Nine fully operational sites in the 1970s have, over the intervening fifty years, resolved down to just a third of that number with low grade sites in such a military (Leuchars) and meteorologically important coastal county. Simultaneously in a narrow sector of West London of much smaller area there are currently 11 operating sites with many added in recent years. Could it be there are not a lot of opportunities for “record breaking” temperatures in Fife?
I again contend that the historic temperature record is being distorted by the selection process of recording sites as typically evidenced in Fife , Kent and elsewhere.
via Tallbloke’s Talkshop
October 13, 2024 at 04:56AM

