MEDIA ADVISORY: Hurricane Milton Historic, Not Unprecedented

Press Release from The Heartland Institute

It is wrong to blame human activity and ‘climate change’ for strength of hurricane

Storm of similar size and strength hit Tampa Bay area in 1848 and 1921 when human contributions to carbon dioxide in atmosphere was negligible

Even the United Nations’ Intergovernmental Panel on Climate Change (IPCC) says there’s no climate signal in tropical storms

ARLINGTON HEIGHTS, IL (October 8, 2024) – Hurricane Milton is on track Wednesday to be one of the biggest storms to ever hit the Tampa Bay, Florida area, and is one of the few Category 5 hurricanes on record in the satellite era (1966-onwards). It may join Hurricane Michael in 2018 as the only Category 5 hurricanes to form in the Gulf of Mexico in October and make landfall at that strength.

While the history of Gulf hurricanes growing this strong and making a direct hit on Tampa Bay shows this is a rare occurrence, it is not unprecedented and “climate change” driven by human emissions of carbon dioxide is not to blame.

Climate and environment experts at The Heartland Institute – James Taylor, Anthony Watts, H. Sterling Burnett, Linnea Lueken, and Steven Milloy – are available to the media to provide historical context for this storm.

They provide quotes below the following facts and perspective section of this release. To reach them for comment, please contact Vice President and Director of Communications Jim Lakely at media@heartland.org or call/text 312-731-9364.

FACT: Milton not without precedent

Storms of similar size and strength struck the Tampa Bay area in 1848 and 1921. And the National Oceanic and Atmospheric Administration has tracked at least 146 hurricanes that have formed in the Gulf since 1851.

Historical data show there has been little to no long-term trend since 1900 in Florida major hurricane activity through Hurricane Helene, which hit the panhandle last month.

People born in the 1950s or later did not experience the record-high hurricane activity of the 1940s, and the early 1900s activity was likely under-reported as virtually no one lived in Florida in 1900.

The following plot shows the intensity of major hurricanes (100 knots or greater maximum sustained wind speed) striking Florida since 1900, updated through Helene:

FACT: No trend in hurricane “intensification”

Many may claim that the rapid intensification of Milton is unprecedented. That is also false. As the chart below shows – based on a study in the journal Geophysical Research Letters – there is no significant upward trend in “rapid intensification” in hurricanes that form in the North Atlantic and Gulf of Mexico in the last 33 years.

FACT: No upward trend in hurricane activity

There is also no upward trend in global cyclone activity since 1980.

FACT: IPCC says no climate signal in tropical storms

Climate science itself says there is no connection between climate change and hurricane strength or frequency. In Table 12.12 on Page 90 – Chapter 12 of the UN Intergovernmental Panel on Climate Change (IPCC) Sixth Assessment Report (2023). Emergence of Climate Impact Drivers (CIDs) in time periods, shows no indication of a connection in the present, nor in the future.

The color in the table below corresponds to the confidence of the region with the highest confidence: white colors indicate where evidence of a climate change signal is lacking or the signal is not present, leading to overall low confidence of an emerging signal. Note the colors for Tropical Cyclones in the table screencap below:

The following statements may be used with attribution. For more information about historical trends, please visit The Heartland Institute’s Climate at a Glance website.

  • Florida, and especially the Tampa area, has been enjoying a golden age of hurricane avoidance.
  • The Tampa area is uniquely vulnerable to hurricane strikes and a major hurricane strike will likely be catastrophic, even apocalyptic. Scientists tell us it is remarkable that no major hurricanes have struck Tampa for more than a century, and Tampa has long been overdue for another major hurricane.
  • The fact that such a remarkable streak without a major hurricane strike may finally come to an end is not an indictment of climate change, but an illustration of how hurricanes are becoming rarer as the planet modestly warms.
  • Climate scammers will undoubtedly attempt to link Hurricane Milton to climate change. However, hurricane activity – affecting Florida and America as a whole – is less frequent and severe than was the case decades ago. Climate change may not make all hurricanes disappear, but hurricanes are becoming less frequent and severe as the planet modestly warms.
  • Meteorologists report that upper atmosphere wind shear will likely disrupt Hurricane Milton and reduce its power and speed before its Florida landfall. Scientists have long connected warmer global temperatures with stronger upper atmosphere wind shear inhibiting hurricane formation and strength. This is why warmer water temperatures have not “supercharged” hurricanes.
  • Florida recently underwent an 11-year period without a major hurricane strike (ending in 2017), which is by far the longest such period in recorded history.
  • Florida recently underwent a 10-year period without a single hurricane strike of any size (ending in 2016), which is by far the longest such period in recorded history.
  • From 2009 through 2017, the U.S. experienced fewer hurricane strikes than during any other time period in recorded history.
  • The United States recently underwent a record 11 years without a major hurricane strike of Category 3 or higher (2005-2017).

James Taylor
President
The Heartland Institute


“We, of course, don’t know at this stage how powerful Milton will be when it makes landfall or where precisely it will strike, but if it hits Tampa Bay as is forecast, it will cause massive destruction. If it does, however, neither the hurricane itself in terms of strength or speed of formation, the timing in the hurricane season, nor the location will be unprecedented as so many stories have claimed. Neither data, nor the IPCC’s most recent assessment, provide any support for the claim that climate change is causing a worsening of hurricanes.

“Rather, the damage Milton wreaks in Tampa Bay, or wherever it ultimately makes landfall, will be the only unprecedented thing about it and that is not due to changed climate conditions but rather changed demographics. There is simply more people, property, and infrastructure in and around Tampa Bay than there was when similar hurricanes made a direct strike on the city in 1921 and 1848 – 103 and 176 years of global warming ago respectively.

“In 1921, Tampa Bay’s population was 135,000. Now it sits at more than three million. Hopefully, most people will heed the early warnings afforded by available technology and get out of harm’s way so fatalities, if any, will be low. But you can’t move homes and infrastructure, so the damage will be quite high – not due to the changing nature of hurricane, but to the expanding bulls-eye effect: more people and stuff in harm’s way means more damage.

“I pray wind shear knocks it down and/or it strikes a less inhabited area of the nation.”

H. Sterling Burnett, Ph.D.
Director, Arthur B. Robinson Center on Climate & Environmental Policy
The Heartland Institute
Managing Editor, Environment & Climate News


“While many in the media have been painting Hurricane Milton as ‘unprecedented’ with it being ‘juiced’ by climate change, a review of the factual record and scientific literature say otherwise. Tampa Bay has experienced major hurricanes in 1848 and in 1921, well before climate change was ever conceived.

“Further, the Intergovernmental Panel on Climate Change (IPCC) in their most recent report showed clearly, they found no signature of climate change affecting hurricanes in any way. Milton’s 897mb lowest pressure isn’t even unprecedented, being the fifth lowest on record. While Milton remains dangerous, the attempt to paint it as a monster driven by climate change just doesn’t hold up under scrutiny and is unhelpful to those affected.”

Anthony Watts

Senior Fellow

The Heartland Institute


“Undoubtedly the focus of the media after Hurricane Milton will be on the climate change angle, despite the facts, and rapid-attribution con ‘studies’ will quickly come out to support the media narrative. It is a shame that instead of focusing on things that would actually help decrease the impact of natural hurricanes – such as storm resilient infrastructure and dispatchable power – the media will almost certainly promote fake news in order to generate even more fear and confusion.

“In the past, Florida’s government (especially recently) has been pretty good about responding to these disasters quickly and staying focused on helping people rather than wasting time playing the climate change card and shifting responsibility onto the people for daring to demand stable and affordable power. Let us hope this trend continues.”

Linnea Lueken Research Fellow
Arthur B. Robinson Center on Climate and Environmental Policy
The Heartland Institute


“The Tampa Bay area has been hit by mega-hurricanes at least twice before (1848 and 1921), there is no trend in hurricanes hitting Florida, no aspect of hurricanes is outside the range of natural variability, and it’s impossible for emissions to affect hurricanes in the first place since emissions physically can’t warm the oceans. Blaming hurricanes on emissions is an absolutely bankrupt claim.”

Steven Milloy Senior Policy Fellow, E&E Legal
Policy Advisor, The Heartland Institute


The Heartland Institute is a national nonprofit organization founded in 1984 and headquartered in Arlington Heights, Illinois. Its mission is to discover, develop, and promote free-market solutions to social and economic problems. For more information, visit our website

via Watts Up With That?

https://ift.tt/xnS5HF4

October 8, 2024 at 04:06PM

Hellfire, brimstone and societal collapse coming at 6pm, say the “experts”

Humanities Future in Balance say paid hacks from captive universities.By Jo Nova

With four weeks to go ’til D-Day for the parasitic blob (the US Election), the headlines today are biblical hellfire with photos. Earth’s vital signs have hit record extremes they tell us. In all the years we’ve been recording things, which is practically nothing, storms, floods, droughts and the mental health of jellyfish have never been worse, which is obviously why food crops are higher than ever before, the Earth is greening and more humans are alive than have ever existed.

Like soothsayers with chicken entrails, captive scientists are squawking disaster like their funding depends on it:

by Damien Carrington, The Guardian

“We’re already in the midst of abrupt climate upheaval, which jeopardises life on Earth like nothing humans have ever seen,” said Prof William Ripple, of Oregon State University (OSU), who co-led the group. “Ecological overshoot – taking more than the Earth can safely give – has pushed the planet into climatic conditions more threatening than anything witnessed even by our prehistoric relatives.

It’s “like nothing humans have ever seen” says Prof Ripple, who has forgotten the Eemian, the ice ages, the Toba supervolcano, countless asteroids, and the Black Plague.

We’re panicking about a couple of degrees of warming, but cavemen had it hotter and colder, and for 150,000 years their air conditioners didn’t work.

It’s like the modern “scientists” are trying to erase all of prehistory

What we’re dealing with is nothing like what humans have already suffered through.  Humans saw the seas rise by 125 meters (twice) — children used to play on the continental shelf until all their beaches disappeared, their homes washed away, and their favourite reefs were destroyed. Humans saw ice caps a mile thick roll over Manhattan and humans saw the wall of ice melt away too.

Things were so bad, at some point humans waved good-bye to an entire species of hominid which had brains bigger than our own, and the vast forests of the Sahara desert turned to dust, the fish died, the rivers stopped flowing and the communities that existed for thousands of years were wiped out.

Nothing we’re dealing with today is remotely as bad as what humans have already dealt with.

Every kind of disaster will hit “Billions of people”:

The hyperbole knows no bounds. The “millions of climate refugees” that didn’t happen, are now “billions”.

No disaster is off limits to the Scare-fairies:

“Climate change has already displaced millions of people, with the potential to displace hundreds of millions or even billions. That would likely lead to greater geopolitical instability, possibly even partial societal collapse.”

Human Suffering in Pictures

Every bad thing under the sun is caused by climate change. That’s how we know it isn’t science.

The climate is doing just fine, but the The State of Climate Science is a tragedy.


REFERENCE (if you can call it that)

William Ripple, et al including Michael Mann and Naoimi Oreskes (2024) The 2024 state of the climate report: Perilous times on planet Earth, BioScience, biae087, https://doi.org/10.1093/biosci/biae087


10 out of 10 based on 1 rating

via JoNova

https://ift.tt/PlY8KFk

October 8, 2024 at 03:58PM

UAH September 2024: NH Land Up, SH Land Down

The post below updates the UAH record of air temperatures over land and ocean. Each month and year exposes again the growing disconnect between the real world and the Zero Carbon zealots.  It is as though the anti-hydrocarbon band wagon hopes to drown out the data contradicting their justification for the Great Energy Transition.  Yes, there has been warming from an El Nino buildup coincidental with North Atlantic warming, but no basis to blame it on CO2.  

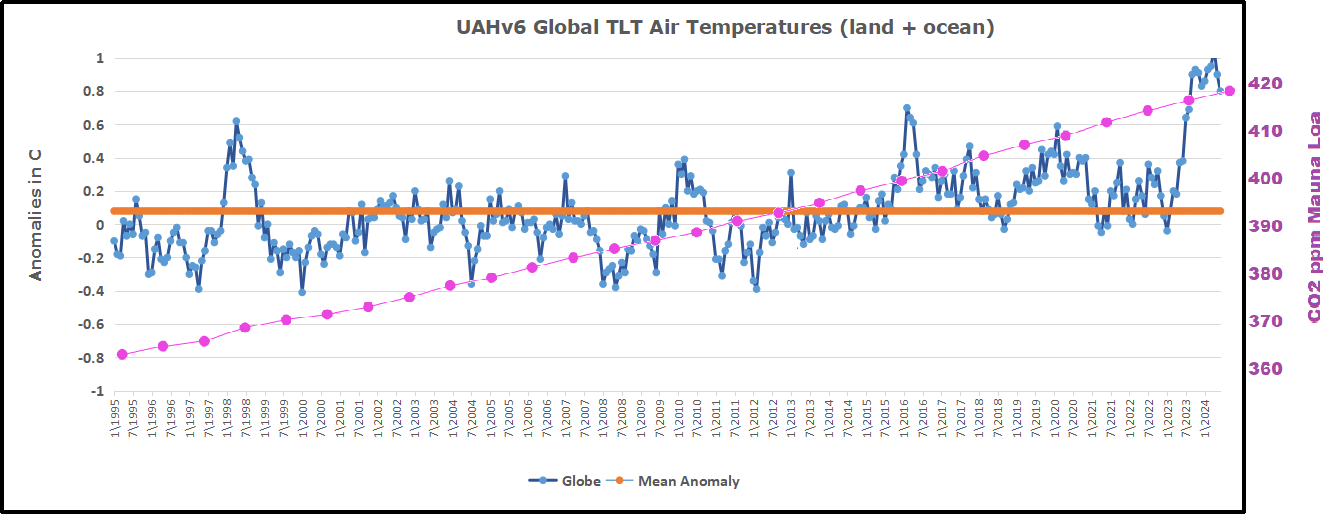
As an overview consider how recent rapid cooling  completely overcame the warming from the last 3 El Ninos (1998, 2010 and 2016).  The UAH record shows that the effects of the last one were gone as of April 2021, again in November 2021, and in February and June 2022  At year end 2022 and continuing into 2023 global temp anomaly matched or went lower than average since 1995, an ENSO neutral year. (UAH baseline is now 1991-2020). Now we have an usual El Nino warming spike of uncertain cause, unrelated to steadily rising CO2 and now moderating.

For reference I added an overlay of CO2 annual concentrations as measured at Mauna Loa.  While temperatures fluctuated up and down ending flat, CO2 went up steadily by ~60 ppm, a 15% increase.

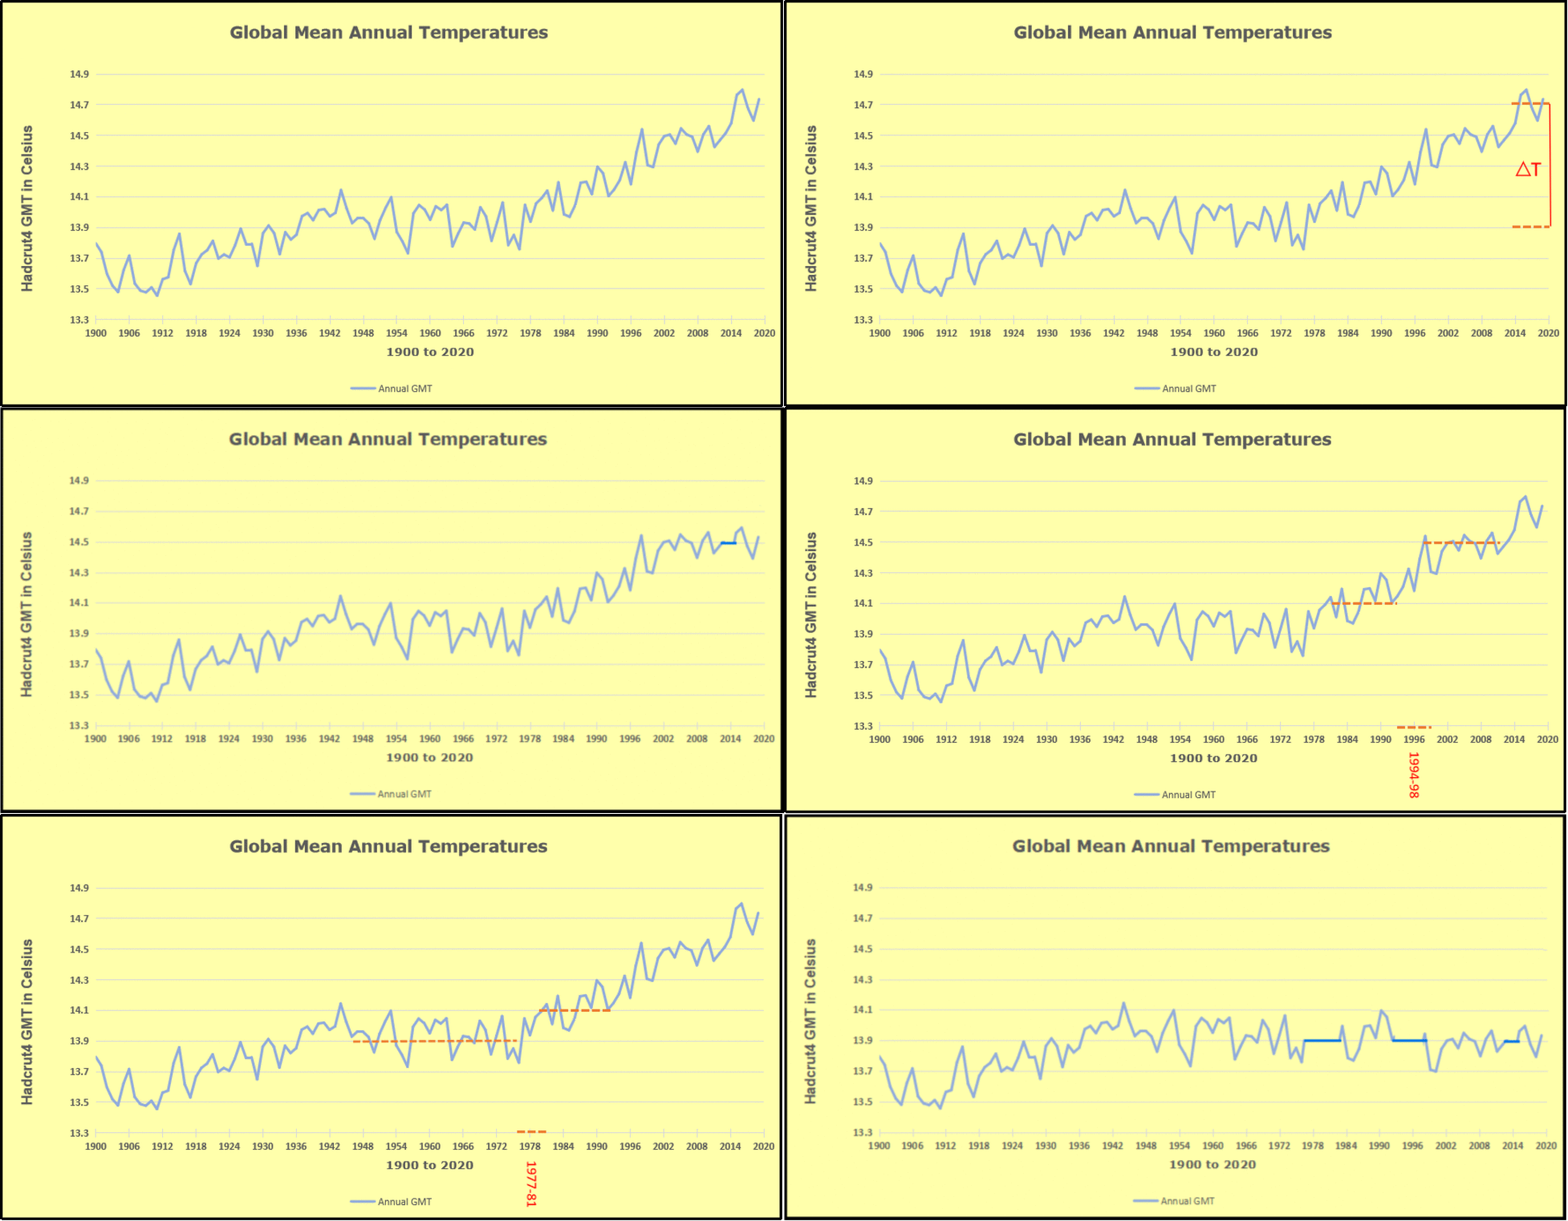
Furthermore, going back to previous warmings prior to the satellite record shows that the entire rise of 0.8C since 1947 is due to oceanic, not human activity.

gmt-warming-events

The animation is an update of a previous analysis from Dr. Murry Salby.  These graphs use Hadcrut4 and include the 2016 El Nino warming event.  The exhibit shows since 1947 GMT warmed by 0.8 C, from 13.9 to 14.7, as estimated by Hadcrut4.  This resulted from three natural warming events involving ocean cycles. The most recent rise 2013-16 lifted temperatures by 0.2C.  Previously the 1997-98 El Nino produced a plateau increase of 0.4C.  Before that, a rise from 1977-81 added 0.2C to start the warming since 1947.

Importantly, the theory of human-caused global warming asserts that increasing CO2 in the atmosphere changes the baseline and causes systemic warming in our climate.  On the contrary, all of the warming since 1947 was episodic, coming from three brief events associated with oceanic cycles. And now in 2024 we have seen an amazing episode with a temperature spike driven by ocean air warming in all regions, along with rising NH land temperatures, now oscillating near its peak.

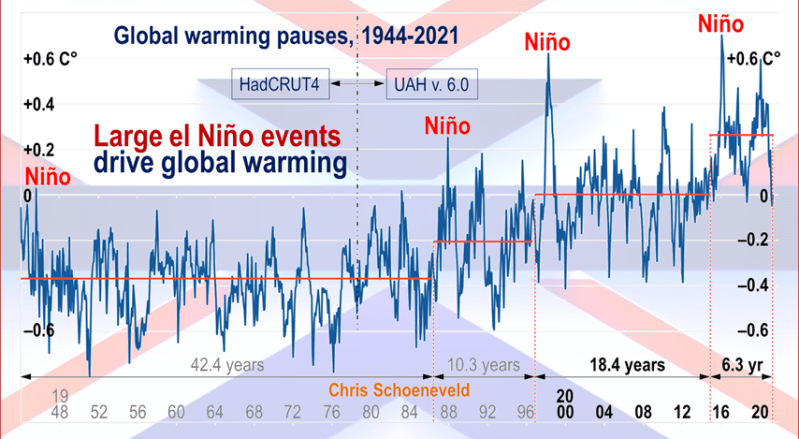
Chris Schoeneveld has produced a similar graph to the animation above, with a temperature series combining HadCRUT4 and UAH6. H/T WUWT

image-8


mc_wh_gas_web20210423124932

See Also Worst Threat: Greenhouse Gas or Quiet Sun?

September 2024 NH Land Spike Warms More than SH Land Drops

 banner-blog

With apologies to Paul Revere, this post is on the lookout for cooler weather with an eye on both the Land and the Sea.  While you heard a lot about 2020-21 temperatures matching 2016 as the highest ever, that spin ignores how fast the cooling set in.  The UAH data analyzed below shows that warming from the last El Nino had fully dissipated with chilly temperatures in all regions. After a warming blip in 2022, land and ocean temps dropped again with 2023 starting below the mean since 1995.  Spring and Summer 2023 saw a series of warmings, continuing into October, followed by cooling. 

UAH has updated their tlt (temperatures in lower troposphere) dataset for September 2024. Posts on their reading of ocean air temps this month are ahead of the update from HadSST4.  I posted last month on SSTs using NH Pulls Oceans Warmer August 2024.  These posts have a separate graph of land air temps because the comparisons and contrasts are interesting as we contemplate possible cooling in coming months and years.

Sometimes air temps over land diverge from ocean air changes. In July 2024 all oceans were unchanged except for Tropical warming, while all land regions rose slightly. Then in August we saw a warming leap in SH land, slight Land cooling elsewhere, a dip in Tropical Ocean temp and slightly elsewhere. Now in September a dramatic drop in SH land, overcome by a greater NH land increase. End result is an upward bump in Global anomaly.

Note:  UAH has shifted their baseline from 1981-2010 to 1991-2020 beginning with January 2021.  In the charts below, the trends and fluctuations remain the same but the anomaly values changed with the baseline reference shift.

Presently sea surface temperatures (SST) are the best available indicator of heat content gained or lost from earth’s climate system.  Enthalpy is the thermodynamic term for total heat content in a system, and humidity differences in air parcels affect enthalpy.  Measuring water temperature directly avoids distorted impressions from air measurements.  In addition, ocean covers 71% of the planet surface and thus dominates surface temperature estimates.  Eventually we will likely have reliable means of recording water temperatures at depth.

Recently, Dr. Ole Humlum reported from his research that air temperatures lag 2-3 months behind changes in SST.  Thus cooling oceans portend cooling land air temperatures to follow.  He also observed that changes in CO2 atmospheric concentrations lag behind SST by 11-12 months.  This latter point is addressed in a previous post Who to Blame for Rising CO2?

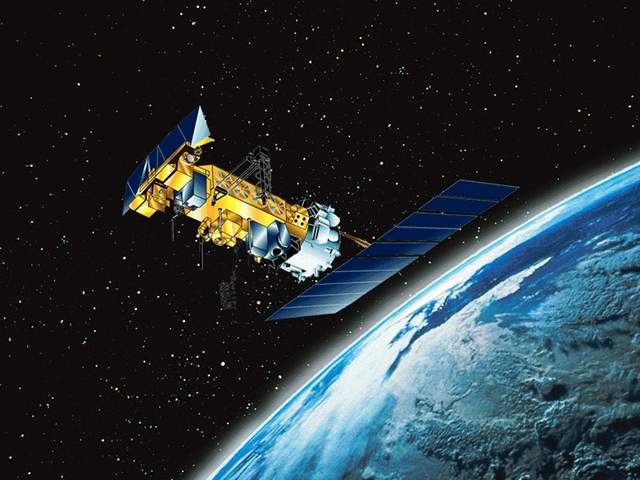
After a change in priorities, updates are now exclusive to HadSST4.  For comparison we can also look at lower troposphere temperatures (TLT) from UAHv6 which are now posted for September.  The temperature record is derived from microwave sounding units (MSU) on board satellites like the one pictured above. Recently there was a change in UAH processing of satellite drift corrections, including dropping one platform which can no longer be corrected. The graphs below are taken from the revised and current dataset.

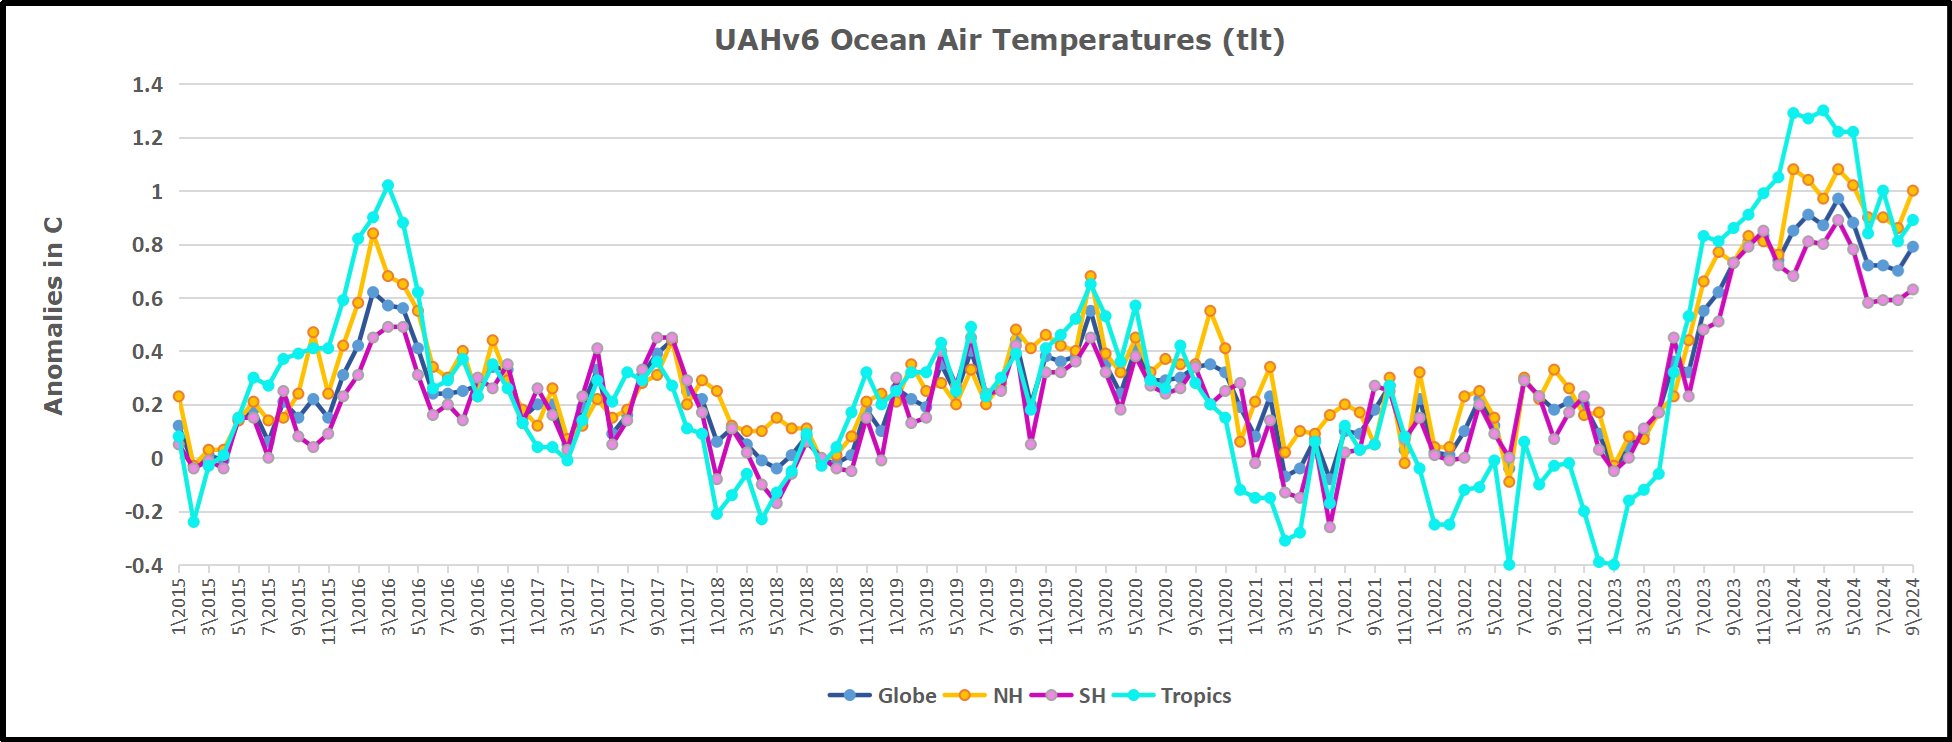
The UAH dataset includes temperature results for air above the oceans, and thus should be most comparable to the SSTs. There is the additional feature that ocean air temps avoid Urban Heat Islands (UHI).  The graph below shows monthly anomalies for ocean air temps since January 2015.

Note 2020 was warmed mainly by a spike in February in all regions, and secondarily by an October spike in NH alone. In 2021, SH and the Tropics both pulled the Global anomaly down to a new low in April. Then SH and Tropics upward spikes, along with NH warming brought Global temps to a peak in October.  That warmth was gone as November 2021 ocean temps plummeted everywhere. After an upward bump 01/2022 temps reversed and plunged downward in June.  After an upward spike in July, ocean air everywhere cooled in August and also in September.   

After sharp cooling everywhere in January 2023, all regions were into negative territory. Then there is a remarkable spiking of Tropical ocean temps from -0.4 up to + 1.3 in January 2024.  The rise was matched by other regions in 2024 January through May, before dropping lower. Now in September comes an upward bump in NH and Tropics pulling up Global anomaly.

Land Air Temperatures Tracking in Seesaw Pattern

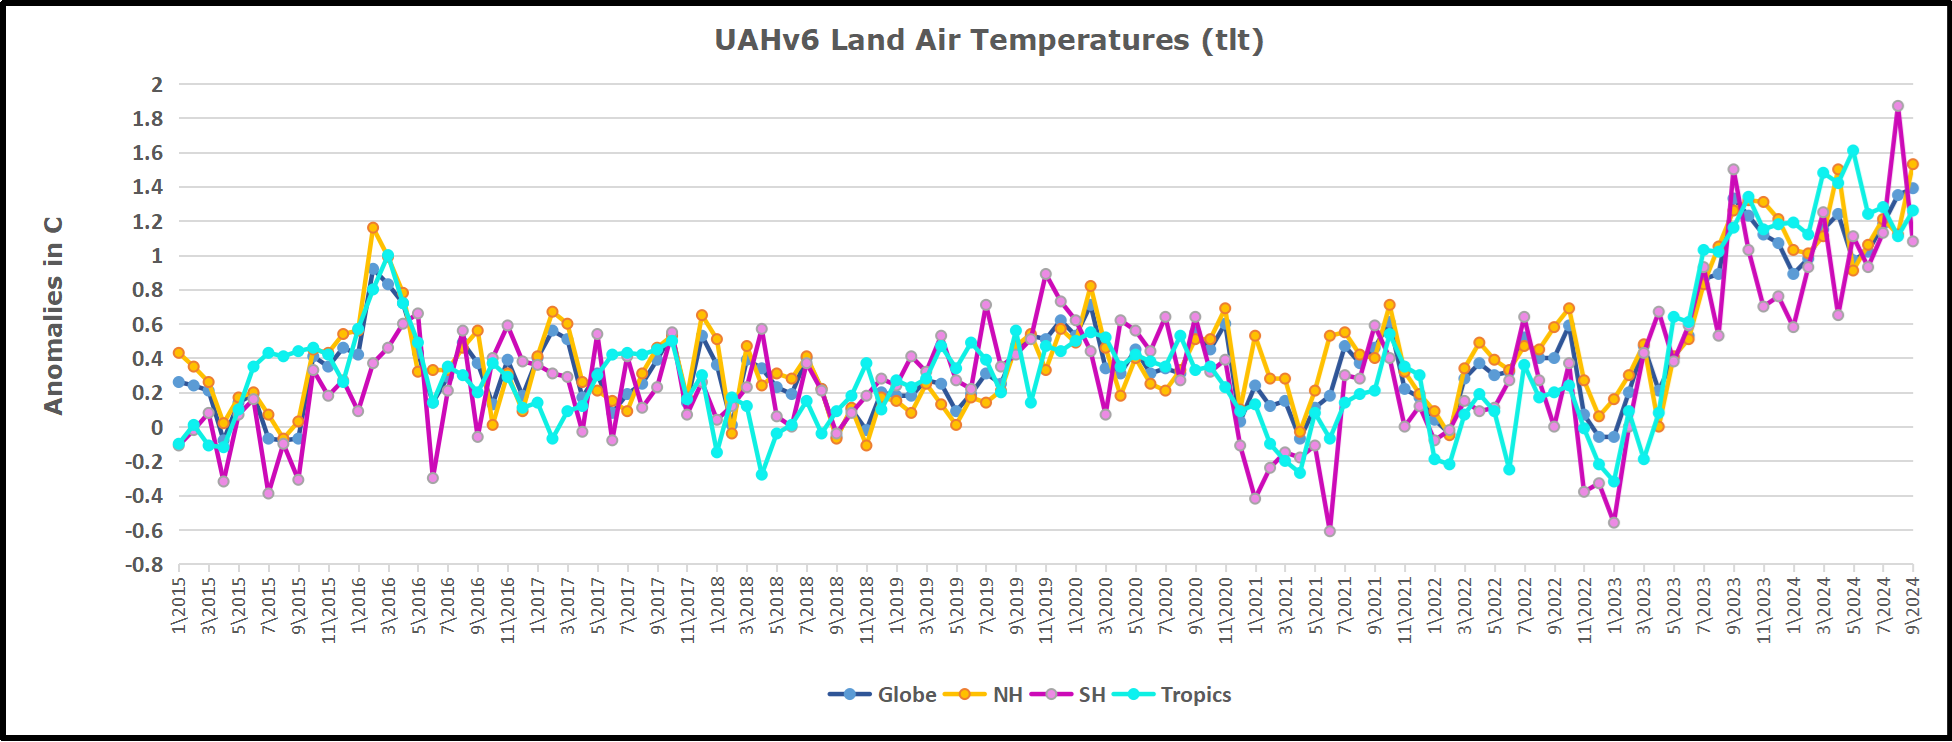
We sometimes overlook that in climate temperature records, while the oceans are measured directly with SSTs, land temps are measured only indirectly.  The land temperature records at surface stations sample air temps at 2 meters above ground.  UAH gives tlt anomalies for air over land separately from ocean air temps.  The graph updated for September is below.


Here we have fresh evidence of the greater volatility of the Land temperatures, along with extraordinary departures by SH land.  Land temps are dominated by NH with a 2021 spike in January,  then dropping before rising in the summer to peak in October 2021. As with the ocean air temps, all that was erased in November with a sharp cooling everywhere.  After a summer 2022 NH spike, land temps dropped everywhere, and in January, further cooling in SH and Tropics offset by an uptick in NH. 

Remarkably, in 2023, SH land air anomaly shot up 2.1C, from  -0.6C in January to +1.5 in September, then dropped sharply to 0.6 in January 2024, matching the SH peak in 2016. Then through May 2024 NH and Tropical land temps spiked to new highs, before dropping down.  Now in August SH land spiked up, then reversed down in September.  NH and Tropics bumped upward, and Global land anomaly rose slightly

The Bigger Picture UAH Global Since 1980

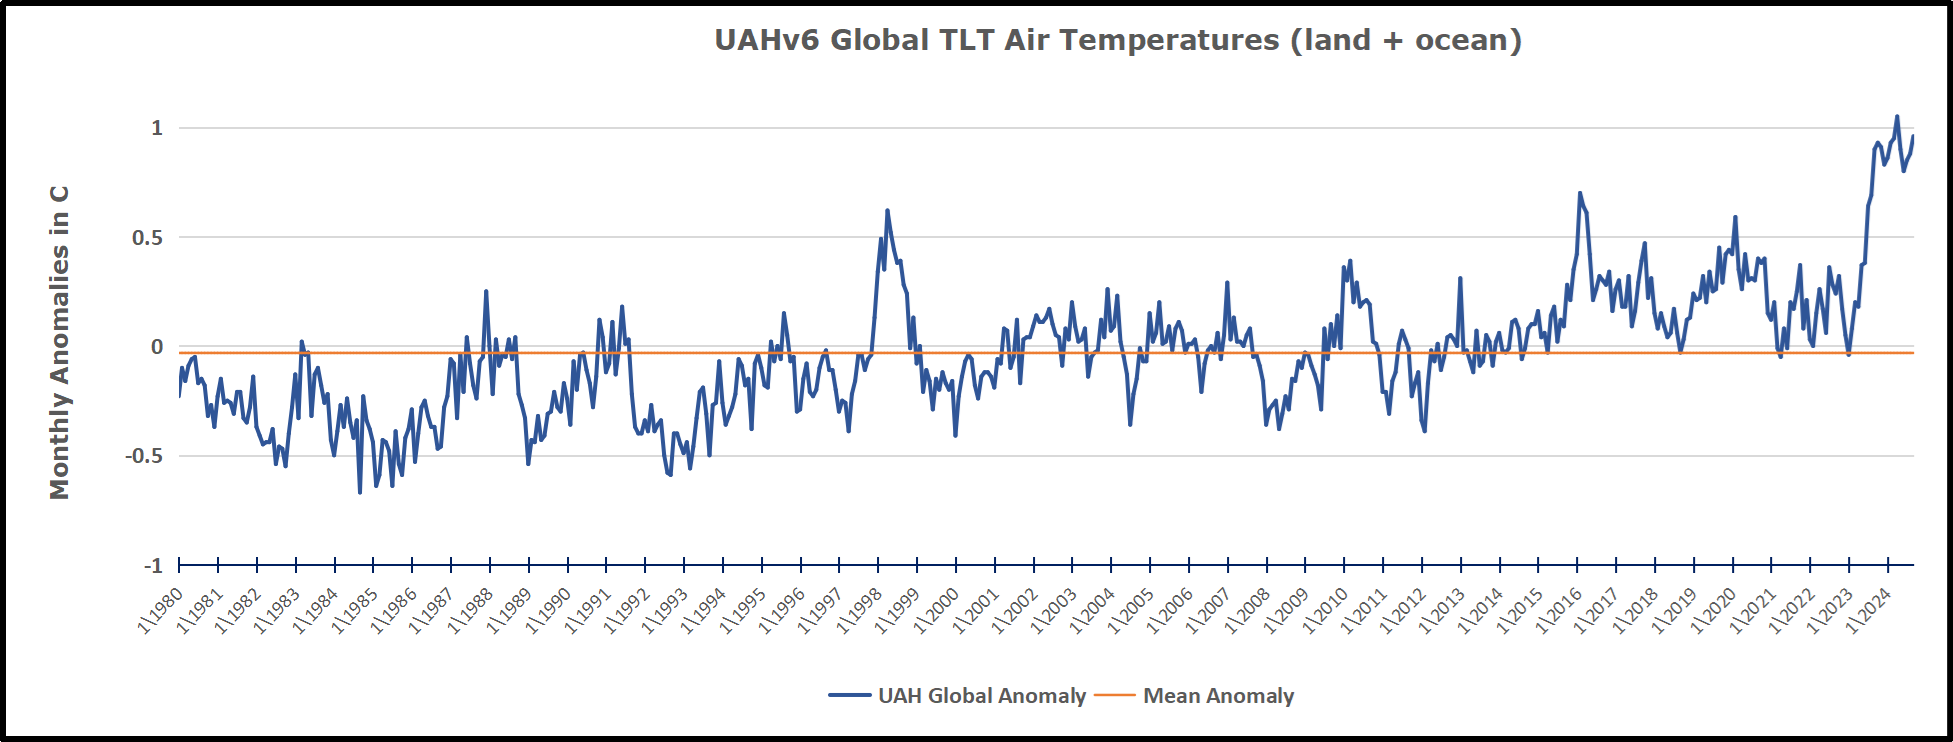
The chart shows monthly Global anomalies starting 01/1980 to present.  The average monthly anomaly is -0.04, for this period of more than four decades.  The graph shows the 1998 El Nino after which the mean resumed, and again after the smaller 2010 event. The 2016 El Nino matched 1998 peak and in addition NH after effects lasted longer, followed by the NH warming 2019-20.   An upward bump in 2021 was reversed with temps having returned close to the mean as of 2/2022.  March and April brought warmer Global temps, later reversed

With the sharp drops in Nov., Dec. and January 2023 temps, there was no increase over 1980. Then in 2023 the buildup to the October/November peak exceeded the sharp April peak of the El Nino 1998 event. It also surpassed the February peak in 2016. In 2024 March and April took the Global anomaly to a new peak of 1.05C.  The cool down started with May dropping to 0.90C, and in June a further decline to 0.80C.  The warming level rose again and has persisted through September.

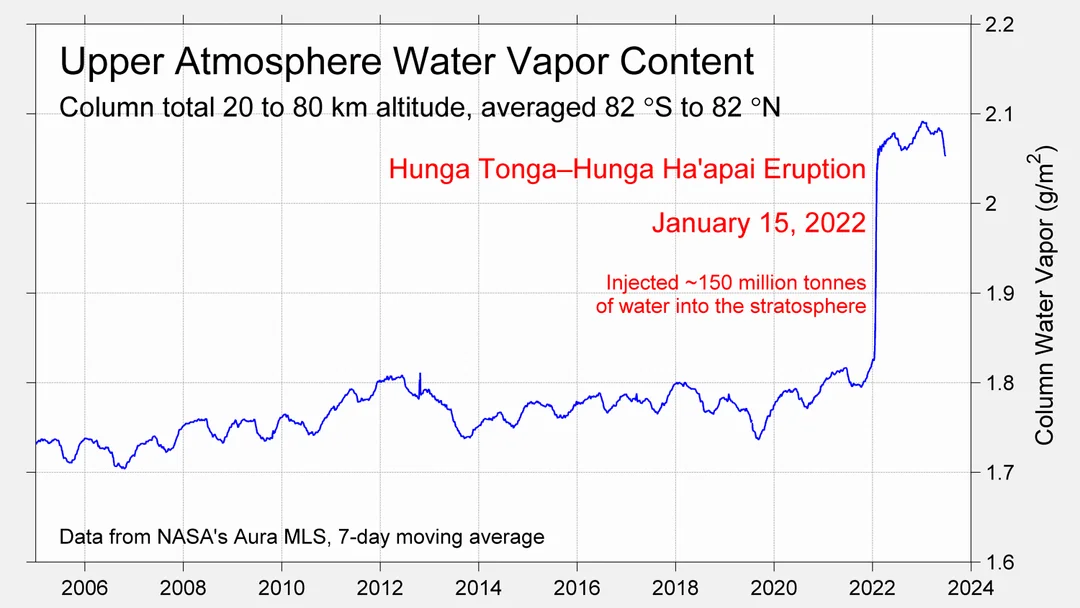
The graph reminds of another chart showing the abrupt ejection of humid air from Hunga Tonga eruption.

TLTs include mixing above the oceans and probably some influence from nearby more volatile land temps.  Clearly NH and Global land temps have been dropping in a seesaw pattern, nearly 1C lower than the 2016 peak.  Since the ocean has 1000 times the heat capacity as the atmosphere, that cooling is a significant driving force.  TLT measures started the recent cooling later than SSTs from HadSST4, but are now showing the same pattern. Despite the three El Ninos, their warming had not persisted prior to 2023, and without them it would probably have cooled since 1995.  Of course, the future has not yet been written.


via Science Matters

https://ift.tt/oWqzOdb

October 8, 2024 at 03:04PM

Meet the 108-Year-Old 1916 Major Hurricane that Brought 8 Feet of Flood Water to Asheville, NC & Covered All of Biltmore 

Guest essay by Larry Hamlin

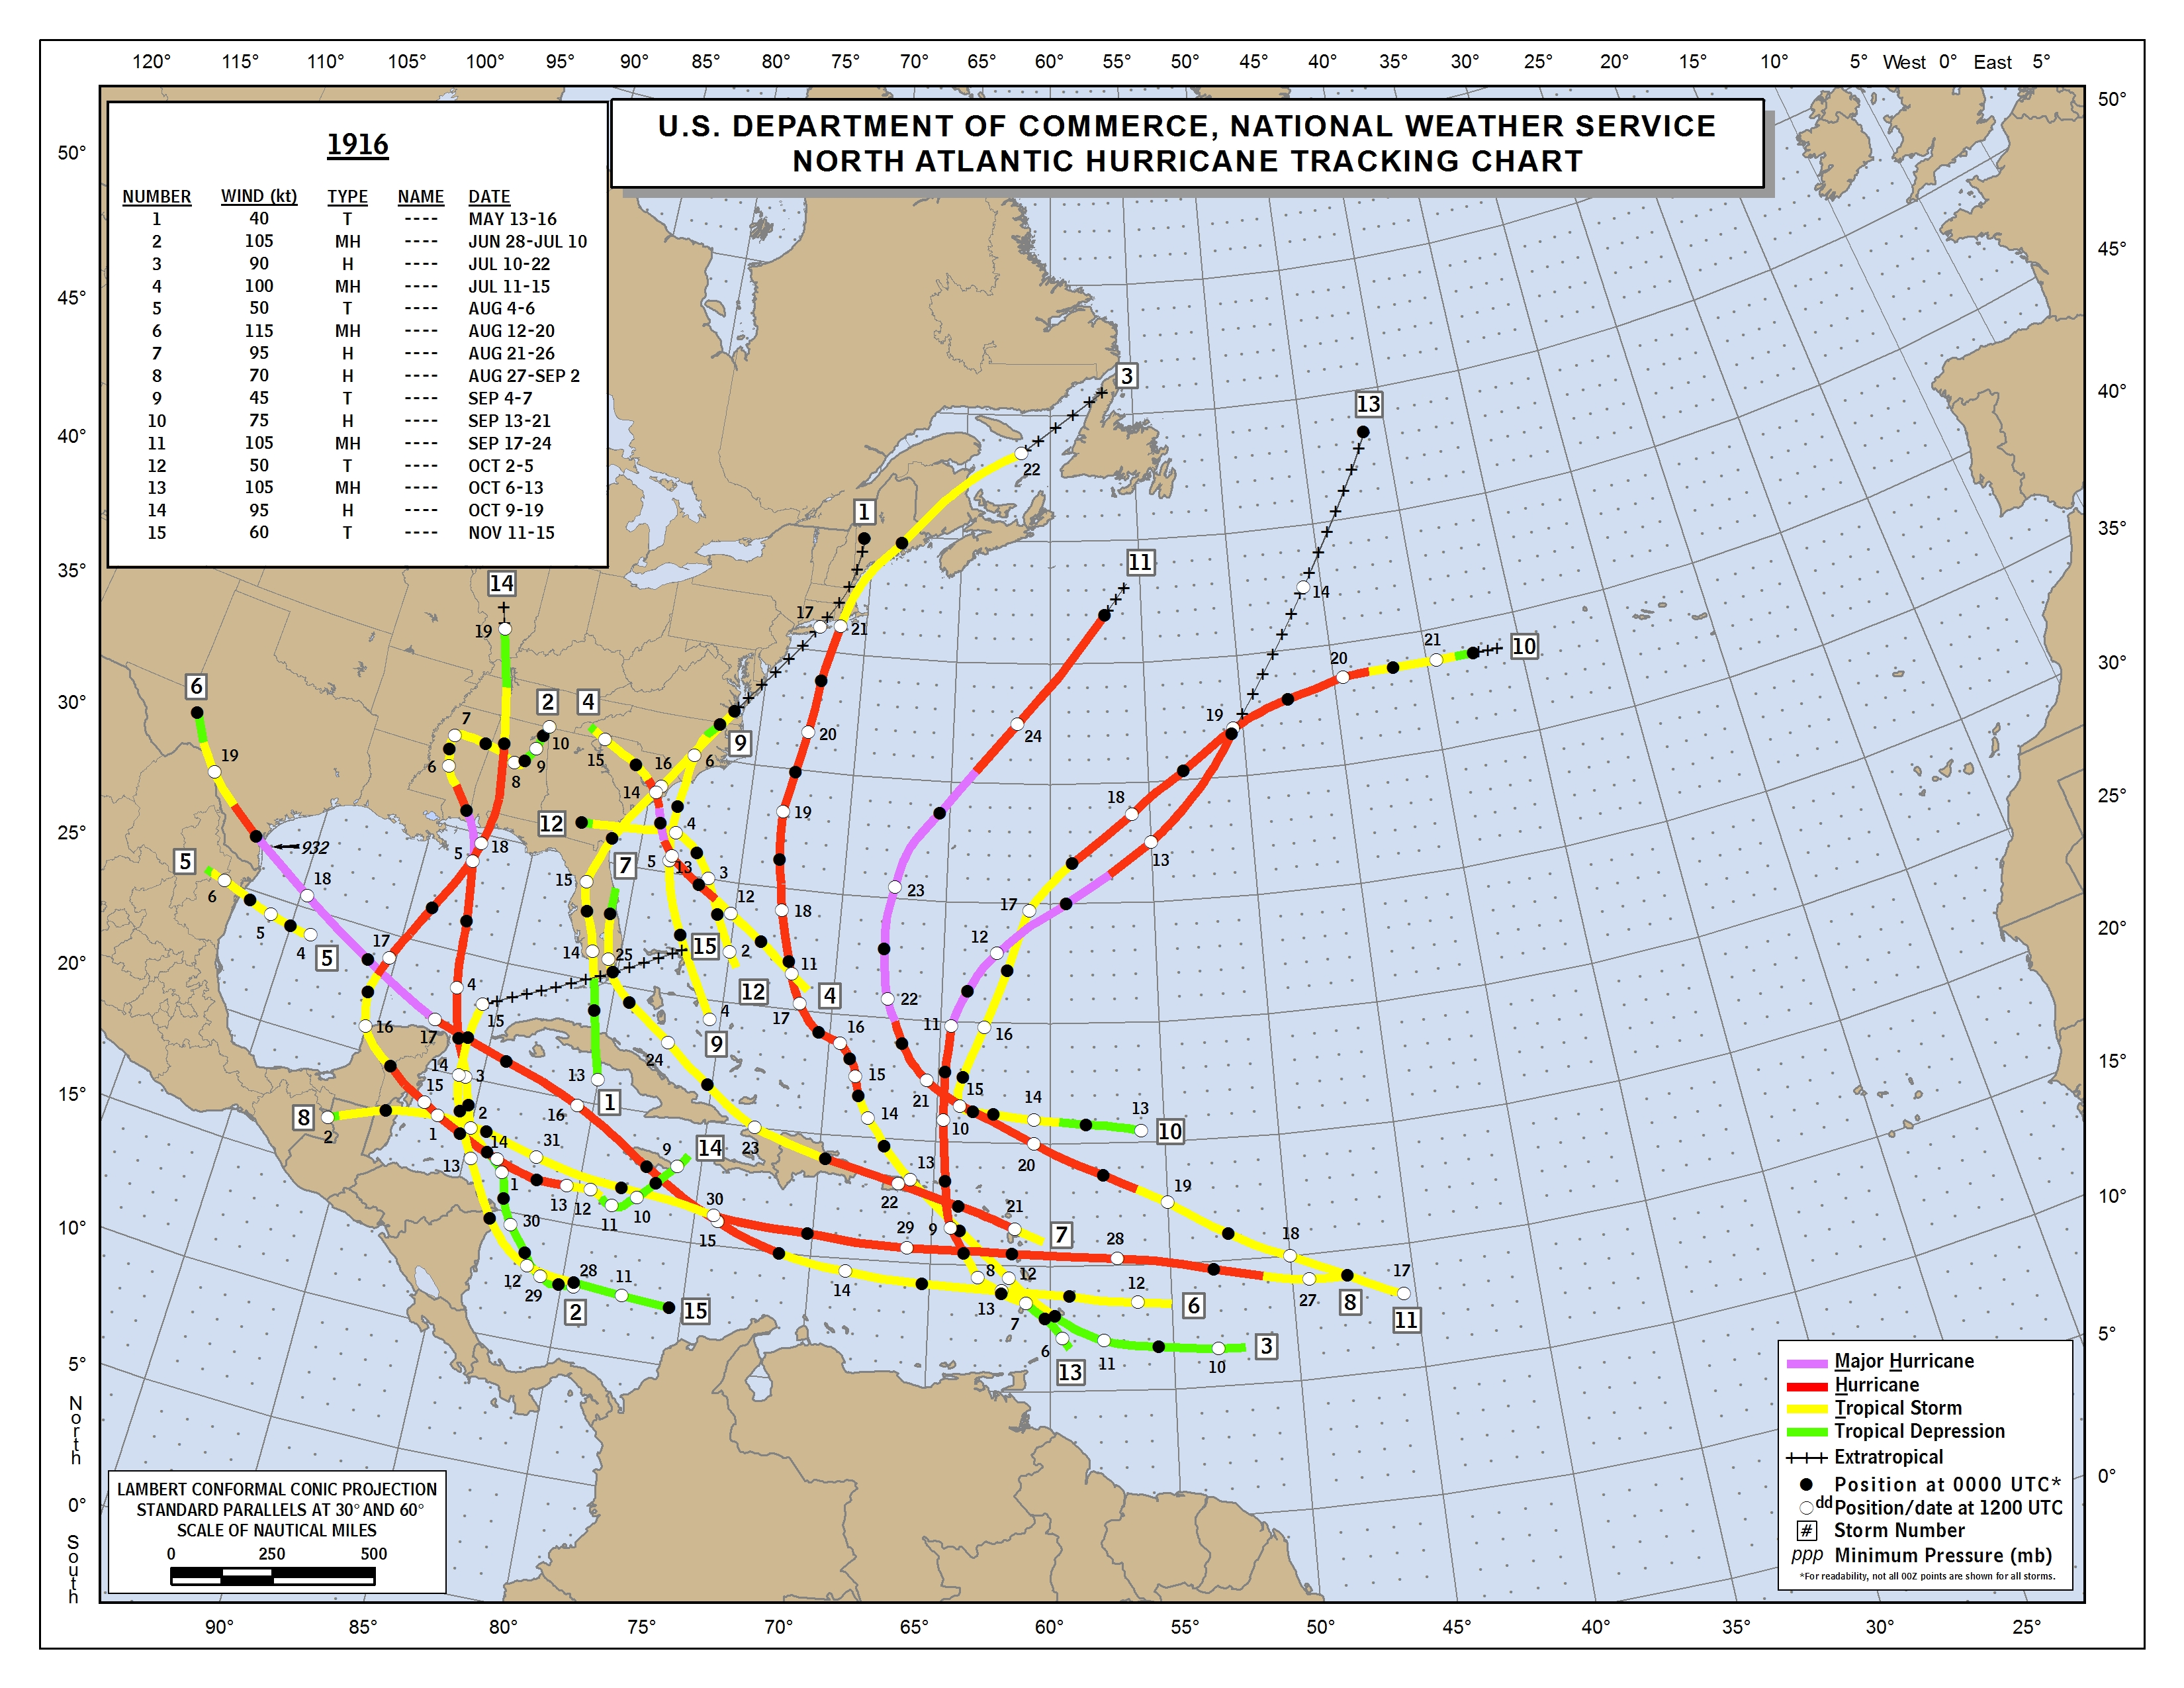
With all the climate alarmist hype about Hurricane Helene (and yet more coming with Milton) it seems appropriate to introduced everyone to the Year 1916 Major Hurricane Number 4 that preceded the year 2024 Hurricane Helene visit to Asheville with the headlines shown below and discussed in the WUWT article here.

NOAA’s 1916 Atlantic Hurricane season outcome data is presented below and found here.

The 1916 Major Hurricane Asheville culprit is Number 4 on the list at a time when names were not given to hurricanes and there were no satellites, hurricane hunter aircraft or long-range weather radar systems available to identify and track storms.  

There were 15 numbered Atlantic storms in 1916 even though there easily could have been many more that were never observed during this season because of observation inadequacies compared to today’s available technology.

The Map below is expanded to better show the origin and path of Major Hurricane Number 4 which starts in about the middle of the Map with a square with the number 4 identifying this event.

Major Hurricane Number 4 moves onto the coastline of South Carolina and then finishes by moving into North Carolina and Tennessee as it moved rapidly over the period July 11 to July 15 and ended as a tropical storm and depression in the Asheville area.

Colorado State University’s comprehensive Northern Hemisphere Tropical Cyclone Activity data identify the following pertinent information regarding the 1916 Atlantic hurricane year metrics using their extensive basin archives data base information.

The 1916 Atlantic season had 10 hurricanes as shown below compared to 9 hurricanes so far in this year’s 2024 season.  

The 1916 Atlantic season had 5 major hurricanes as shown below compared to 4 major hurricanes (including Milton) so far in this year’s 2024 season.

The 1916 Atlantic season had a total ACE component of 144 as shown below compared to the 2024 season total 115.6 as of October 7, 2024.

The Atlantic Season 30-year ACE average (1991 – 2020) is at a value of 122.5 so the year 1916 was an above average ACE hurricane year.

In 1916 3 major hurricanes crossed into the contiguous U.S. land region with 2 additional other hurricanes making land strikes as well thus totaling 5 inland hurricane strikes in all.

In 1916 the deepest land strike into the U.S. was Hurricane Number 14 which came up from the Gulf of Mexico and reached into and across the states of Florida, Alabama, Tennessee, Kentucky and ended in Illinois as shown on the map.

Apparently the “hurricanes” of 1916 did not know that future “climate change” was needed to allow hurricanes to reach that high into the U.S.   

If politically driven climate alarmist propagandists had been around 108 years ago it seems certain that the year 1916 outcomes would also have been characterized as being a clear “sign” that hurricanes are getting worse because of “climate change”.         

via Watts Up With That?

https://ift.tt/6TEbPVm

October 8, 2024 at 01:40PM