Mission to Jupiter’s icy moon, Europa, begins on October 10th…amazing work by Galileo 400+ years ago on the largest planet in our solar system and its moons

Overview

Galileo turned his primitive telescope towards Jupiter in the early 1600’s and saw tiny specks of light with no discernable features. What a difference 400+ years can make as today’s backyard telescopes can resolve Europa’s disk surprisingly well. Europa is now considered one of the most complex and fascinating worlds in the solar system. Cracks, ridges, and chaotic terrain on the moon’s icy crust may offer access to one of the largest oceans in the solar system–and a possible abode for aquatic life. NASA’s Europa Clipper spacecraft, due to launch one week from now on October 10th, will conduct a detailed reconnaissance of the moon’s surface to help plan future missions including a lander and perhaps even a submarine. Europa Clipper’s main science goal is to determine whether there are places below the surface of Europa that could support life.

Discussion on Europa and the mission

Europa is a world that shows strong evidence for an ocean of liquid water beneath its icy crust which could very well host conditions favorable for life. NASA will place a highly capable, radiation-tolerant spacecraft named “Clipper” into a long, looping orbit around Jupiter to perform repeated flybys of the icy moon. In fact, the plan is to have 49 flybys of Europa at closest approach altitudes as low as 16 miles, soaring over a different location during each to scan nearly the entire moon. With its massive solar arrays and radar antennas, Europa Clipper will be the largest spacecraft NASA has ever developed for a planetary mission. The spacecraft needs large solar arrays to collect enough light for its power needs as it operates in the Jupiter system, which is more than five times as far from the Sun as Earth. The spacecraft will be about 16 feet (5 meters) in height. With its arrays deployed, the spacecraft spans more than 100 feet and has a dry mass (no propellant in the tanks) of 7,145 pounds. The launch date for this spacecraft is currently set for Thursday, October 10th with arrival at Jupiter in April 2030.

Credit: NASA/JPL-Caltech

Because Europa is bathed in radiation trapped in Jupiter’s magnetic field, Europa Clipper’s payload and other electronics will be enclosed in a thick-walled vault. This strategy of armoring up to go to Jupiter with a radiation vault was developed and successfully used for the first time by NASA’s Juno spacecraft. The vault walls – made of titanium and aluminum – will act as a radiation shield against most of the high-energy atomic particles, dramatically slowing down degradation of the spacecraft’s electronics.

For Europa to be habitable, it needs the essential building blocks for life including carbon, hydrogen, oxygen, and sulfur. Liquid water is essential for the complex chemistry that makes life on Earth possible. Many scientists predict a salty ocean lies beneath the surface of Europa which has more water than all of Earth’s oceans combined. While the icy moon of Jupiter is far from the sun, Europa gets the energy to sustain life from Jupiter’s strong gravity which creates tides that stretch and tug the moon producing heat. One of the most important measurements by the Galileo mission which previously explored Europa showed how Jupiter’s magnetic field was disrupted in the space around Europa. The measurement strongly implied that a special type of magnetic field is created (induced) within Europa by a deep layer of some electrically conductive fluid (like saltwater) beneath the surface, which interacts with Jupiter’s strong magnetic field.

The amazing work of Galileo

Peering through his newly-improved 20-power homemade telescope at the planet Jupiter on Jan. 7, 1610, Italian astronomer Galileo Galilei noticed three other points of light near the planet, at first believing them to be distant stars. Observing them over several nights, he noted that they appeared to move in the wrong direction with regard to the background stars and they remained in Jupiter’s proximity but changed their positions relative to one another. He later observed a fourth star near the planet with the same unusual behavior. By Jan. 15, Galileo correctly concluded that they were not stars at all but moons orbiting around Jupiter, providing strong evidence for the Copernican theory that most celestial objects did not revolve around the Earth. In March 1610, Galileo published his discoveries of Jupiter’s satellites and other celestial observations in a book titled Siderius Nuncius (The Starry Messenger).

Top: Two of Galileo’s telescopes. Bottom: Page from Galileo’s notebook about his observations of Jupiter’s satellites. Credits: National Geographic, gabrielevanin.it, University of Michigan Special Collections Library.

As their discoverer, Galileo had naming rights to Jupiter’s satellites. He proposed to name them after his patrons the Medicis and astronomers called them the Medicean Stars through much of the seventeenth century, although in his own notes Galileo referred to them by the Roman numerals I, II, III, and IV, in order of their distance from Jupiter. Astronomers still refer to the four moons as the Galilean satellites in honor of their discoverer. The German astronomer Johannes Kepler suggested naming the satellites after mythological figures associated with Jupiter, namely Io, Europa, Ganymede, and Callisto, but his idea didn’t catch on for more than 200 years. Scientists didn’t discover any more satellites around Jupiter until American astronomer E.E. Barnard found Jupiter’s fifth moon Amalthea in 1892, much smaller than the Galilean moons and orbiting closer to the planet than Io. It was the last satellite in the solar system found by visual observation – all subsequent discoveries occurred via photography or digital imaging. As of today, astronomers have identified 79 satellites orbiting Jupiter.

Meteorologist Paul Dorian
Arcfield
arcfieldweather.com

Follow us on Facebook, Twitter, YouTube

via Watts Up With That?

https://ift.tt/EUKoPfX

October 5, 2024 at 08:07AM

Manston – WMO 03797 or WMO 03798, DCNN 5377 or DCNN 5378 or DCNN 9602 or…….? Part 1.

51.34644 1.33552 Met Office Assessed CIMO Class 1. (WMO 03797 DCNN 5378) Installed (somewhere) 1/01/1928 Archive data from 1/1/1961 for site co-ordinates given (Not original site).

Plus second site @ 51.34558 1.33483 CIMO assessment not known (DCNN 5377). Installed 16/12/2019 with archived data from 26/11/2019 to date.

Plus “Trial” site @ 51.35239 1.34774 CIMO Assessment not known (WMO 03798 DCNN 9602) installed 1/3/2000 with archived data from 9/6/2000 to 1/11/2000 possibly still existing.

A once significant international aviation site it is currently closed but in the throes of reopening and with some testing flights and works ongoing.

Tim Channon reviewed the Manston site back in 2012. He estimated CIMO Class 1 which subsequently proved to be the Met Office assessment. His only reservation was a relatively new generator located close by (foreground with Met office station to the left in distance) that may possibly have an effect (shown below).

But then things got complicated……….very complicated

Fellow weather station researcher, Met Office sceptic and environmental journalist Chris Morrison contacted me regarding reports of temperature readings being taken by the Manston runway. I thought that was unlikely as I personally know the Manston site quite well from living not far away. I opted to research and uncovered a real can of worms.

Firstly, the “readings by the runway” were found to be the end of a long line of “Chinese Whispers“. There was a temporary private weather station (known as Manston WEPC 2024) installed on the runway for a specific event. https://wpec.co.uk/

Clearly confusion had been caused by this station’s readings being included on the Met Office WOW site. These readings were solely for local immediate guidance and certainly were not intended for the historic temperature record. However, in revisiting records for this site I came across two other Manston stations that Tim would not have been aware of in his original assessment. One didn’t exist back then and the other was not showing in archived data until recently. So what is all this about particularly as one new site was allocated a World Meteorological Organisation (WMO) number and both new ones given unique District County Network Numbers (DCNN)?

Site History. Archive records indicate the site started in 1928. The co-ordinates given back then are not precise enough to exactly pinpoint its location though it was clearly situated at the opposite end of the runway near the original control tower as Tim had conjectured. Google earth pro suggests the current main site came into being after the 1960 imagery which concurs with the digital archive data starting from 1961. Bear in mind, not only is the single direction runway over 9,000 feet long it is also notably very wide – daredevil light aircraft pilots have claimed to have landed over the width of the runway – probably bravado claims but indicative of its exceptional dimension nonetheless. This is relevant to accurate location of sites.

Over the years the site has been an RAF and a USAF base as well as a civilian airport which, though currently closed, is due to reopen in the near future. It is an emergency landing site once rumoured to have been landing cleared for the Space Shuttle though some now doubt such claims.

The main weather station (1961 variant) is quite remote from the runway hence the CIMO assessment as being unaffected by aircraft movements. It is quite probable this did not accurately enough represent the site for aviation purposes and a separate military weather station continued independent of the Met Office and simply not openly archiving its readings.

Recent Present. A “trial site” was established even further from the runway in 2000 and (perhaps prematurely) given WMO 03798 demarcation. Archive data only indicates 145 days of operation, however it may have continued well beyond that point and even to this day but simply not being openly recorded. It lies within a public restricted area so it is difficult to check and not clearly identifiable on aerial imagery.

In 2019 a new site “Manston No 2” was installed. The co-ordinates given in CEDA archives are not always exactly correct, however, very recent google aerial imagery indicates a potential site very close by the runway. Both original (top left) and No 2 Station (red kite) are visible in the imagery below.

This No 2 site is very compromised by proximity to the runway/taxiway and aircraft movements. It would also accordingly be more suitable for aviation purposes giving more accurate runway temperatures.

None of this should be alarming, there are no issues with aviation sites being used for aviation purposes providing their data/readings do not “drift” into the historic temperature record. Here, though, some questions start to be raised. Firstly the Met Office WOW site also locates stations by map – here is the Manston map.

Note the single blue dot indicates the Manston WEPC 2024 site whilst the orange circled blue dot indicates the Met Office Official site – at this resolution both are on the runway. Higher resolution on the Met Office Station does not relocate the marker to the main site named Manston. Whilst this could seem to be just inaccurate mapping it is worth noting that the Private Weather Site to the west “Minster Weather” locates to almost exactly the correct location.

Traditionally Manston has rarely appeared either as a regional or national “hot spot” for temperature readings being a well exposed open site near the coast, however, recently it has started to record both regional and national highs in the Met Office Daily Extremes. To clarify the overall position I contacted the Met Office to ascertain how many sites were currently operational in the Manston area and, if more than one, which one was being used to contribute to the Daily Extremes figures. Their response was quite bizarre.

“Thank you for taking the time to get in touch. 

Having read through your enquiry, I believe it is best paced wit the CEDA support team. 

Their support email address is support@ceda.ac.uk, and more information can be found at the link below:

https://www.ceda.ac.uk/contact/

I hope you are able to find the information you are looking for.”

Being fobbed off to contact the keepers of archived information rather than answering direct questions about current sites from the responsible body was not an acceptable response. I immediately replied requesting an answer to just one simple question i.e. how many weather stations does the Met Office have in the Manston area?

No answer has as yet been received despite a recent reminder. This now means I have to insist on a response by way of (what should really be unnecessary) Freedom of Information request liable to take 20 working days for a response.

In the interim early comparison of the Manston and Manston 2 readings of the last 4 years indicated significant variance between the 2 sites barely 1,000 feet apart and a possible explanation of the recent elevated readings. The question remains, which sites readings are actually being highlighted on their “Daily Extremes”?

Then 1st October another oddity.

Yet again Manston hit the national high but which one? The original Manston site’s readings are available to view online at the Met Office’s WOW site. These show hourly readings timed in BST.

The maximum (on the hour) reading is only 17.5°C. A rise up to, and subsequent fall from 18.6°C to the hourly readings shown would be over a very short time period and whilst possible is somewhat unlikely given the sites generally even reporting history as evidenced by Weatherobs – note timing is in GMT. This site also confirms a maximum of only 17.5°C on hourly recording.

The very close by Private Weather Station (PWS) – Minster Weather – only recorded a high of 17.2°C

This level of discrepancy seems to be a recent phenomenon as the PWS used to be in almost exact parity with the original Manston site which is unsurprising given their proximity and similarity of location – indeed it would be normal to expect the PWS to run a bit “warmer” in its more sheltered position.

This is clearly going to be an ongoing investigation but may well clear up the interesting situation of the Met office having two sites in close proximity particularly at aviation sites.

To be continued………

via Tallbloke’s Talkshop

https://ift.tt/Q6OYxpr

October 5, 2024 at 06:53AM

Massive Electricity Price Rises Expected as National Grid Confirms Gas is the Only Back-Up for Intermittent Renewables

From THE DAILY SCEPTIC

by Chris Morrison

The cat is finally out of the bag. It is planned that Britain by 2030 will produce 95% of its electricity from so-called green sources with 5% coming from gas. The pretence that electricity can be stored at scale to support unreliable renewables is nowhere to be seen in a recent Guardian interview with Fintan Slye, the head of National Energy System Operator (NESO). “There will continue to be a significant amount of power plants in reserve for the cold, dull, windless weeks of winter, but they will run for only limited periods,” observes Slye, whose operation was recently nationalised and is responsible for balancing supply and demand across the National Grid.

His remarks both clarify and strike fear at the same time. There is no back-up at scale for intermittent breezes and sunbeams and this has been obvious for some time, although the subject is rarely discussed in mainstream media and politics. Reserve gas generation is the only game in town if all life in Britain is not to grind to a halt during a windless, winter freeze. But keeping an entire fleet of gas turbines on standby will cost a huge amount of money, causing electricity prices to soar. The planned destruction of Britain’s own gas and oil industry will hardly help future sourcing and pricing, let alone national security.

Britain already has some of the highest electricity prices in the developed world and doubling, trebling or quadrupling charges will help destroy what is left of industry and condemn the population to drastically falling standards of living. As always with green punch-down lunacy, the poorest in society will be the hardest hit. Many people will be priced out of basic necessities they have always taken for granted such as light, heat, refrigeration, cooking facilities and electronic goods to access the online world.

One commonly peddled fantasy can be found in the Guardian article. “Conversely, there will be days when Great Britain generates far more electricity from renewable sources than it can use or store, so there are likely to be greater exports to neighbouring countries,” notes Slye. But of course weather does not stop at national boundaries. Nearby countries are likely to share similar windy conditions and with every operator trying to offload energy, the price offered would drop like a stone towards zero.

Already in the U.K., the National Grid is forced to pay renewable operators to stop producing energy. Last year, ‘constraint’ payments of nearly £1 billion were paid. It might be noted that this is not far short of the amount recently saved by scrapping the pensioners’ winter fuel allowance. But these sums are chicken feed compared with the overall subsidies paid to renewable energy operators, with over £12 billion added to the annual fuel bills of consumers. The more renewable generating capacity is added to the mix, the more the constraint payments and subsidies are likely to increase. With bunce like this, it is hardly surprising that Ecotricity boss Dale Vince, who runs onshore windmills, recently gifted £5 million to improve the election chances of the Labour party.

It is likely that the Mad Miliband is set on a 75-80% contribution to the grid from the breezes and the beams. Again we must be obliged to the Guardian for covering the subject in such detail and pointing out so vividly the further difficulties that are likely to arise when the wind drops during the 18 hours of winter darkness. Basically, the price goes up, in fact it soars up to 20 times higher. In March 2023, the Guardian reported that the grid was forced to buy gas-generated power in a windless cold period at £1,950 per megawatt hour (MWh). The usual price is around £100 MWh. One industry source  is reported to have said the price of sourcing power from gas peaking plants had “raised eyebrows”. Vitol is the largest oil trader in the world and knows something about securing the best market-determined rate. At this time it offered a price of £5,750 per MWh although the offer from its Rye House subsidiary was not accepted.

In an article published by the Manhattan Contrarian, Francis Menton discusses the “disastrous economics” of trying to power an electric grid with 100% intermittent renewables. The move inevitably brings about large increases in the actual price of electricity that must be paid by consumers. But he doesn’t just rely on theoretical calculations. “In those jurisdictions that have succeeded in getting generation from renewable up to as high as about 30% of their total electricity supply [Britain hit around 34% in 2023], the result has been an approximate tripling in the price of electricity for their consumers,” he states. Furthermore, he continues: “As the percentage of electricity coming from renewables increases, the consumer price increases accelerate.”

In his social media blockbuster Climate: The Movie, Martin Durkin introduces it as the story of how an eccentric environmental scare grew into a powerful global industry. “Climate change is an invented scare of self-interest and snobbery, cynically promoted by a parasitic, publicly-funded establishment hungry for power and money,” he charges. He could not have summed up better the drive to the command-and control Net Zero project.  Deliberately making energy more expensive by ‘de-carbonising’ the U.K. grid by 2030 is just one of the many economic and societal changes being planned by the new Labour hegemony.

Chris Morrison is the Daily Sceptic’s Environment Editor.

via Watts Up With That?

https://ift.tt/F4TlthM

October 5, 2024 at 04:06AM

Junk Energy: Uncontrollable Domestic Solar Power Generates Total Grid Chaos

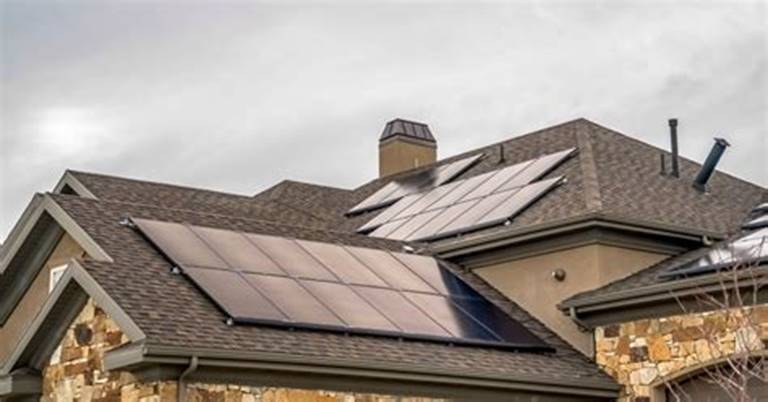
Places like California and Australia are victims of their own idiotic domestic solar schemes, scams and subsidies. The disaster was as perfectly predictable as it was perfectly avoidable. But it’s still fun to watch!

Sunshine-dependent solar power and wind-dependent wind power have no commercial value because the operators can never tell you when they might be able to deliver with any real certainty. However, at least with the commercial outfits the grid-manager has the ability to curb and curtail their output to prevent sudden power surges wrecking the grid for everyone else.

Not so with domestic rooftop solar, as the team from Jo Nova explains below.

Australian grid risks an overload at lunchtime as solar power floods the system
Jo Nova Blog
Jo Nova
28 September 2024

It’s grand final day in Australia, and awkwardly the State of Victoria risks a grid overload. A truckload of solar power will arrive at lunchtime that no one needs, and which has no place to go.

The largest single generator in Australia now is rooftop solar and it’s virtually uncontrollable. The geniuses running the national grid have subsidized solar panels and made electricity unaffordable at the same time, thus driving more householders into the arms of the solar industry.

So they’ve created an artificial market bubble — as all good communists do. We now have a 20 gigawatt capacity generator that mostly can’t be turned off, except by clouds or possibly Chinese cyberwarfare.

And where autumn and spring used to be the easy seasons, now Sunny spring days are diabolical too — hardly anyone needs their air conditioner or their heater at lunchtime, but solar watts are pouring in.

This was the situation yesterday in Victoria:

Victorian electricity generation, Spring, 2024, solar glut. Minimum demand, Anero.id

Again, the poor sods who built solar industrial parks (marked in red) have to curtail their production massively from 8am to 5pm. The red curve is supposed to look like the yellow curve. The missing red peak is wasted solar production.

As the yellow uncontrollable peak rises towards the black line (the total demand), the whole grid has a problem — more reliable cheap generators have to shut down to prevent the toxic excess electricity building up.

Without the reliable generators, with their 500 ton turbines spinning at 3,000 revolutions per minute, (or 3,600 in the USA) the grid loses frequency stability, and spinning inertia, and the ability to cope when a cloud rolls over. The problem of excess solar at lunch time is also called The Duck Curve and has been known for years. It’s not like this snuck up and surprised anyone, yet here we are — courting disaster.

The ABC reported on this, but can’t bring itself to call this what is is — a “Solar Glut” dumped on the grid. Instead rooftop solar is a “juggernaut” and the grid faces a “low demand warning”, as if you personally are the problem, for not using enough electrons. Don’t blame the artificial pointless bubble of solar panels.

Rooftop solar ‘juggernaut’ risks grid overload as AEMO issues first-ever low-demand warning
by Daniel Mercer, ABC

Rooftop solar output has reached such enormous levels that authorities have begun issuing warnings about their ability to keep the electricity system from being overloaded at times.

In an extraordinary first this week, the body that runs Australia’s biggest energy market said the supply of solar power in Victoria threatened to overwhelm demand for electricity from the grid amid mild, sunny conditions.

It said Friday’s oversupply of solar was so acute that demand for power from the grid would fall below a threshold critical for keeping the electricity system on an even keel.

Even the AEMO (the Australian Energy Market Operator) calls it a minimum system load notice – not a solar surge, or a renewable overload.

And despite the toxic excess of solar panels, and that we’ve known this day would come, in true Soviet fashion, we’re still installing as many as we can (see below). The trainwreck continues.

The relentless rise of solar PV in Australia.

That would stop dead in its tracks if householders had to pay fair costs for the frequency stability, the back up power, and the storage.

The solution, according to government experts, is not to have a real market and accurate prices, it’s to give more powers to some bureaucrats so they can order battery owners to discharge before lunch and be ready to soak up the dangerous excess at midday. The battery owners don’t like that, but like an anaconda, the government gradually tightens its grip until the free market is dead.

The other “solution” is to add controllers to home solar panels so the government can switch them off (which is starting to happen in South Australia and Western Australia). Solar panels owners don’t like that either, but they were sold rainbows and fairy cakes that no one could deliver.

The communist quislings complain that the market is failing us and needs more governance. But the truth is, the overlords destroyed the free market long ago. The people want reliable electricity, and if they were allowed to choose reliable power over renewable energy, the problem would solve itself.

Meanwhile, grid managers surely pray for cloudy days. Soon, some bright spark is going to suggest cloud seeding for grid stability.

UPDATE: The grid demand fell to 1817MW in Victoria, and survived but prices spiked to minus $367 today during the low minimum solar belly of the duck.
Jo Nova Blog

via STOP THESE THINGS

https://ift.tt/gWPvzMf

October 5, 2024 at 02:31AM