Who Let The Dogs Out?

At first glance what follows might appear to be about Facebook, but it isn’t. Facebook merely facilitated an extraordinary sequence of events.Yesterday, in Not Making The News I referred to the fact that the not-yet-in-existence Great British Energy has a Facebook page. An earlier one was taken down after a number of comments from those sceptical of its objectives met with what might be considered inappropriate responses. Now they’re having another go, though it seems lessons have not been learned.

It all kicked off when Kate Tulloch posted:

So how exactly ( emphasis on exactly) will this toothless quango result in lower electricity bills? Also, with an expected cost to set up, of £8.3billion, how does this spend equate with the “black hole” in government finances and the cancellation of pensioner’s winter fuel payments? Genuine question to which I’d love to have a response to.

Willie Jackson followed up with:

Wouldn’t we all but if we get one I doubt it will be sensible.

At which point the first response was forthcoming:

We’re an energy company. Check our website –

https://greatbritishenergy.wordpress.com/(founding statement and videos explaining the long term plan to bring down energy prices) &

https://greatbritishenergy.wordpress.com/emails/(see our email of 14th September to the Scottish Governments for our suggestions as to how OFGEM could bring down energy prices sooner rather than later)

Kate replied:

that doesn’t really answer my question and as one of the main aims is to bring down energy prices (see snapshot) I’d have expected a definitive plan.

The snapshot in question referred to a Great British Energy claim that it seeks to lower energy bills for every household by an average of £300 a year; to increase energy security by reducing the UK’s reliance on imported fossil fuels from countries like Norway, Qatar, the US and Russia [interesting, given that Mr Miliband regularly refers to reducing our reliance on dictatorships – I would suggest that at least two out of those four don’t qualify for that description]; take on the challenge of delivering green electricity by 2030, through increased use of renewable energy sources; and create 650,000 new jobs in all parts of the UK through local energy generation [with a link to GBE’s website for a regional breakdown of new jobs].

So far so polite, but now it starts to get interesting. GBE’s next post said:

It is for others to answer for their own snapshots.

We do not regulate energy prices – OFGEM does – that’s the law. If OFGEM will partner with us, take our advice then we can help with prices. But it takes 2 to tango. As Mike Tyson said “Everyone has a plan until they are punched in the mouth.”

We have a plan but if everyone “punches us in the mouth”, doesn’t co-operate, obstructs at every possible turn, be they OFGEM, Facebook etc then let’s be realistic about what any good plans can achieve.

Willie Jackson observed:

Is your plan to build as much energy generation as far as way from London as possible? That would mean GB consumers have to pay a lot more for lengthy OHL transmission, than is necessary. Presumably then the Energy Secretary Miliband will call anyone who questions the merit of that choice a ‘blocker’. Is building wind energy in Scotland, really the right ‘trade-off’ that the Prime Minister wishes to support. Because consumers don’t.

The gloves were coming off now, as GBE responded to Willie:

No, that’s not the plan. But you want to vent so be our guest.

I arrived at the party a little late. Replying to GBE’s earlier (punch in the face) comment I observed:

That’s a staggering reply. Are you really saying that you are to be set up with no coherent over-arching plan embracing you and all other entities associated with energy production and regulation in the UK?

And Willie Jackson tried again:

I really don’t, just asking a reasonable question to get a reasonable answer. But if you want a word of advice, I think you need someone with better customer service experience running this page. Could you tell us what your plan is please?

It seems my observation hit a nerve, as GBE wilfully misinterpreted my question and decided to punch me in the face:

What’s a “staggering reply”? That Willie Jackson’s Facebook post ISN’T our plan? It would staggering if it was, don’t you think?

Ah, you don’t think – explains everything.

I was becoming irritated, but endeavoured to keep things polite, despite the provocation:

Another staggering reply. You really know how to win hearts and minds, don’t you? You know nothing about me, yet you accuse me of not thinking for asking a reasonable question that you are apparently incapable of answering. Who on earth is in charge of this Facebook page?

Britain’s energy supply is vitally important. This isn’t the playground.

GBE responded to Willie with a similar non-reply as that given to Kate Tulloch earlier (linking to their website and videos seems to be the extent of their ability):

Our plan is laid out on the website. You have to visit the link, read it, watch the videos.

https://greatbritishenergy.wordpress.com/(founding statement and videos explaining the long term plan to bring down energy prices)

&

https://greatbritishenergy.wordpress.com/emails/(see our email of 14th September to the Scottish Governments for our suggestions as to how OFGEM could bring down energy prices sooner rather than later)

A little order was briefly restored when they also responded to my last comment:

We know how to secure energy and to transition to Net Zero. We know how to get energy prices down. If we do that well then hearts and minds will be won, we trust.

Social media accounts and our website are being managed by volunteers in Aberdeen working remotely on condition of anonymity.

I responded, still endeavouring to keep it polite:

Thank you. I do think about these issues, and I also read widely. Thus I am aware that the Great British Energy Bill is still in committee stage, and that GBE won’t be formally constituted until the Bill becomes law. I was also aware that the Facebook page is being run by volunteers. The lack of transparency as to who the volunteers are and why they are doing it is another issue.

You won’t win hearts and minds by being rude to people who are concerned about the direction of travel and who ask reasonable questions. Nor will you win hearts and minds by destroying the landscape, damaging food and energy security, and by increasing energy bills. The National Grid estimates that net zero will cost £3 trillion, which amounts to £4,000 per household every year between now and the target date of 2050. If you have a plan as to how that will get energy prices down, then the sooner you share it with us the better.

I note that neither Ed Miliband nor Chris Stark seem to have a plan. They have written to poor benighted Fintan Slye demanding that he comes up with one. To date his response seems to be to endeavour to move the goalposts.

I don’t expect you to reply. I don’t really think a Facebook page run by volunteers who can’t answer technical questions is a good idea.

By now Kate Tulloch had returned to the fray, seemingly as shocked as I was by the intemperate language:

wow! You need some lessons in customer service, politeness and respect. You’re representing a public body and have done little other than alienate people by your responses here. Maybe setting this page up at this stage is something that should be reconsidered?

At this point the GBE volunteer completely lost it:

Tell us what Fintan Slye’s salary is and then tell us again how “poor” you believe this fat-cat CEO to be.

“Benighted” – “in a state of pitiful or contemptible intellectual or moral ignorance” – we agree – he and Jonathan Brearley, the OFGEM CEO make quite a benighted pair of free-marketeers to leave in charge of our nations’ energy supplies and prices.

As for bringing down energy prices “sooner” rather than later, we refer you once again to our email of the 14th September to the Scottish Government.

At this stage there are only two further interactions. Mine:

Thank you. Have you heard of the phrase “when you’re in a hole, stop digging”?

And Kate Tulloch’s:

this Facebook page has to be a spoof surely? You can’t go around calling people “fat cat CEOs” on a page which purports to represent a public body and referring to other bodies you’re supposed to have (or develop) a working relationship with.

I think that last point is bang on the money. It’s worth looking back at this strange day on social media and reflecting on the implications. It’s difficult to know exactly what’s going on here, but let’s remind ourselves that Great British Energy does not yet exist. Its founding document will be the Great British Energy Bill (clauses one and two are directly relevant here), but its still in the committee stage in Parliament and is not yet law. Which brings us back to the fact that a non-existent company has a basic website and has been sending emails to quite a few people that it wants us to read. During the Facebook exchange, the email of 14th September 2024 was proffered repeatedly for the delectation of those engaging with the anonymous volunteer holding the fort. It makes for interesting reading, including as it does, the following:

As for bringing down energy bills, which are regulated by OFGEM, perhaps a partnership between GB Energy & OFGEM would allow GB Energy Headquarters Aberdeen’s suggestions as regards what OFGEM should do to bring down energy bills to be escalated into prompt action?

Domestic gas consumers pay an unfairly higher gas price rate per kWh than do big business customers who enjoy an unfairly low price. Regulating to ensure that domestic and big business pay the same gas rate per kWh would mean a lower rate for domestic and a higher rate for big business consumers but that’s fair.

Gas and electricity standing charges are unfair so should be abolished for domestic consumers in their residence where they are registered to vote but standing charges kept in 2nd homes, 3rd homes etc and kept for non-domestic business premises.

Free allowances of gas kWh should be given to domestic consumers.

Off-gas-grid electricity domestic customers should get a discount off their electricity bills of the same value as the free gas allowance – which should be paid for by the single gas rate to compensate for the gas industry’s failure to connect more energy consumers.

If all these new regulations raise gas bills for big business then this will be all the greater incentive for big business to switch from natural gas to renewable energy alternatives, boosting our energy transition to Net Zero.

Free allowances of electricity to consumers should be given where and when wind power generation is in excess of what can be practically sold to any customers when typically wind farm generation constraints are active.

All of those above measures would dramatically lower gas and electricity bills for voters’ homes and that is before GB Energy has built a single wind farm.

As regards what can be done so that UK oil refineries, like Grangemouth, can compete more successfully against cheap, very unfairly and lightly taxed imports of refined oil products, such as petrol, diesel, aviation fuel, lubricating oil etc, we here at GB Energy Aberdeen HQ have good solutions to suggest for that UK industrial problem too, for OFGEM and the UK Government to act upon, along the lines of imposing higher import duties on refined oil products, but not on crude oil, the feedstock of oil refineries (excepting where crude oil and refined oil products from Russia are sanctioned and not allowed to be imported under any circumstances).

So GB Energy Headquarters, Aberdeen is open to and would welcome such appropriate partnerships as may be established in the public interest.

Interesting stuff, including the complete indifference regarding the prospect of proposed new regulations raising gas bills for big business. However, the important question – given that Great British Energy does not yet exist – is who wrote it, and by whose authority was it signed off as being from “Aberdeen Headquarters, Great British Energy”?

It’s noteworthy that the current Facebook page represents to my knowledge the third such attempt, with one going back to 2020. It all looks like the work of Labour Party activists, including the emails and today’s interaction on Facebook. Do Sir Keir Starmer and Mr Ed Miliband know what’s being done in the name of Great British Energy? If not, then surely it needs to be stopped with immediate effect. On the other hand, if they do know, then it’s deeply worrying, for it looks as though an idealistic, and not terribly polite, Labour Party activist (working voluntarily and hiding behind a promise of anonymity) is attempting to direct the UK’s energy policy, while being rather rude about the people with whom Great British Energy will have to work.

What on earth is going on?

via Climate Scepticism

https://ift.tt/NbOMzwR

October 1, 2024 at 01:46PM

First energy squeeze and Big Tech drops the wind and solar purity, and launches into nuclear power

By Jo Nova

Google, Oracle, Microsoft were all raving fans of renewable energy, but all of them have given up trying to do it with wind and solar power. In the rush to feed the baby AI gargoyle, instead of lining the streets with wind turbines and battery packs, they’re all suddenly buying, building and talking about nuclear power. For some reason, when running $100 billion dollar data centres, no one seems to want to use random electricity and turn them on and off when the wind stops. Probably because without electricity AI is a dumb rock.

In a sense, AI is a form of organised energy. The guy with the biggest gigawatts just needs to get organised, and the guy with unreliable generators isn’t in the race.

It’s all turned on a dime. It was only in May that Microsoft was making the “biggest ever renewable energy agreement” in order to power AI and be carbon neutral. Ten minutes later and it’s resurrecting the old Three Mile Island nuclear plant. Lucky Americans don’t blow up their old power plants.

Oracle is building the world’s largest datacentre and wants to power it with three small modular reactors. Amazon Web Services has bought a data centre next to a nuclear plant, and is running job ads for a nuclear engineer.  Recently, Alphabet  CEO Sundar Pichai, spoke about small modular reactors. The chief of Open AI also happens to chair the boards of two nuclear start-ups.

The AI boom has left technology companies scrambling for low-carbon sources of energy to power their data centers. The International Energy Agency estimates that electricity demand from AI, data centers, and crypto could more than double by 2026. Even its lowball estimates say that the added demand will be equivalent to all the electricity used in Sweden or—in the high-usage case—Germany.

Australia uses ten times as much electricity as Microsoft, but is still fantasizing about reaching 82% renewable by 2030 with no nuclear power “because it will cost too much and take too long”.  Microsoft uses 24 TWh of energy a year and employs 220,000 people, and knows it needs a nuclear plant to be competitive (and reach, albeit frivolous weather changing ideals).  Australia uses 274 TWh of electricity, and employs 14 million people but is going to aim for frivolous climate witchery anyway, and do it the double-hard way.

Who needs to be competitive, right?

Pierre Gosselin discusses how Germany risks being left behind because it has switched off all its nuclear plants. At least it has some power lines to France. Australia has no nukes, not much hydro, no mountains to spare, and is the driest continent on Earth, we are the crash test dummy.


0 out of 10 based on 0 rating

via JoNova

https://ift.tt/D9j26zb

October 1, 2024 at 01:40PM

18 yr. Plateau September Arctic Ice 2024

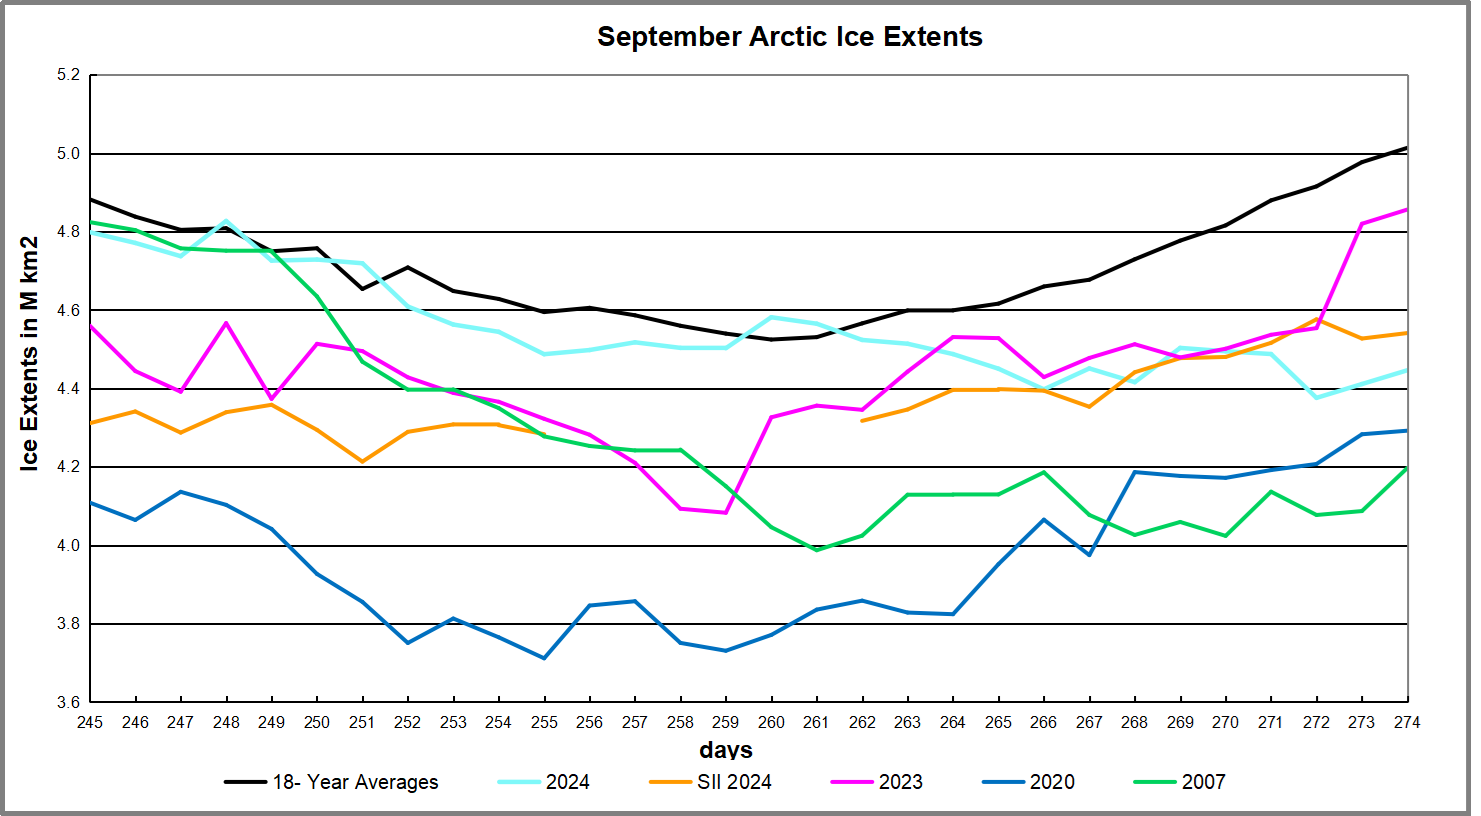
September daily extents are now fully reported and the 2024 September monthly results can be compared with those of the previous 15 years.  MASIE showed 2024 at 4.6M km2  and SII was slightly lower, reaching 4.4M for the month.  Analysis below shows that the 2024 annual Minimum month was 75k km2 lower than the 18 year average, and was 256 km2 greater than 2007.  The 18 yr. trendlines are virtually flat and matching the averages of 4.6M km2 for the period since 2007.

In August, 4.27M km2 was the median estimate (range 4.11 to 4.54) for the September monthly average extent from the SIPN (Sea Ice Prediction Network) who use the reports from SII (Sea Ice Index), the NASA team satellite product from passive microwave sensors. The SII actual ice extent average was ~100k km2 higher than estimated.

The graph below shows September comparisons through day 274 (Sept. 30).

The graph has some unusual things to note. The typical September is shown by the black line, which reaches the daily minimum on day 260 and ends the month ~100k km2 higher than the beginning. 2024 was unusual by matching average the first half, appearing on day 255 to hit minimum, then going above average on day 260.  Surprisingly, the last two weeks MASIE showed a steady loss of ice extent down to a minimum on day 272, and recovering the last two days.  Instead of a slight gain, MASIE showed September 2024 losing ~400k km2 by month end.

2007 also started matching average, but went down steeply losing more than half a wadham below average on day 261, then recovering slightly but ending ~800k km2 below average on day 274.

The orange line shows SII starting much lower than MASIE, then the dataset is missing six days mid month. Finally, ice extents rise above MASIE by the end, reaching nearly the same as the month beginning. I calculated the monthly average for SII from the data provided, though the official number may differ once it is reported.

The table shows ice extents in the regions for 2024, 18 year averages and 2007 for day 274. Averages refer to 2006 through 2023 inclusive.

Region 2024274 Day 274 Ave 2024-Ave. 2007274 2024-2007
 (0) Northern_Hemisphere 4446117 5013499 -567382 4196873 249243
 (1) Beaufort_Sea 280737 564271 -283534 503548 -222811
 (2) Chukchi_Sea 350261 214302 135958 1065 349196
 (3) East_Siberian_Sea 320409 307838 12571 311 320098
 (4) Laptev_Sea 207220 169745 37475 237446 -30226
 (5) Kara_Sea 339 39310 -38971 15857 -15518
 (6) Barents_Sea 0 15734 -15734 4851 -4851
 (7) Greenland_Sea 163963 250200 -86237 353210 -189247
 (8) Baffin_Bay_Gulf_of_St._Lawrence 38141 57714 -19573 51770 -13629
 (9) Canadian_Archipelago 112998 388756 -275757 302221 -189223
 (10) Hudson_Bay 0 3062 -3062 1936 -1936
 (11) Central_Arctic 2968286 3001441 -33155 2723382.15 244904

The major deficits are in Beaufort, Greenland sea and Canadian Archipelago. Only Chukchi shows an offsetting surplus.  Overall, the NH ice extent is 567k km2 or 11% below average.

Summary

Earlier observations showed that Arctic ice extents were low in the 1940s, grew thereafter up to a peak in 1977, before declining.  That decline was gentle until 1996 which started a decade of multi-year ice loss through the Fram Strait.  There was also a major earthquake under the north pole in that period.  In any case, the effects and the decline ceased in 2007, 30 years after the previous peak.  Now we have a plateau in ice extents, which could be the precursor of a growing phase of the quasi-60 year Arctic ice oscillation.

Background 

A commenter previously asked, where do they get their data? The answer is primarily from NIC’s Interactive Multisensor Snow and Ice Mapping System (IMS). From the documentation, the multiple sources feeding IMS are:

Platform(s) AQUA, DMSP, DMSP 5D-3/F17, GOES-10, GOES-11, GOES-13, GOES-9, METEOSAT, MSG, MTSAT-1R, MTSAT-2, NOAA-14, NOAA-15, NOAA-16, NOAA-17, NOAA-18, NOAA-N, RADARSAT-2, SUOMI-NPP, TERRA

Sensor(s): AMSU-A, ATMS, AVHRR, GOES I-M IMAGER, MODIS, MTSAT 1R Imager, MTSAT 2 Imager, MVIRI, SAR, SEVIRI, SSM/I, SSMIS, VIIRS

Summary: IMS Daily Northern Hemisphere Snow and Ice Analysis

The National Oceanic and Atmospheric Administration / National Environmental Satellite, Data, and Information Service (NOAA/NESDIS) has an extensive history of monitoring snow and ice coverage.Accurate monitoring of global snow/ice cover is a key component in the study of climate and global change as well as daily weather forecasting.

The Polar and Geostationary Operational Environmental Satellite programs (POES/GOES) operated by NESDIS provide invaluable visible and infrared spectral data in support of these efforts. Clear-sky imagery from both the POES and the GOES sensors show snow/ice boundaries very well; however, the visible and infrared techniques may suffer from persistent cloud cover near the snowline, making observations difficult (Ramsay, 1995). The microwave products (DMSP and AMSR-E) are unobstructed by clouds and thus can be used as another observational platform in most regions. Synthetic Aperture Radar (SAR) imagery also provides all-weather, near daily capacities to discriminate sea and lake ice. With several other derived snow/ice products of varying accuracy, such as those from NCEP and the NWS NOHRSC, it is highly desirable for analysts to be able to interactively compare and contrast the products so that a more accurate composite map can be produced.

The Satellite Analysis Branch (SAB) of NESDIS first began generating Northern Hemisphere Weekly Snow and Ice Cover analysis charts derived from the visible satellite imagery in November, 1966. The spatial and temporal resolutions of the analysis (190 km and 7 days, respectively) remained unchanged for the product’s 33-year lifespan.

As a result of increasing customer needs and expectations, it was decided that an efficient, interactive workstation application should be constructed which would enable SAB to produce snow/ice analyses at a higher resolution and on a daily basis (~25 km / 1024 x 1024 grid and once per day) using a consolidated array of new as well as existing satellite and surface imagery products. The Daily Northern Hemisphere Snow and Ice Cover chart has been produced since February, 1997 by SAB meteorologists on the IMS.

Another large resolution improvement began in early 2004, when improved technology allowed the SAB to begin creation of a daily ~4 km (6144×6144) grid. At this time, both the ~4 km and ~24 km products are available from NSIDC with a slight delay. Near real-time gridded data is available in ASCII format by request.

In March 2008, the product was migrated from SAB to the National Ice Center (NIC) of NESDIS. The production system and methodology was preserved during the migration. Improved access to DMSP, SAR, and modeled data sources is expected as a short-term from the migration, with longer term plans of twice daily production, GRIB2 output format, a Southern Hemisphere analysis, and an expanded suite of integrated snow and ice variable on horizon.

http://www.natice.noaa.gov/ims/ims_1.html

Footnote

Some people unhappy with the higher amounts of ice extent shown by MASIE continue to claim that Sea Ice Index is the only dataset that can be used. This is false in fact and in logic. Why should anyone accept that the highest quality picture of ice day to day has no shelf life, that one year’s charts can not be compared with another year?

MASIE is rigorous, reliable, serves as calibration for satellite products, and continues the long and honorable tradition of naval ice charting using modern technologies. More on this at my post Support MASIE Arctic Ice Dataset


via Science Matters

https://ift.tt/LIi1Hmw

October 1, 2024 at 12:45PM

CBS Gets the Facts Wrong About Hurricane Helene and Hurricane Trends

From ClimateREALISM

By Linnea Lueken

A recent broadcast weather segment on CBS News, Los Angeles, titled “Helene gaining strength from climate change effects,” features a staff meteorologist claiming that hurricane Helene was strengthened by climate change, and that indeed hurricanes in general are increasing in intensity and power. This is false. It is actually shocking how wrong CBS is with regards to what actual hurricane data show, which is that hurricanes are not getting more intense, frequent, or powerful.

The CBS video description reads “…Helene is gaining strength from warmer waters in the Gulf of Mexico, an effect linked to climate change that appears to make hurricanes and storms more powerful.”

The CBS anchor hands the segment over to meteorologist Marina Jurica, who alleges that “the increasing intensity of hurricanes is basically rooted in physics… hurricanes draw energy from that warm ocean water and as that climate change causes sea surface temperatures to rise the energy available for these storms increases.”

It is true that warm sea surface temperatures contribute to hurricane formation, However, they are far from the only element, and in fact for most of this hurricane season, despite warmer-than-average sea surface temperatures, storms struggled to form at all.

Jurica asserts the usual claim that warm water causes stronger winds and more moisture which causes heavier rainfall, “one of the most significant effects of climate change is its impact on hurricane intensity… which is why we’re seeing more catastrophic flooding associated with all of these recent storms.” The anchor went on to assert that hurricanes have been more intense in recent years and “the level of the storms is rising,” and Jurica added that “over the last several decades storms are moving slower” using Harvey as an example of this effect. Most of these claims are made out of whole cloth, complete nonsense.

Starting with the Hurricane Harvey anecdote, when the storm hit Texas in 2017, it was the first major hurricane to make landfall in the United States since 2005, after a 12-year major hurricane drought in one of the most active tropical storm regions in the world. The longest such major hurricane drought since records have been kept in the United States.

Jurica claims in the CBS clip that Harvey was stalled and dumped more water on Texas because of global warming causing more moisture in the air, and while it is true that the precipitation was unprecedented for the area, reality shows that it was cooler-than-normal trough that stalled the storm out over Houston. Stalled storms are not new, as pointed out by professional meteorologist and hurricane-historian Joe Bastardi here. As a meteorologist herself it was Jurica’s job to look this up before going on live television.

No measured hurricane data supports the claim that hurricanes have been becoming more intense. This is only found flawed computer model outputs.

Publicly available data record no trend in increasing frequency or intensity of tropical cyclones in the Atlantic or elsewhere around the globe. Accumulated Cyclone Energy is a metric used to track the overall strength of tropical cyclones over time, and if anything, the data here presented by Dr. Ryan Maue suggest they have been getting less powerful since the 1990s. (See figure below)

Even the Intergovernmental Panel on Climate Change (IPCC) agrees, stating that there is “only low confidence for the attribution of any detectable changes in tropical cyclone activity to anthropogenic influences.”

The CBS broadcast was before Helene made landfall, and while hurricane Helene proved to be very destructive, it is not unprecedented. Past hurricanes have likewise caused significant flooding and wind and tornado damage well inland in the Appalachians and surrounding regions, such as hurricane Gracie in 1959 which made landfall in South Carolina as a Category 4, during which 13 people died in Virginia due to tornados. There are many other examples, the most damaging of which was the Great Galveston Hurricane of 1900, a category 4 storm which took between 6,000 and 12,000 lives, most due to storm surge and flooding.

Every major storm involving loss of life and property is a tragedy, and they need to be taken seriously, which is why it is so appalling when the mainstream media takes advantage of peoples’ fear preceding dangerous storms, and their losses and misery following them, in order to make false claims about climate change. CBS’s meteorologist is either shockingly poorly informed about hurricane data or just doesn’t care about facts, despite her training as a meteorologist.

via Watts Up With That?

https://ift.tt/sgAVaiq

October 1, 2024 at 12:05PM