Electricity Is Proportional To CO2

Asia is leaving the rest of the world in the dust for both electricity generation and CO2 emissions. The west is voluntarily self-destructing, in order to facilitate their worship of greenhouse gases. Electricity generation Annual CO? emissions

via Real Climate Science

https://ift.tt/GxFPnlo

September 28, 2024 at 03:15PM

Wrong, Associated Press, New Short Corn Variety Is a Marketing Ploy, Not a Response to Climate Change

From ClimateREALISM

By H. Sterling Burnett

The Associated Press (AP) released a story claiming climate change is causing windstorms to worsen, threatening corn production, leading farmers to consider a new short corn variety. This story is false on almost every front. If farmers are considering a newly developed corn variety, its due to clever marketing by the company developing the crop, not changing climate conditions. Wind speeds and storms haven’t been increasing, aren’t forecast to at any time in the foreseeable future, and corn yields and production continue to set records with existing corn types.

The AP story, titled, “‘Short corn’ could replace the towering cornfields steamrolled by a changing climate,” the news agency writes:

Taking a late-summer country drive in the Midwest means venturing into the corn zone, snaking between 12-foot-tall green, leafy walls that seem to block out nearly everything other than the sun and an occasional water tower.

. . .

But soon, that towering corn might become a miniature of its former self, replaced by stalks only half as tall as the green giants that have dominated fields for so long.

The short corn developed by Bayer Crop Science is being tested on about 30,000 acres (12,141 hectares) in the Midwest with the promise of offering farmers a variety that can withstand powerful windstorms that could become more frequent due to climate change. (emphasis mine)

The facts tell a different story, however. Long corn is in no way being “steamrolled.” Corn yields and production continue to set new records, with some regularity, and there is no evidence that windstorms are becoming more frequent, or that wind speeds are increasing.

To the latter point first. The AP and other mainstream media outlets usually treat reports and pronouncements of the U.N. Intergovernmental Panel on Climate Change (IPCC) as authoritative on climate change. The IPCC’s latest report is clear concerning the impacts of climate change on wind speeds and damaging windstorms: no change has been detected at present; and, under the even the most extreme climate scenario, no change is anticipated in the foreseeable future, through 2100 at least. (see the figure, below)

So much for the AP’s claim that worsening winds pose a threat to corn production.

Data from the U.S. Department of Agriculture (USDA) and the U.N. Food and Agriculture Organization (FAO) also show no climate change impacts on corn yields or production in the United States or globally.

A recently updated USDA report says that corn yields are expected to set a new record in 2024, increasing by 0.5 bushels per acre over the previous estimate, and by a full six bushels per acre of the previous record set in 2023. (See the graph, below)

Data from the FAO confirm the USDA’s findings concerning U.S. corn production and also determine that corn production and yields are regularly setting records around the world as well. Between 1990 and 2022 (the last full year of FAO records), spanning the three decades climate alarmists commonly assert have been the warmest on record:

  • Corn yields in the United States have increased by nearly 60 percent’
  • Corn yields globally have increased by more than 54 percent.

On record yields, crop production has similarly set new records repeatedly as well between 1990 and 2022. (See the graph, below)

Even if, contrary to the AP’s suggestion, corn production is not being harmed by worsening climate conditions, Bayer’s short corn variety may prove beneficial for farmers. It seems that, per the AP, “[t]he smaller plants also let farmers plant at greater density, so they can grow more corn on the same amount of land, increasing their profits.” The shorter corn may also use less water. Both conditions should, in theory, make corn production more profitable, regardless of climate change, so there is a bit of good news in the AP’s otherwise unjustifiably foreboding climate change tale.

H. Sterling Burnett

H. Sterling Burnett, Ph.D., is the Director of the Arthur B. Robinson Center on Climate and Environmental Policy and the managing editor of Environment & Climate News. In addition to directing The Heartland Institute’s Arthur B. Robinson Center on Climate and Environmental Policy, Burnett puts Environment & Climate News together, is the editor of Heartland’s Climate Change Weekly email, and the host of the Environment & Climate News Podcast.

via Watts Up With That?

https://ift.tt/WecS19x

September 28, 2024 at 12:04PM

The Great Hurricane Of 1896

By Paul Homewood


Helene has been declared as the most powerful hurricane to hit Florida’s Big Bend region.

But what about the unnamed 1896 hurricane, which demolished Cedar Keys?

 image

  image

This image shows the devastation caused by the Great Hurricane of 1896 that struck the Gulf and Atlantic coasts of Florida. With its 2,200-kilometer coastline, Florida is the U.S. state most vulnerable to these storms. More than 450 recorded tropical storms and hurricanes have reached its shores since European exploration began. The hurricane of September 1896 destroyed most of the residential area of the town of Cedar Key on the upper west coast of the Florida peninsula, killing dozens of residents and destroying most of Cedar Key’s industries. Before making landfall, the storm and its tidal surge overwhelmed more than 100 sponging boats, killing untold numbers of crewmen. The hurricane then crossed the peninsula, leaving a wide swath of destruction until it reached the Atlantic coast at Fernandina, before heading north to Virginia. This image shows survivors, both white and black, in Fernandina, standing atop mounds of rubble, still seemingly shocked by the destruction

https://www.loc.gov/item/2021669942/

By any standards the 1896 Cedar Keys hurricane was a monster. This is Wikipedia’s summary:

The 1896 Cedar Keys hurricane was a powerful and destructive tropical cyclone that devastated much of the East Coast of the United States, starting with Florida‘s Cedar Keys, near the end of September 1896. The storm’s rapid movement allowed it to maintain much of its intensity after landfall and cause significant damage over a broad area; as a result, it became one of the costliest United States hurricanes at the time. The fourth tropical cyclone of the 1896 Atlantic hurricane season, it formed by September 22, likely from a tropical wave, before crossing the Caribbean Sea just south of the Greater Antilles. It entered the Gulf of Mexico as the equivalent of a major hurricane on the Saffir–Simpson scale, and struck the Cedar Keys—an offshore island chain that includes the island and city of Cedar Key—early on the morning of September 29 with winds of 125 mph . The area was inundated by a devastating 10.5 ft  storm surge that undermined buildings, washed out the connecting railroad to the mainland, and submerged the smaller, outlying islands, where 31 people were killed. Strong winds also destroyed many of the red cedar trees that played an important role in the economy of the region. No hurricane would hit this region of Florida with a similar strength until 2023.

The cyclone continued inland over the Suwannee River valley, causing widespread destruction in dozens of communities across interior northern Florida; in the hardest-hit settlements, intense winds left few trees or buildings standing. The hurricane razed 5,000 sq mi (13,000 km2) of dense pine forests in northern Florida, crippling the turpentine industry. Crops and livestock were destroyed, and thousands of individuals were left homeless. The storm killed at least 70 people in mainland Florida, while inflicting approximately $3 million (equivalent to $110 million in 2023) in property damage across the state. Speeding north, the hurricane ravaged southeastern Georgia and the Sea Islands. In Savannah, a 45-minute onslaught of fierce winds unroofed thousands of structures. Parks, cemeteries, and streets in the city were littered with fallen trees, and the Savannah River saw dozens of wrecked boats. At least 37 people in Georgia died. Strong winds and high tides battered southeastern South Carolina, ruining rice crops and peeling off roofs. The storm then tracked through mostly rural sectors of North Carolina and did significant wind damage in the Raleigh–Durham area.

Although the hurricane was weakening and transitioning into an extratropical cyclone late on September 29, its rapid forward movement contributed to high wind velocities across parts of the Mid-Atlantic states, with gusts approaching 100 mph (160 km/h). Additionally, torrential rains fell west of the storm’s track. In Virginia, cities and agricultural districts alike suffered extensive damage. Flash flooding in the Shenandoah Valley culminated in the failure of an earthen dam upstream from Staunton, unleashing a torrent of water that swept houses from their foundations and ravaged the town’s commercial district. In Washington, D.C., thousands of trees were uprooted or snapped, communications were severed, and localized streaks of violent gusts damaged many public and private buildings. The White House grounds were left in disarray. High tides in the Chesapeake Bay triggered flooding in coastal cities. In Pennsylvania, flooding rains and powerful wind gusts produced widespread destruction. Railroads in western parts of the state were plagued by washouts and landslides, while in southeastern areas, hundreds of barns were destroyed. The storm demolished a 5,390 ft (1,640 m) bridge over the Susquehanna River, while the Gettysburg Battlefield lost hundreds of trees, a few of which struck and damaged historical monuments. Strong winds extended as far east as Long Island. Heavy rainfall reached west into Ohio, and the hurricane’s extratropical remnants wrought havoc on shipping in the Great Lakes. The storm caused at least 202 deaths and wrought more than $9.6 million (equivalent to $352 million in 2023) in damage.

image

https://en.wikipedia.org/wiki/1896_Cedar_Keys_hurricane

Just as with Helene, Cedar Keys rapidly intensified over the Gulf, and then proceeded to cause massive devastation inland, through Georgia, the Carolinas, and up to New York. There were 115 deaths and 12000 left homeless in Florida alone. Cedar Keys was hit by a 10.5 ft storm surge, bigger than anything recorded during Helene. Nearby Yankeetown had an even bigger surge of over 12ft.

Unsurprisingly most of the Cedar Keys’ residential area and industry was destroyed. Helene by contrast left nothing like this sort of damage, something that cannot simply be explained away by more robust buildings.

Georgia also bore the brunt of the storm, with damage to plantations and rice crops, widespread destruction of homes and the complete clearing of dense pine forests east of Folkston. The storm was still wreaking havoc when it reached Virginia, and produced what still stands as the most severe windstorm in Richmond’s history.

Catastrophic flooding followed the storm on its pathway north, even as far as Ohio.

In total there were reckoned to be 202 fatalities.

Yet despite all of this, the 1896 hurricane was only rated as Cat 3, with winds of 125 mph. Remember that Helene supposedly had winds of 140 mph.

So how did the authorities arrive at their estimate of 125mph? Remember that in those days anemometers were useless for measuring hurricane speeds winds, even if you actually had one at the exact centre of the storm. Below is the Hurricane Research Division’s record of how they arrived at their conclusions. I have highlighted the part relevant to landfall:

image

image

https://web.archive.org/web/20110604063810/http://www.aoml.noaa.gov/hrd/hurdat/metadata_master.html

Hardly scientific!

The analysis by Partagas, which is referred to and which the latest analysis is based on can be read here, and is no better, mainly referring to newspaper reports.

Nowhere in any of their or the HRD analysis is there any mention of actual recordings of wind speed or central pressure. Hardly surprising, given that all happened in 1896.

Yet we are expected believe that Helene, with considerably less damage, both in Florida and inland, was a much stronger storm.

Sorry, I just don’t believe it.

via NOT A LOT OF PEOPLE KNOW THAT

https://ift.tt/25rUTZQ

September 28, 2024 at 12:01PM

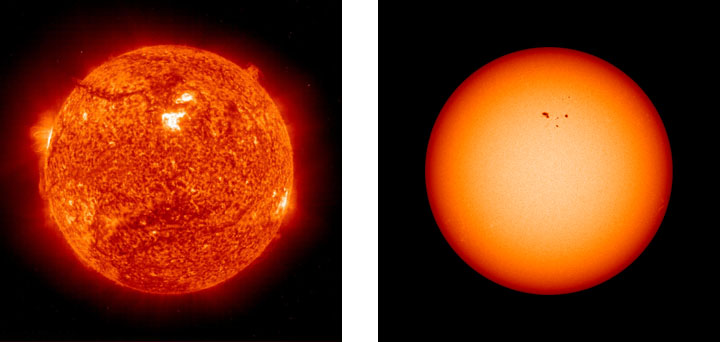
Climate Complexities: Recent Solar Storms May Have Promoted Cloud Formation

Sun, clouds and climate – a post from an EIKE reader

Image: NASA (public domain)

Posted by AR Göhring

In a conversation with the EIKE editorial team, our reader Garik Müller noted that recent solar storms have promoted cloud formation – which would contradict the Svensmark-Shaviv effect and the Forbush effect.

But the Earth’s atmosphere is known to be much more complicated than the computer models of climate researchers – solar radiation can also have a different effect under different circumstances.

A discussion article by Garik Müller

Question from EIKE:

When there is a lot of solar wind, the particles from space are deflected away from the earth, the Forbush effect. If there are fewer particles, there are fewer cloud nuclei. The recent solar ejections should therefore have reduced the clouds, nnless certain solar events produce particles that can penetrate the van Allen belt.

Garik Müller:

It is high-energy radiation that comes both from the cosmic realm and is emitted towards the Earth during certain solar activities. Usually the starting point on the sun points away from the Earth. This time, however, the Earth was directly in focus. Due to the cascade effect, the ionizing radiation reaches the troposphere.

The Forbush effect actually only works if the “solar storm” points towards the Earth at the same time.
If it is offset in time, it does not have such a strong effect.

However, the Svensmark-Shaviv effect, which I believe to be conclusive and correct after having studied it for a long time, is only the first stumbling block in events like this year and is far more strongly influenced by the sun. There was still little cloud cover until the beginning of June. As a result, we had higher global surface temperatures, which subsequently fell, as the evaporation rate over the oceans increased considerably, which in turn led to a partial fall in sea surface temperatures, especially in the Atlantic and Pacific.
After that, there was a period of increased solar activity, as I was able to learn from observations of a friend in Frankfurt. Whenever large-scale cloud formation began, the number of sunspots were considerably higher. This has also been the case recently. It has also been interesting to observe that the processes were always congruent in time.

If you then take the work of Zharkova, it seems striking that such events seem to accumulate towards the end of a solar maximum, which then often coincides with local weather phenomena such as the current one, which again raises many questions. It becomes unpleasant when the flow systems intensify the whole thing together with the topographical conditions.

The reactions from the climate hysterics are neither helpful nor appropriate. BBut then it becomes so mathematically complex that 99.9% of scientists can hardly describe it. Meticulous work would be necessary. This cannot be done using existing algorithmic models because the models would then crash.
This is the point where mathematics catches up with conventional theory. There is some work on this, but you won’t find anything about it without targeted research.

The idea came to me when I thought of my work on meson passages in this context. The theoretical foundations from this are very helpful for this topic.

More literature on this:

[1] Review of Particle Physics, C. Amsler et al., Physics Letters B667, 1 (2008)

[2] O.C. Allkofer, H. Jokisch, A survey on the recent measurements of the absolute vertical cosmic­ray muon flux at sea level, Il Nuovo Cimento A (1971-1996), Volume 15, Number 3, 1973, Pages 371-389.

[3] Thomas Hebbeker, Charles Timmermans, A compilation of high energy atmospheric muon data at sea level, Astroparticle Physics, Volume 18, Issue 1, August 2002, Pages 107-127.

[4] M. Fuidl, Kosmische Myonen in Schulversuchen, Johannes-Gutenberg-Universitaet Mainz, Institut fur¨ Physik, September 2003.

[5] C. Wiebusch, Astroteilchenphysik -Vorlesungsskriptum, RWTH Aachen, III. Physikalisches Insti­tut, Sommer 2010.

[6] S. Schael, Teilchen und Astrophysik -Vorlesungsskriptum, RWTH Aachen, I. Physikalisches Insti­tut, Winter 2008.

[7] W.R.Leo: Techniques for Nuclear and Particle Physics Experiments, Springer Verlag 1987

[8] J.Krieger, GNU Public License / wikimedia Commons https://ift.tt/P1xcAXK

[9] J.N. Crookes, B.C. Rastin, An investigation of the absolute intensity of muons at sea-level, Nuclear Physics B, Volume 39, 1 April 1972, Pages 493-508.

[10] B76D01 Photomultiplier Tube, ADIT.

[11] Christophe Dang Ngoc Chan, Angle solide definition, Wikicommons https://ift.tt/ZTqUbzk

[12] R. Haeusler, A. F. Badea, H. Rebel, I. M. Brancus, J. Oehlschlager, Distortions of experimental muon arrival time distributions of extensive air showers by the observation conditions, Astroparticle Physics, Volume 17, Issue 4, July 2002, Pages 421-426.

[13] Allkofer, O. C., Grieder, P. K. F., Cosmic Rays on Earth, Physik Daten, ISSN 0344-8401, 1984.

[14] Helios Dr. Bulle GmbH & Co. KG, Tea Boy Nr. 3334 -002 https://ift.tt/gMUBP8h

[15] S. Sciutto, COSMUS work group, AIRES Simulations https://ift.tt/9caf74D

[16] Auger Engineering Array Group, Pierre Auger Observatory https://ift.tt/IpdmOAt

[17] F. Schmidt, CORSIKA Shower Images https://ift.tt/InfeU5Q

[18] K.-H. Kampert and A. A. Watson. Extensive air showers and ultra high-energy cosmic rays: a historical review., European Physical Journal H 37:359-412 (August 2012). doi:10.1140/epjh/e2012-30013-x

[19] I. Allekotte et al., The Surface Detector System of the Pierre Auger Observatory , Nucl. Inst. Meth., vol. A586, pp. 409-420 (2008), arXiv:astro-ph/0712.2832

[20] J. de Mello Neto (for the Pierre Auger Collaboration), Studies of Cosmic Rays at the Highest Energies with the Pierre Auger Observatory, EPJ Web of Conferences(2014), doi: https://ift.tt/YJ6tQ82

[21] J. Bl¨ orandel, Cosmic rays from the knee to the highest energies, Progressumer, R. Engel and J.R. H¨ in Particle and Nuclear Physics, vol. 63, p. 293-338 (October 2009),https://ift.tt/4gVF5kT. 0725

[22] M.G. Aartsen et al., Observation of High-Energy Astrophysical Neutrinos in Three Years of IceCube Data, IceCube Collaboration, Phys.Rev.Lett., Volume 113, 2014 https://ift.tt/BCRkrT7

[23] Anne Schukraft, Search for a diffuse flux of extragalactic neutrinos with the IceCube Neutrino Observatory, Dissertation, Rheinisch-Westf¨alische Technische Hochschule (RWTH) Aachen, June 2013

[24] IceCube Collaboration, Evidence for High-Energy Extraterrestrial Neutrinos at the IceCube Detec­tor, Science, 22 November 2013, Vol. 342 no. 6161, DOI: 10.1126/science.1242856

Donate – choose an amount

via NoTricksZone

https://ift.tt/VWKADCB

September 28, 2024 at 09:42AM