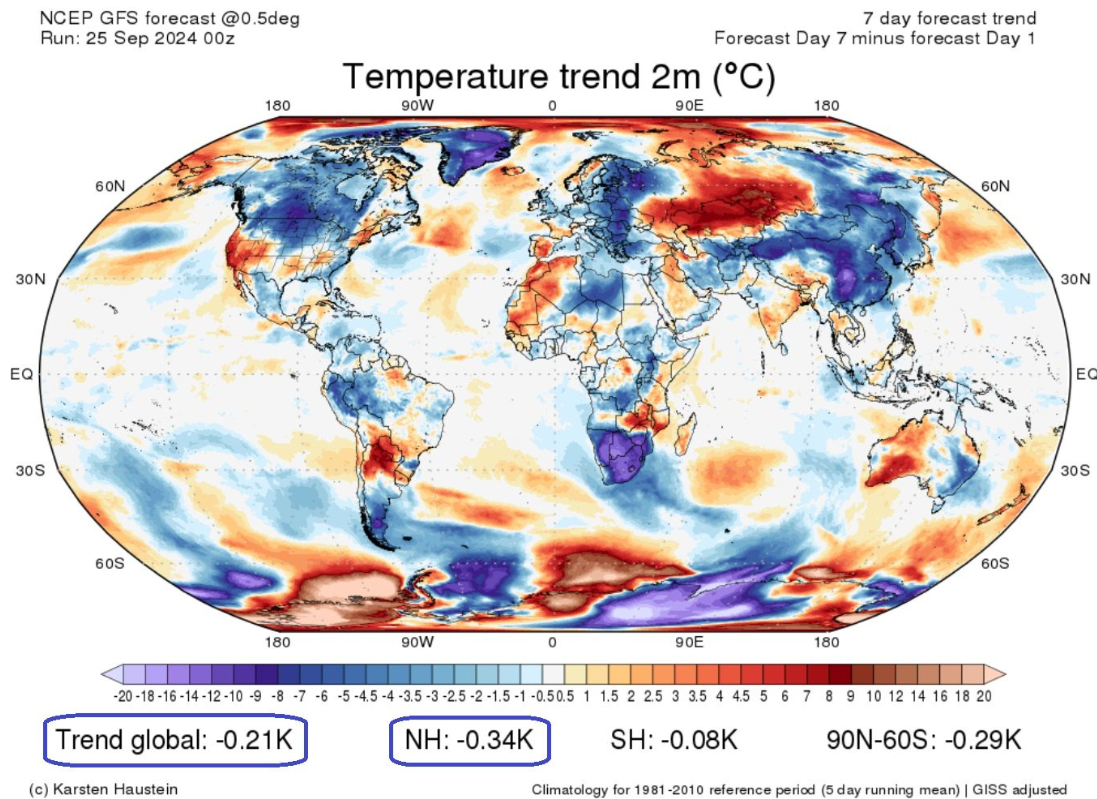
NCEP GFS 7-Day 2m Temperature Trend Run Sees 0.34°C Fall

 The GFS 7-day trend expects a strong cooling, especially in the northern hemisphere.

Hat-tip: Snowfan here

The 2m temperatures in the northern hemisphere are expected to fall by -0.34°C, which will also pull global temperatures down by -0.24°C. Source: GFS 7-day trend T2m Global:

Source: GFS-7-Tage-Trend T2m Global, Karsten Haustein

Donate – choose an amount

via NoTricksZone

https://ift.tt/S1AvnhM

September 25, 2024 at 09:06AM

Oh Noes! ‘West Antarctic ice sheet may disappear by 2300’

From the “we’ve heard it all before” department and the Dartmouth College Division of Modeled Unverifiable Predictions, comes this ho-hum scare story.

Dartmouth-led study compiles 16 models for refined projection of ice loss up to 2300

A Dartmouth-led study by more than 50 climate scientists worldwide provides the first clear projection of how carbon emissions may drive the loss of a large portion of Antarctica’s ice sheet over the next 300 years.

The future of Antarctica’s glaciers after 2100 becomes uncertain when looking at existing ice-sheet models individually, the researchers report in the journal Earth’s Future. They combined data from 16 ice-sheet models and found that, collectively, the projections agree that ice loss from Antarctica will increase, but gradually, through the 21st century, even under current carbon emissions.

But that consistency falls off a cliff after 2100, the researchers found. The models predict that under current emissions, ice in most of Antarctica’s western basins begins to retreat rapidly. By 2200, the melting glaciers could increase global sea levels by as much as 5.5 feet. Some of the team’s numerical experiments projected a near-total collapse of the West Antarctic ice sheet by 2300.

“When you talk to policymakers and stakeholders about sea-level rise, they mostly focus on what will happen up to 2100. There are very few studies beyond that,” says Hélène Seroussi, the study’s first author and an associate professor in Dartmouth’s Thayer School of Engineering.

“Our study provides the longer-term projections that have been lacking,” she says. “The results show that beyond 2100, the long-term impact for the regions most susceptible to sea-level rise become amplified.”

The researchers modeled how Antarctica’s ice sheet would fare under both high- and low-emission scenarios through 2300, says Mathieu Morlighem, a Dartmouth professor of earth sciences and a coauthor on the study. Dartmouth Engineering alumnus Jake Twarog ’24 also is a coauthor of the study and contributed as an undergraduate.

“While current carbon emissions have only a modest impact on model projections for this century, the difference between how high- and low-emission scenarios contribute to sea-level rise grows sharply after 2100,” Morlighem says. “These results confirm that it is critical to cut carbon emissions now to protect future generations.”

The timing of when Antarctica’s glaciers would start retreating varied with the ice-flow model the researchers used, Seroussi says. But the speed with which large retreats occurred once a rapid loss of ice began was consistent among the models.

“All the models agree that once these large changes are initiated, nothing can stop them or slow them down. Several basins in West Antarctica could experience a complete collapse before 2200,” Seroussi says. “The exact timing of such collapses remains unknown and depends on future greenhouse gas emissions, so we need to respond quickly enough to reduce emissions before the major basins are lost.”

The study could lead to further collaborative models that scientists can use to understand and resolve disparities in projections for regions with significant modeling uncertainties, or for the Greenland ice sheet, Seroussi says. Research and computing resources can then be focused on investigating outcomes that those multiple models predict as most likely.

“We’re learning from the community of scientists what is going to happen,” Seroussi says. “This collaboration means we have a better, more robust assessment of the uncertainty, and we can see where our models agree and where they disagree so that we know where to focus our future research.”

###


The paper:

Earth’s Future, DOI 10.1029/2024EF004561 

via Watts Up With That?

https://ift.tt/irIwhdb

September 25, 2024 at 08:02AM

Swingeing tariffs on Chinese EV makers threaten to wipe out Europe’s legacy companies

By Paul Homewood


It did not take a genius to work out that EU tariffs on Chinese EVs would quickly turn into a full scale trade war

.

 image

Few industries are as susceptible to the shifting sands of international policy on trade and protectionism as the automotive sector. And never more so than now with the transition to electric vehicles (EVs).

In leading from the front in their determination to phase out the internal combustion engine (ICE), policymakers in both Britain and Europe have got themselves into the most terrible mess.

Home-grown manufacturers have been left woefully uncompetitive against rampant Chinese competition, with hundreds of thousands of relatively well-paid jobs in Europe’s industrial heartlands now at high risk of redundancy.

Across the sector, vehicle manufacturers are warning of plunging profits, factory closures and job losses; a perfect storm of negatives is about to break, and one which with their lofty net-zero ambitions is almost entirely of the politicians’ own making.

For the Government, two related issues have come racing into view. Ministers might even find time to address them if they could for just a moment stop running around like headless chickens spouting platitudes on how terrible their economic inheritance is.

One is whether to follow the US and Europe into imposing swingeing tariffs on Chinese EV manufacturers before they entirely wipe out the Continent’s own legacy automotive companies.

And second, whether to persist with punishing mandates that the industry hasn’t a prayer of meeting for phasing out petrol and diesel vehicles and replacing them with shiny new all-electric alternatives.

Both on price and quality, European car manufacturers are streets behind their upstart Chinese competitors on EVs, yet the EU plans to go all electric by 2035 and is committed to heavy fines against companies that don’t meet thresholds for phasing out ICE models in the meantime.

Imposing tariffs might theoretically give Volkswagen, Stellantis and their like time to play catch up. That they ever will is obviously open to question, but regardless the European Commission has moved ahead with protections including provisional additional tariffs on Chinese producers ranging from 17pc for BYD to 36.4pc for SAIC.

Exquisitely, the level of punishment is linked to the degree of cooperation shown in the EU’s preceding nine-month anti-dumping investigation.

As on virtually everything of importance, Europe is furiously divided over the matter. Retaliatory action against EU member countries with big export markets in China is a certainty. A full-scale trade war, with damaging consequences for industries completely unrelated to autos, is threatened.

Things were due to come to a head this week, when EU member states were scheduled to decide, using qualified majority voting, on whether to make the new tariffs permanent.

At the time of writing, it didn’t look as if those opposed to the tariffs – which included Germany, Hungary and Spain – had sufficient support to be able to block them. Attempts to reach a negotiated settlement with China involving voluntary quotas also seemed to have stalled.

Barring a last-minute deal – or alternatively one of Europe’s major economies changing its mind – it seems likely that the tariffs will take formal effect, leaving the UK with the awkward choice of whether to follow suit.

https://www.telegraph.co.uk/business/2024/09/25/should-be-welcoming-chinas-ev-manufacturers/

via NOT A LOT OF PEOPLE KNOW THAT

https://ift.tt/HKausr5

September 25, 2024 at 07:55AM

Battersea Heliport DCNN 5023 – A suitable climate measuring point?

This image has an empty alt attribute; its file name is image-93.png

51.46958 0.17941 Met Office assessed as CIMO Class 5 AND “UNSATISFACTORY” Installed 18/5/2018

Obviously the above image is not of a Met Office weather station whose data is used to compile the historic temperature record – that would be totally absurd. It is in fact an image taken from a Met Office Station whose data is used to compile the historic temperature record………and shows its surroundings.

This is the location of Battersea Heliport Weather Station that was fully assessed for climate reporting purposes – it did not have to be assessed.

In such a precarious landing/take off site, even for highly trained helicopter pilots, it is clearly essential to have accurate site temperature, air pressure and wind readings continuously available from the site, not only for the safety of passengers and crew but also a significant part of central London. Nobody could have any problem with weather data recording at such a site. Surely though, everybody would consider such a site exceptionally unrepresentative of the natural environment, even asking the suitability for climate reporting would likely be met with “rolling eyes”.

A senior civil engineer who worked on elements of this site commented to me -“it’s surrounded on three sides by high rise and for about 10 km by hardstanding in every direction.  It simply can’t be being used for climate purposes.” He also provided the site imagery below to emphasise his point.

Astonishingly the Met Office chose to assess this site for World Meteorological Organisation Standards rating it in the lowest Class 5 and prone to up to 5 degrees celsius error margin. From Freedom of Information request –

Additionally they graded it by their own unique rating system as “Unstaisfactory”. Their latest release of gradings I obtained by Freedom of Information request is below..

There is no obligation on the part of the Met Office to assess stations against either of the above standards. Many stations simply are not assessed at all because their data is only for site specific and immediate purposes for instance such as Helicopter take offs and landings. Many aviation and military sites are not assessed as there really is no intent of using site data for anything other than local needs. So why was Battersea Heliport put through such testing for no logical reasoning – surely nobody intended to use such data for climate data reporting – or did they?

These are the CEDA ARCHIVE notes for a military Heliport known as “Plymouth: Kinterbury Point”. It clearly states –

“No MIDAS Open data are available from this station”

Even though recently installed in 2020 no data is publicly archived nor are any readings used for the historic temperature record. No problem.

In contrast the Battersea Heliport Archive readily offers daily readings to freely download

https://data.ceda.ac.uk/badc/ukmo-midas-open/data/uk-daily-temperature-obs/dataset-version-202407/greater-london/62084_battersea-heliport

It appears the Met Office have installed (in 2018) an aviation site(Battersea Heliport) for a private company in a totally inappropriate site that no rational person could ever consider as representative of the natural environment to use its aviation purposed readings to contribute to the historical temperature record……..Weird or purposeful?

via Tallbloke’s Talkshop

https://ift.tt/51LtVCD

September 25, 2024 at 05:50AM