Seattle Times Climate Lab Misinforms about Climate Change, Sea-Level Rise, and Seattle Flooding

From the Cliff Mass Weather Blog

Demonstrably false information, serious science errors, and continuing misinformation.  

Yes, we are talking about another Seattle Times ClimateLab article.  ClimateLab is sponsored journalism, whereby advocacy groups pay for “journalism”, which coincidentally supports the group’s positions.   

The story is about flooding in the South Park neighborhood of Seattle, a community built on the floodplain of the Duwamish River.   An area that has flooded regularly for millennia.  

The Seattle Times makes the unfounded claim that human-caused global warming is a major driver of the flooding….suggesting that the major flood of December 17, 2022, demonstrates that this neighborhood is “on the front lines of climate change“.   

The article states that South Park has to “brace for climate change” and by mid-century (2050) that the water level should rise by another foot.

As I will prove below, the Seattle Times claims are clearly contradicted by clear scientific evidence.  

Go back to the 1890s, and the South Park area was a mud flat the frequently flooded (see map from 1894 below.

As one would expect of the flood plain of the Duwammish, this area has flooded many times during the past 130 years– hardly requiring global warming, which only became significant in the 1970s and 1980s.

The recent Times article highlighted the major South Park flood of December 27, 2022.  This event brought flooding to the South Park area as water levels rose to 15 feet MLLW, the mean lower low water level, which represents the average of the lowest low water for each day, calculated over a 19-year period. 

The water was very high because of several factors occurring simultaneously:  a very large astronomical King Tide associated with the moon and sun being aligned during a favorable time of the year, very low and unusual atmospherc pressure (which caused water levels to rise), and heavy prior rain, that revved up the Dumaamish River.

None of these were associated with global warming.

The Seattle Times seems to think that the key element of the local sea level rise is a warming world. 

Don’t get me wrong. Global warming HAS caused water levels to rise very slowly, but so slowly that its effects are essentially in the noise level for big events like the flood in question..  

Let me prove this to you.  Below is the sea level trend at Seattle starting in 1900.  Note that sea level has been going up for a long time— including earlier periods (before 1970) when human-caused warming would be very small.

On average, Seattle’s sea level has risen about 2.09 mm (.08 inches) per year.  So over the past fifty years, a period where rising CO2 levels and associated warming became significant, the sea level in Seattle rose about 4 inches.

So perhaps 4 inches of the 15 feet of the extreme water level during that 2022 flood MIGHT be explained by human-caused global warming.

That is TWO PERCENT.  I repeat 2%.   So why in the world is the Seattle Times ClimateLab pointing its finger at global warming?   Such claims are contrary to data.

I think you know why.

But it is worse than that.  Considering the sea level was rising before human CO2 emissions were significant, how do we know that some of the recent rise was not natural?  In fact, that seems more likely than not.

And to add to the climate change hype, the Seattle Times suggests that Seattle’s sea level will rise another foot by 2050….25 years from now.  This is silly.

 Since there appears to be no acceleration of the sea level rise in Seattle during he past decades, let’s extrapolate the historical rate for 25 years.  You get 2 inches.  Still very small.

Go crazy, double that amount.  Still very small compared to astronomical and meteorological factors that are independent of global warming. 


Discover more from Watts Up With That?

Subscribe to get the latest posts sent to your email.

via Watts Up With That?

https://ift.tt/INPMp1G

June 9, 2025 at 04:05PM

Our Atmospheric Heat Engine

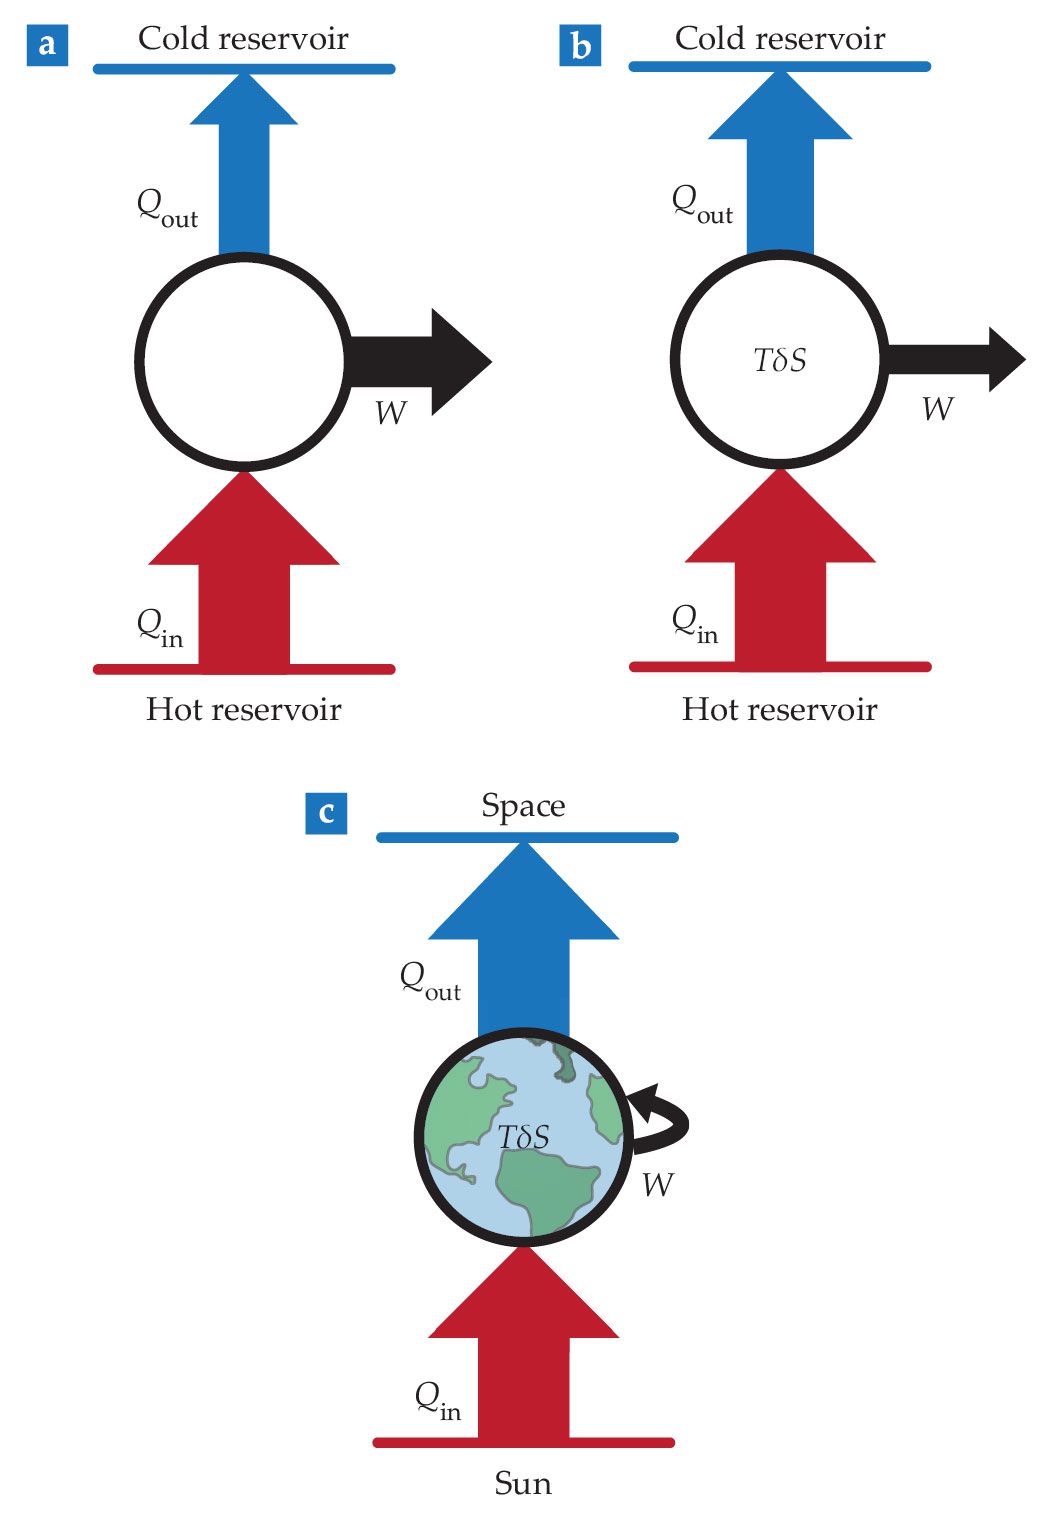
Climate as heat engine. A heat engine produces mechanical energy in the form of work W by absorbing an amount of heat Qin from a hot reservoir (the source) and depositing a smaller amount Qout into a cold reservoir (the sink). (a) An ideal Carnot heat engine does the job with the maximum possible efficiency. (b) Real heat engines are irreversible, and some work is lost via irreversible entropy production TδS. (c) For the climate system, the ultimate source is the Sun, with outer space acting as the sink. The work is performed internally and produces winds and ocean currents. As a result, Qin = Qout.

A previous post presented Michel Thizen’s description of gravity’s effect on the mass of air functioning as a climate thermostat. Some years ago Dr. Murry Salby wrote in detail about the troposphere operating as an heat engine and the stratosphere as a refrigerator. This post consists of excerpts from Salby’s textbook entitled Physics of the Atmosphere and Climate. The title is a link to pdf version of the book Salby (2012). Text in italics with my bolds and added images.

A closed system that performs work through a conversion of heat that is absorbed by it is a heat engine. Conversely, a system that rejects heat through a conversion of work that is performed on it is a refrigerator. In Chap. 6, we will see that individual air parcels comprising the circulation of the troposphere behave as a heat engine.  By absorbing heat at the Earth’s surface, through transfers of radiative, sensible, and latent heat, individual parcels perform net work as they evolve through a thermodynamic cycle (2.13). Ultimately realized as kinetic energy, the heat absorbed maintains the circulation against frictional dissipation. It makes the circulation of the troposphere thermally driven.

In contrast, the circulation of the stratosphere behaves as a radiative refrigerator.  For motion to occur, individual air parcels must have work performed on them. The kinetic energy produced is eventually converted to heat and rejected to space through LW cooling. It makes the circulation of the stratosphere mechanically driven. Gravity waves and planetary waves that propagate upward from the troposphere are dissipated in the stratosphere. Their absorption exerts an influence on the stratosphere analogous to paddle work. By forcing motion that rearranges air, it drives the stratospheric circulation out of radiative equilibrium, which results in net LW cooling to space. Salby (2012) p. 83.

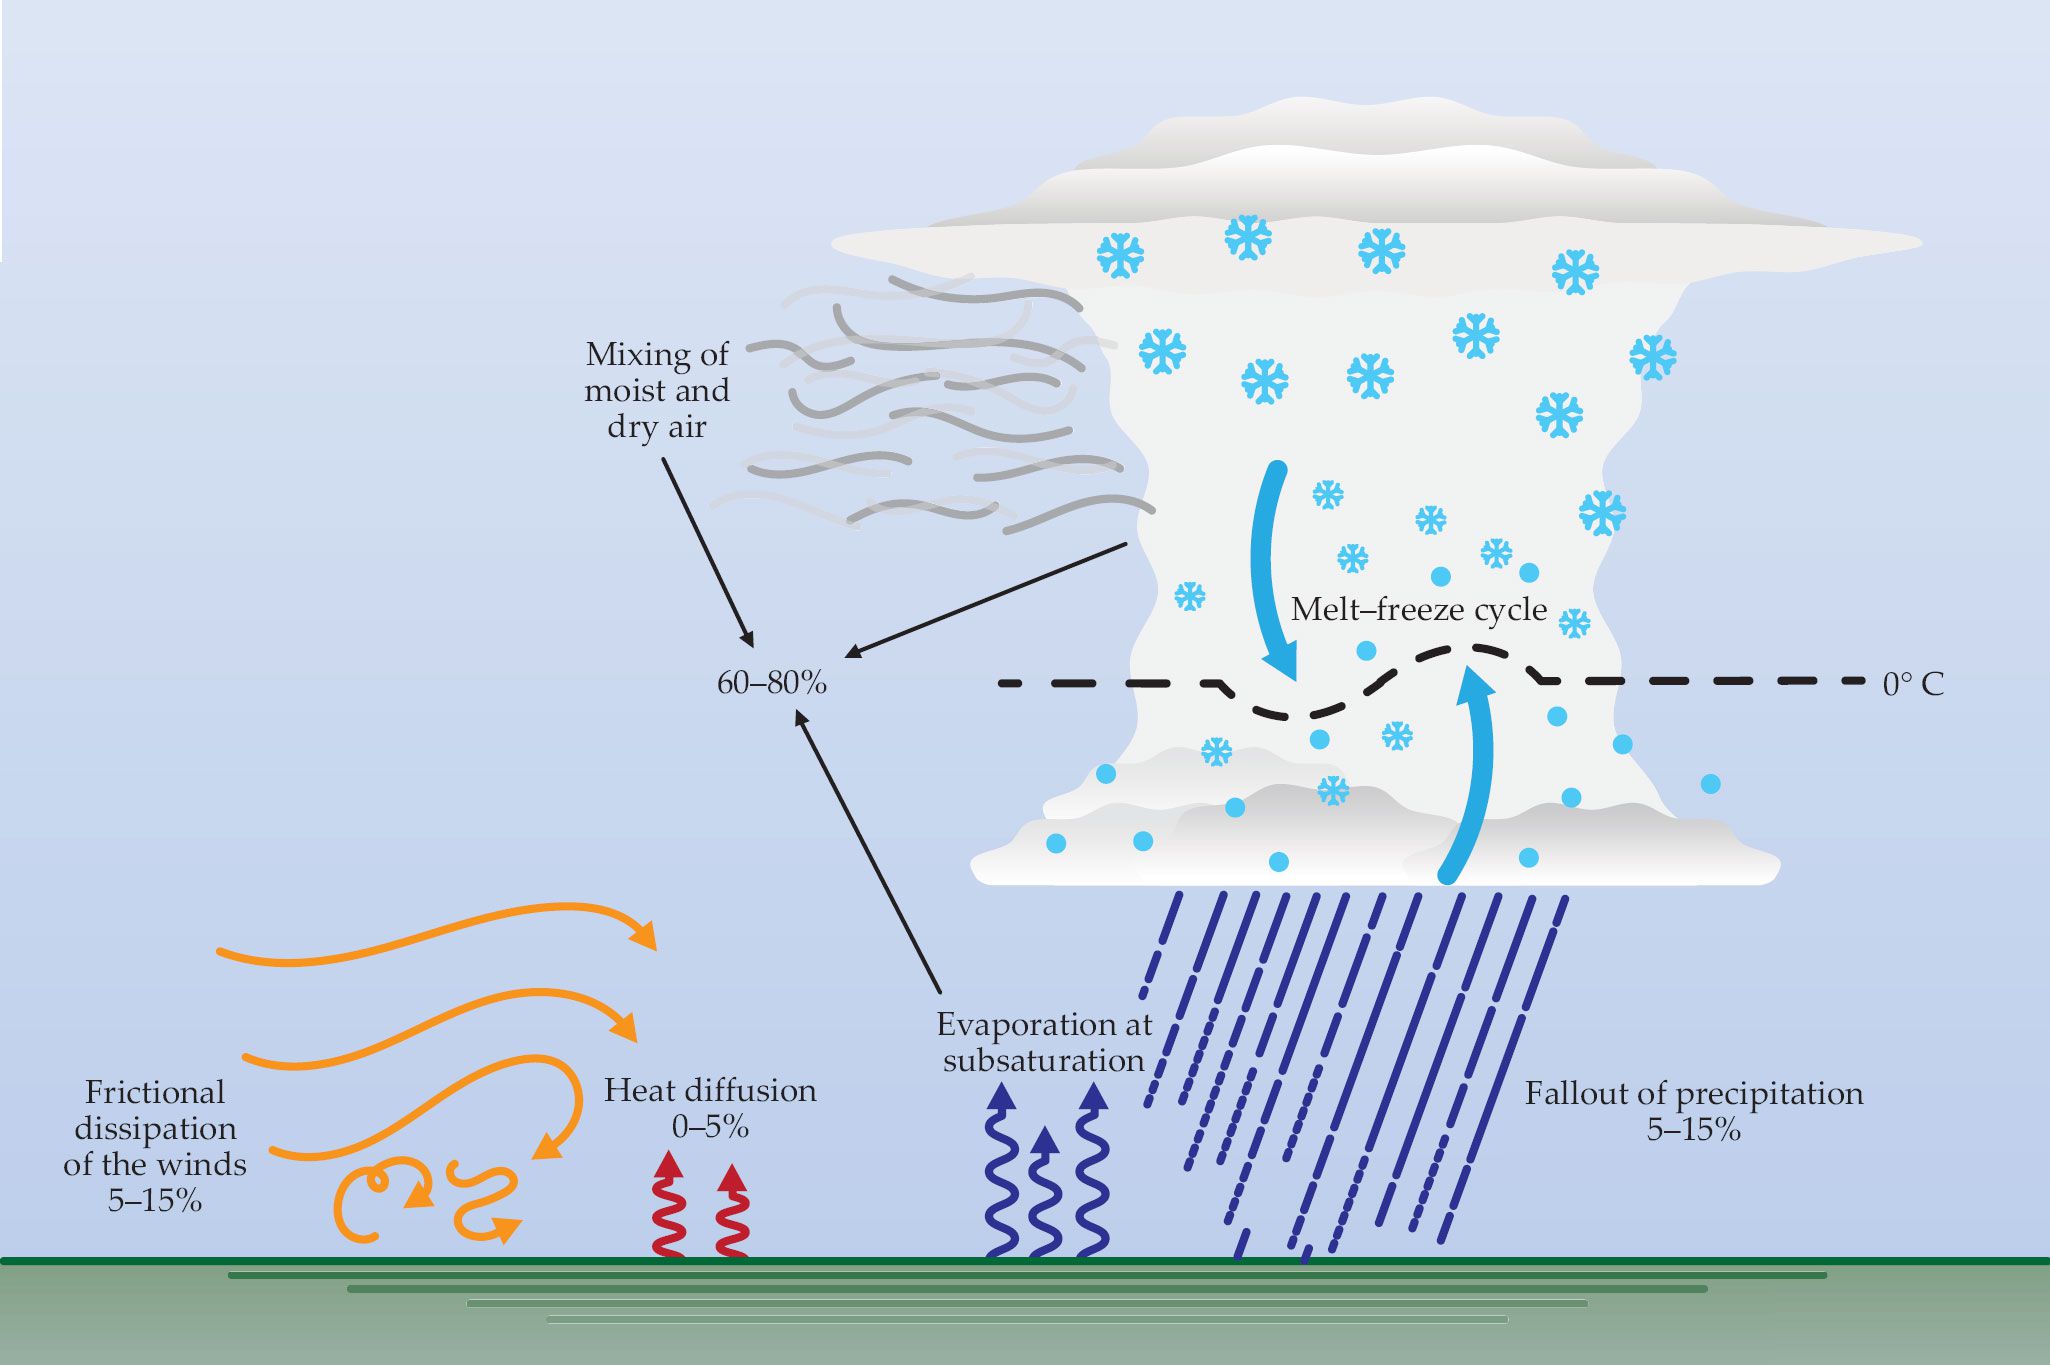
Irreversible processes in the atmosphere. Neglecting radiative processes (not shown here), the largest sources of irreversibility in the atmosphere are those associated with the hydrologic cycle: evaporation, the mixing of moist and dry air, and the melt–freeze cycle (60–80% collectively), and the fallout of precipitation (5–15%). Those contributions limit the entropy generated by frictional dissipation of the winds (5–15%), which ultimately places a limit on the work performed by the atmospheric heat engine in generating circulations. Percentages are estimated based on global climate simulations12 and idealized high-resolution simulations.8

Changes of thermodynamic state that accompany vertical motion follow from the distribution of atmospheric mass, which is determined ultimately by gravity. In the absence of motion, Newton’s second law applied to the vertical reduces to a statement of hydrostatic equilibrium (1.16). Gravity is then balanced by the vertical pressure gradient force. This simple form of mechanical equilibrium is accurate even in the presence of motion because the acceleration of gravity is, almost invariably, much greater than vertical acceleration of individual air parcels. Only inside deep convective towers and other small-scale phenomena is vertical acceleration large enough to invalidate hydrostatic equilibrium.

Because it is such a strong body force, gravity must be treated with some care. Complications arise from the fact that the gravitational acceleration experienced by an air parcel does not act purely in the vertical. It also varies with location. According to the preceding discussion, gravity is large enough to overwhelm other contributions in the balance of vertical forces. The same holds for the balance of horizontal forces. Horizontal components of gravity that are introduced by the Earth’s rotation and other sources must be balanced by additional horizontal forces. Unrelated to air motion, those additional forces unnecessarily complicate the description of atmospheric motion.  Salby (2012) p. 150.

The temperature of a dry air parcel decreases with its altitude at the dry adiabatic lapse rate. To a good approximation, the same holds for a moist air parcel under unsaturated conditions – because the trace abundance of water vapor modifies thermal properties of air only slightly. Under saturated conditions, the adiabatic description of air breaks down due to the release of latent heat that accompanies the transformation of water from one phase to another. Latent heat exchanged with the gas phase then offsets adiabatic cooling and warming, which accompany ascending and descending motion. Salby (2012) p. 162

Net heat absorption and work performed by individual air parcels make the general circulation of the troposphere behave as a heat engine, one that is driven thermally by heat transfer at its lower and upper boundaries. Work performed by individual parcels is associated with a redistribution of mass: Air that is effectively warmer and lighter at the lower boundary is exchanged with air that is effectively cooler and heavier at the upper boundary. This redistribution of mass represents a conversion of potential energy into kinetic energy. The conversion of energy maintains the general circulation against frictional dissipation. Salby (2012) p. 163

The idealized behavior just described relies on heat transfer being confined to the lower and upper boundaries of the layer, where an air parcel resides long enough for diabatic influences to become important. Between the boundaries, the time scale of motion is short. For motion that operates on longer time scales, typical of the stratosphere, the evolution of an individual air parcel is not adiabatic.

Radiative transfer is the primary diabatic influence outside the boundary layer and cloud. It is characterized by cooling rates of order 1 K day−1 in the troposphere (see Fig. 8.24). Cooling rates as large as 10 K day−1 occur in the stratosphere and near cloud (Fig. 9.36). (2012) p. 164

Unlike the troposphere, buoyancy in the stratosphere opposes vertical motion because, invariably, warm (high-θ) air overlies cool (low-θ) air. To exchange effectively-heavier air at lower levels with effectively-lighter air at upper levels, work must be performed against the opposition of buoyancy. The rearrangement of mass represents a conversion of kinetic energy (that of the waves driving the motion) into potential energy. Manifest in temperature, the potential energy is dissipated thermally through LW emission to space. (2012) p. 168

See Also

Fearless Physics from Dr. Salby

In reading the textbook, I found two main reasons why Salby is skeptical of AGW (anthropogenic global warming) alarm. This knowledgeable book is an antidote to myopic and lop-sided understandings of our climate system.

  1. CO2 Alarm is Myopic: Claiming CO2 causes dangerous global warming is too simplistic. CO2 is but one factor among many other forces and processes interacting to make weather and climate.

Myopia is a failure of perception by focusing on one near thing to the exclusion of the other realities present, thus missing the big picture. For example: “Not seeing the forest for the trees.”  AKA “tunnel vision.”

2. CO2 Alarm is Lopsided: CO2 forcing is too small to have the overblown effect claimed for it. Other factors are orders of magnitude larger than the potential of CO2 to influence the climate system.


Lop-sided refers to a failure in judging values, whereby someone lacking in sense of proportion, places great weight on a factor which actually has a minor influence compared to other forces. For example: “Making a mountain out of a mole hill.”

via Science Matters

https://ift.tt/ytLVwmH

June 9, 2025 at 03:14PM

Writtle DCNN3644 – Demonstrating a decline in standards

51.73351 0.42911 Met Office CIMO Assessed Class 4 Installed 1/1/1940

Although not a WMO reporting site, Tim Channon reviewed this site in 2013 and at the time judged the site as Class 4. It is worth considering Tim’s review in respect of the changes over just those intervening 12 years and the way the site’s standards have deteriorated. https://tallbloke.wordpress.com/2013/04/27/surfacestation-writtle/

Tim always accurately delineated circled areas around the screen as his original below from 12 years ago.

The site was getting close to having a serious shading problem from the south around to west with changing ground cover predominantly to the east. Compare that to this May 2024 image with bushes now growing even within the 3 metre radius downgrading the site to Class 5.

Surely at this point the Met Office inspection team would consider either moving the screen or getting the site owners (Writtle College – an agricultural training centre) to attend to the bushes to improve the situation. The compound is unusually large making it hard to see why the issue cannot be improved. The Streetview image adds the height dimensions showing this site is now unacceptable. Compare this image to the one Tim included in his report and the growth stands out notably.

The base of a Stevenson screen is normally set at 1.2 metres above ground level (though this one looks suspiciously low) which implies those nearby shrubs are over 2.5 metres tall causing multiple problems. The field use tracks also indicate (similar to nearby Cavendish) multiple passes and slow turnings of tractors which modern PRT sensors are readily able to quickly respond to any transient exhaust heat pulse. It is worth noting that World Meteorological Organisation guidelines are that PRT readings should be averaged over 5 minute periods – the Met Office does not meet this standard and only averages the PRT continuous output readings over a 1 minute period. Writtle was automated (thus converted from observer read Liquid in Glass instrumentation to PRT) in 2009.

It is highly notable that Writtle is now a regular star performer in the daily “extremes” stakes for both regional and national highs. Perhaps the increasing surrounding wind breaks are leading to more regular low wind speed Aitken Effects over heating the sensors. The same effect is noted at Heathrow where the Stevenson screen has become increasingly enclosed over time.

These “Daily Extremes” bring home an interesting point – here is yesterday’s offering.

So when is a “Region” not a “Region”? Who decided that Writtle in Essex just west of Chelmsford is not in the same “Region” of London and South East England but that Brize Norton nearer the Welsh border than London somehow is? This smacks of civil service regional administration areas rather than meteorological comparisons. The Met Office regional comparisons make for fascinating reading when taken out of this “extremes” context and into “averages”

The first four presumably comparative stations are indeed in the same defined region though quite how useful the Zombie Stanford-le-hope station that died in 1983 can actually be is open to much debate. Peculiarly Gillingham No 2 is NOT in that East of England region but still considered a good comparison despite similarly having closed down and died 44 years ago in 1981 and being 24 miles distant over the other side of the Thames Estuary. Perhaps by this logic, Langdon Bay (Dover) should have comparatives in Boulogne-sur-Mer …….maybe they do!

To add further confusion clicking on the Writtle data link gives averages for “Districts” with this one being in “East Anglia” and the Region being “England South” Confused? Well perhaps that is part of the intention. All that can be said is that perhaps the Met Office should “stick with the day job” look after their weather stations in a more appropriate manner and try to produce accurate meaningful data rather than neglecting them.

via Tallbloke’s Talkshop

https://ift.tt/qV1nCAw

June 9, 2025 at 02:40PM

French MPs from Left and Right vote to ditch “low emission zones” and bans on older cars

There is one less hyper-complex, pointless, car-hate program in the world

via CFACT

https://ift.tt/F6xzlZa

June 9, 2025 at 01:26PM