CLIMATE SCAREMONGERING ON CROP YIELDS

Organisations, like Carbon Brief only exist as a result of funding from rich donors who push the climate scare and so they obey their paymasters and push out one-sided stories. Unfortunately for them they are easily debunked by the data, as in this case.

 Global wheat yields would be ‘10%’ higher without climate change | NOT A LOT OF PEOPLE KNOW THAT

via climate science

https://ift.tt/WHvjMJQ

June 7, 2025 at 03:42PM

Delusional Business Council of Australia Thinks AI can be Powered by Renewables

Essay by Eric Worrall

h/t JoNova / David – “… we must seize the opportunity …”

Australia has what it takes to lead in AI

05 June 2025

This opinion article by Business Council of Australia Chief Executive Bran Black was published on Capital Brief on 3 June 2025.

One narrative that dominates many conversations around AI in Australia is that we are most likely to be a passive recipient of global technology. An “AI taker” rather than “maker”, as UK policymakers have termed the distinction.

But this pessimistic assumption fundamentally discounts some of our greatest national advantages when it comes to the application of new technology.

We are also ideally placed to become a regional hub for AI infrastructure. Australia can host world-class data centres powered by renewable energy, helping global and local organisations train models securely and sustainably.

With investment, these facilities can also serve as the backbone for sovereign AI capabilities, supporting industries from mining and agriculture to healthcare and advanced manufacturing.

Read more: https://www.bca.com.au/australia_has_what_it_takes_to_lead_in_ai

This claim AI can be powered by renewables flies in the face of evidence that green tech giants are rushing to dump green energy commitments, in their desperation to stay relevant and competitive in the AI gold rush.

Microsoft went straight for nuclear power for their AI

Facebook is building a gas powered generator;

Google was recently accused of greenwashing, they appear to be quietly purchasing fossil fuel capacity to power their AIs;

Why did these former big tech green champions ditch renewables and go straight for serious energy solutions? The reason is AI is a cloud based service, where operational costs are dominated by the cost of energy. Anyone selling AI capacity has to at least match the price of comparable AI services offered by China and Asia. Energy prices in China and Asia are really low – especially I suspect for businesses which are considered by China to be a strategic national priority.

No serious player believes AI can be powered by anything other than the most concentrated, reliable energy sources available. A few of them are making noises about exploring the options, but actions speak louder than words.

There will be some Aussie based AI, in sensitive applications such as the Australian military, where security matters more than cost. But so long as Australia embraces green delusions over reality, we Aussies will be stuck in the slow lane. There will be Aussie breakthroughs, we Aussies are pretty good at high tech. But the bulk of those Aussie AI innovations will end up running on other people’s computers, for lack of the affordable energy required to create a genuine Aussie AI presence.

On our current delusional green trajectory, Australia, for all our world class energy and mineral resource abundance, seems doomed to miss the AI boat. Australia’s irrational green energy policies more than justify that boardroom pessimism the BCA acknowledged in their article.


Discover more from Watts Up With That?

Subscribe to get the latest posts sent to your email.

via Watts Up With That?

https://ift.tt/Bs8uRCt

June 7, 2025 at 12:05PM

More Lying About Carbon Capture

Carbon capture tech is pie-in-sky impractical, but was weaponized against coal-fired power plants by requiring CCUS as though it were proven effective and profitable.  Just The News reports Biden’s EPA hid comments from Dept. of Energy that undermined key part of EPA power plant rule.  Excerpts in italics with my bolds and added images.

The Clean Power Plan 2.0 was supported by a finding that carbon capture
technology had been “adequately demonstrated.” The EPA sought and
got commentsfrom the DOE, which disputed that “demonstration.”
Somehow those comments never made it into the administrative record.

It appears that the Biden-Harris administration hid comments that would have undermined its Clean Power Plan 2.0 rule (CPP2), which the Trump administration is currently reviewing. The EPA had sought comments from the Department of Energy’s National Energy Technology Lab (NETL) on the efficacy of carbon capture technology prior to proposing the rule. These comments, which were somehow scrubbed from the administrative record, disputed a key claim the rule is based on. Those missing comments, a legal expert says, could provide a basis for the rule’s repeal.

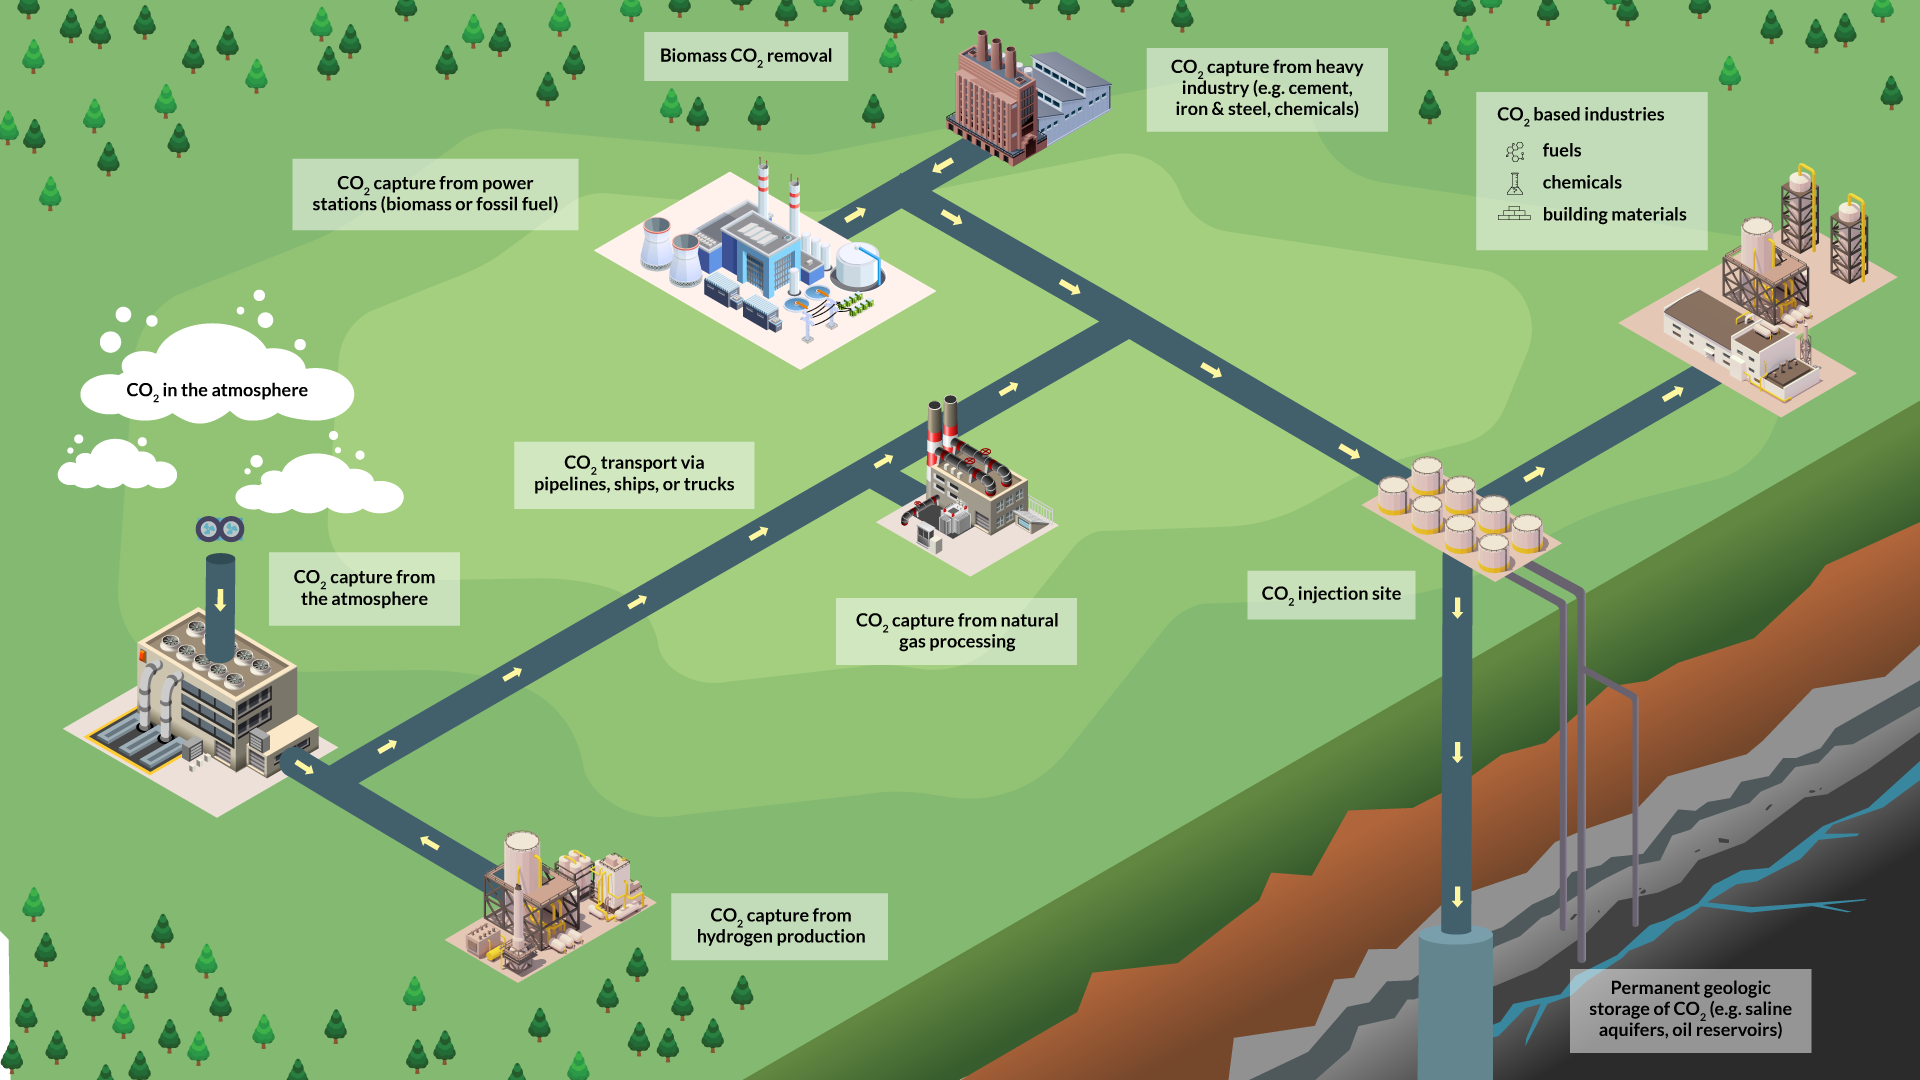
The CCP2 requires all coal plants to install carbon capture technology by 2039, which captures and stores emissions in underground geological formations. It also requires new natural gas-fired power plants to install the technology, with requirements starting in 2032. Experts warned the rules would drive up electricity costs and destabilize the grid by disincentivizing reliable power from coal and natural gas in favor of intermittent wind and solar power.

The Clean Air Act authorizes the EPA to develop new emissions standards, but those standards must be achievable at a reasonable cost. The technology required for compliance must also be adequately demonstrated. Documents obtained by Just the News show that the EPA formally sought comments from NETL in March 2023 on its soon-to-be proposed rule, which was put out for public comment the following May.

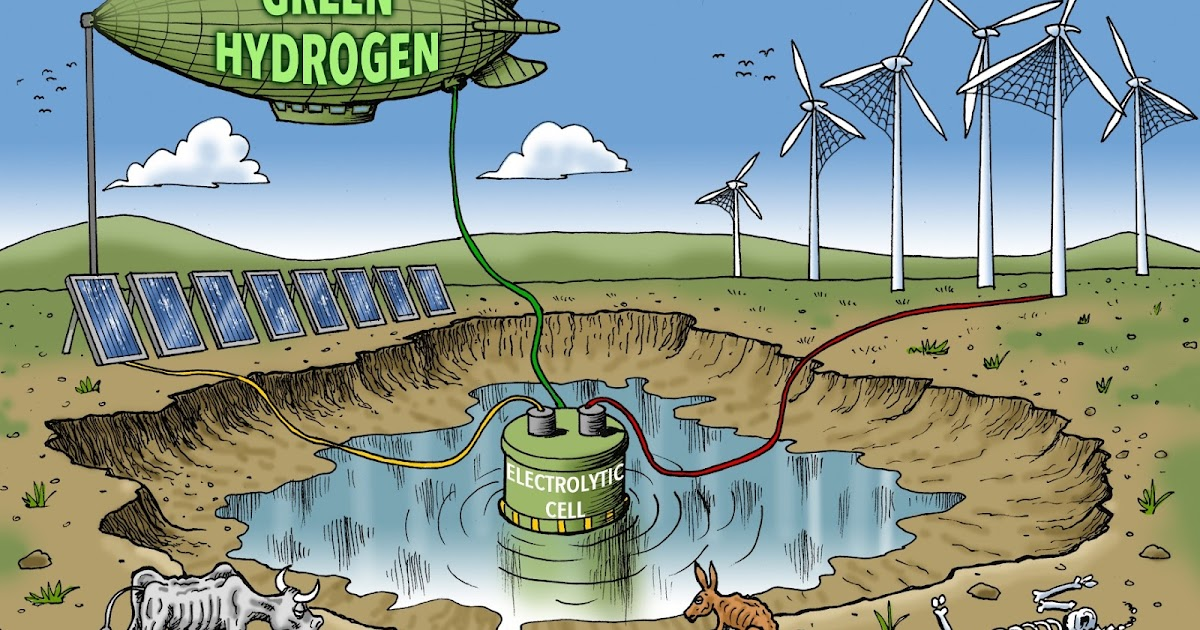
The proposed rule allowed for two technologies — hydrogen and carbon capture and underground storage (CCUS) — to meet the emissions standards on fossil fuel-burning power plants. Comer’s letter quotes two unnamed authors expressing that neither technology was viable.

Hydrogen was removed from the rule when it was finalized in April 2024. Carbon capture technology, however, was part of the final rule, even though the comments from one unnamed NETL author stated that:

“CCUS remains prohibitively expensive even after use of funds or tax credits made available through the Inflation Reduction Act.”

The EPA based its determination that CCUS was “adequately demonstrated” on the performance of the Boundary Dam Unit #3 (BD3), which is a Canadian coal-fired power plant fitted with carbon capture technology. An April 2024 report by the Institute for Energy Economics and Financial Analysis called the project an “under-performing failure.” Despite $1 billion CAD spent on the project, it was, as of April 2024, capturing far less than the 90% originally promised. Its capture rate through the end of 2023 was just 57%, which was 63% of the 90% promised, the report found.

Comments from NETL engineers, according to the GOA’s records request, state that “the ongoing operating performance of the same BD3 demonstration project is being, once again, misconstrued as having provided sufficient justification for claiming satisfactory performance to allow the technology to be considered ‘adequately demonstrated.’”

Carbon capture at Boundary Dam 3 still an underperforming failure

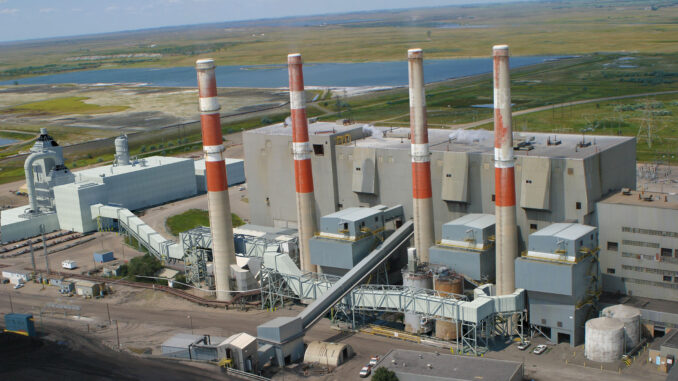
To be considered a success, a carbon capture project must capture all or almost all CO2 produced by the facility (power or industrial plant) to which it is attached and must do so for decades. Stantec photo by Kevin Ross.

Another comment states that BD3 only approached the 90% promised target for two months over a period of 8 years and three months. Another comment states that after 8 years and three months “of demonstration, such failure to meet negligible standards for emissions limitations, over a full-year period ending less than one year ago, argues strongly for not considering BD3 as a credible basis for Best System of Emissions Reduction and ‘adequate demonstration’ of the related technology.”

“These comments were sanitized at some point in this process and were not included in NETL’s and/or DoE’s comments to EPA, which made their way into the administrative record,” according to the GOA’s record request.

An EPA spokesperson told Just the News that the EPA, as part of its reconsideration of the CCP2, is developing a proposed rule, which will be published once it has completed an inter-agency review and been signed by EPA Administrator Lee Zeldin.

“Many have voiced concerns that the last administration’s replacement for that rule is similarly overreaching and an attempt to shut down affordable and reliable electricity generation in the United States, raising prices for American families, and increasing the country’s reliance on foreign forms of energy,” the spokesperson said.

via Science Matters

https://ift.tt/XDZqFGo

June 7, 2025 at 09:46AM

Tropical timings – the solar barycentric orbit


With the emphasis on timings, analysis of the solar barycentric orbit (SBO) can be summarised as follows:

Due to the motions of the four giant planets, Arnholm’s solar simulator shows us that the Sun’s motion around the barycentre of the solar system consists of alternate loops and arcs (image, right).

Broadly speaking, a Jupiter-Saturn conjunction occurs halfway round every arc of solar motion, and a J-S opposition halfway round every loop.

After three J-S cycles (each of conjunction + opposition) on average nearly every 20 years, three loops and three arcs of solar barycentric motion have been completed. We observe:
3 loops of 360° = 1080°
3 arcs of 240° = 720°
Sum of those = 1800° = 5*360°
Therefore the mean period of 3 J-S = 5 SBO (as a mean value).

In practice the SBO can be quite variable in length but the mean value is very close to, but slightly greater than, the Jupiter orbit period as we show below.

From our recent post on Jupiter-Saturn timings:
67 Jupiter orbits = 40 J-S conjunctions
3 J-S = 5 SBO (see above)
67*3 (201) J = 40*3 (120) J-S = 40*5 (200) SBO.

The difference of 1 (201-200) between the Jupiter orbits and the solar barycentric ones defines the cycle of 2383~ tropical years shown in that post (including screenshots from the simulator). A mean solar barycentric orbit should therefore take:
201/200 * J orbit (83/7 TY) = 11.916428 tropical years.

NB due mainly to the combined influence of Uranus and Neptune orbits, or sometimes the absence of it, the period of any one SBO can vary by as much as 20% (+/-) from the mean value, or occasionally a bit more. However the long-term average shouldn’t be affected.

This can be checked simply by counting the orbits, i.e. one per every 360° of solar barycentric motion, on the solar simulator over the period of 9 J-S conjunctions or ~179 years. This follows from our earlier calculation: 3 J-S = 5 SBO (as a mean value), so 3*3 J-S = 5*3 = 15 SBO.

A better idea is to use the Jose cycle (9 J-S), a period of nearly 179 years when there should be 15 SBO per cycle with little variation of the total period length.

The 15 SBO figure was known in science papers and articles at least as far back as the 1980s, as this article extract (right) by former NASA researcher Dr. Jane Blizard shows.

(NB what the author calls ‘three small loops’ are in fact three arcs, on the simulator and in reality.)
– – –
Image: Solar barycentric motion [credit: Wikipedia]

via Tallbloke’s Talkshop

https://ift.tt/eQotdmI

June 7, 2025 at 09:39AM