Climate Change Myths Part 1: Polar Bears, Arctic Ice, and Food Shortages

.
John Stossel

Climate zealots tell us the end is near. It’s the era of “global BOILING!” says the UN Secretary General.

Climate alarmists say the Arctic will soon be ice-free and cities will be underwater!

But what do the facts say?

In order not to miss the next video from Stossel TV, sign up here: https://johnstossel.activehosted.com/f/1

The facts say that the climate change fanatics’ catastrophic claims are wrong.

In this video and the next, we’ll debunk 7 myths about climate change.

First up: melting ice, polar bear extinction, and climate change famines.


Transcript:

The Era of Global Warming Has Ended

The era of global warming has ended. The era of global boiling has arrived. Global boiling! The world’s doomed, I’m told. We’re in the sixth mass extinction right now. I only wish someone could have warned us about this apart from every scientist for the last 50 years.

[Applause]

Every scientist agrees. But here’s the thing: they don’t. Well, yes, they agree that the climate’s warming. Climate changes. But scientists don’t agree on the catastrophic claims activists and the media make. The icebergs are melting, the coral reefs are dying, and no one is helping. If we don’t stop the sea level rising, millions of people will be in danger.

In this video, and the next, we’ll look at seven myths about climate change, starting with the great polar ice sheets, which are melting faster than many scientists had anticipated. If global warming continues at the present rate, then the Arctic could already be ice-free by the summer of 2030. That’s Myth 1: The Arctic will soon be ice-free.

We don’t have decades. We hardly have years. These glaciers are on the brink. Some are already past the point of no return. If the entire Greenland ice sheet was lost, sea levels would increase by seven meters. That’s 22 feet. At just six feet, one storm surge could leave London underwater, says this BBC documentary. This could happen this century, they say. But is the ice really melting that fast? No.

As we exit ice ages, you should expect some ice melt, but it’s not happening at nearly the catastrophic pace that they claim. Heartland Research Fellow Linnea Lueken researches environmental threats. She points out that studies on Arctic sea ice don’t show a catastrophic decline. Although ice has melted, it’s really leveled off in recent years.

A lot of the time when you are looking at these very alarming images, it seems like, where’d all the ice go? There’s no ice; it’s all these walruses laying out on a stony beach. They should be on big icebergs. Well, it’s because it’s the summertime, and in the winter, it all comes right back to where it was before. All of it? In recent years, yeah, all of it. For the past 20 years, it’s been largely stable.

And anyway, this is just sea ice, ice in the water, not the total amount of ice in the Arctic. Almost all the Arctic’s ice is on land. And this is the trend line for that ice. You can barely see any decline. Compared to the amount of ice that’s in the Arctic, it is like a grain of sand on the beach. It is so minuscule compared to the amount of ice that’s there that it doesn’t even show up on a trend chart when you plot it.

[Glacier collapsing]

It’s so frustrating. Media keep interviewing “experts” who claim we still see an ice-free Arctic by the middle of the century. Zealots have predicted doom for years. There is a 75% chance that the entire north polar ice cap, during some of the summer months, could be completely ice-free within the next five to seven years. Well, those years have long passed. Nobody calls him on it. They absolutely should be calling him on it.

A lot of these kinds of claims are based on what computer models are projecting. And they pick the ones that are alarmist. Oh, absolutely. Well, those are the ones that generate headlines, right?

Here’s another myth that generates headlines: Arctic polar bears are facing near-extinction by the end of the century. Imagine your family disappearing. It’s happening to polar bears right now. That’s Myth 2: Polar bears are going extinct.

[Laughs]

This is the worst one. Polar bears have increased their populations. Environmental groups ignore that increase to sucker you into giving them more of your money. “Don’t give up on polar bears. Don’t give up on threatened species. Your support can help Environmental Defense Fund save the polar bears.” These environmental groups are really being sleazy. Absolutely, because the data is right there. It’s not hard to find out that polar bears are fine. Finding some sick polar bear out there to take a picture of does not indicate the health of the species.

So, polar bears aren’t going extinct. But I’m told we might. The U.N. is warning of mass extinctions and food shortages within this century if global warming continues. Climate change could create a massive global food shortage. That’s Myth 3: Our changing climate is already making it more difficult to produce food.

There is no claim less true. Agricultural output keeps setting record highs. Food production has skyrocketed even amid the modest warming of the past 100+ years. Extra carbon dioxide is good for food production. Well, we inject CO2 into greenhouses for a reason. It’s because it helps to fertilize plants for faster and better growth. And NASA data show that the earth has significantly greened over the past couple of decades. And that, NASA even attributes to increased carbon dioxide fertilization.

As the climate has warmed, the world experienced the biggest drop in hunger and malnutrition ever. But climate activists don’t tell people that. The United Nations says Madagascar is on the verge of experiencing the world’s first climate crisis famine. Climate crisis famine? No! Madagascar’s problems are mostly caused by bad governance, corruption, and cronyism, not climate change.

But whenever there’s a food shortage, or even when prices rise, the media blame climate change. “Food shortages, driven by the effects of climate change. We’re going to see starvation and famine on multiple continents at the same time.” When coffee prices rose, The New York Times blamed “devastation that climate change wrought.” But since the 1990s, global coffee production has increased by 82%. The Times focused on a brief decline in Honduras. But even there, coffee production since 1990 is up more than 200%.

It does not mean that there is a long-term climate issue if you have one bad year. But The New York Times acts like it does. It absolutely does not. And they get egg on their face when you look at the historic data and you see they have been setting records for coffee production. But they never apologize. They never say, “Oh, we got this wrong.” No, and even if they did have a retraction, the damage is already done. The false report already went out.

Alarmist media and environmental groups never apologize. They keep predicting doom. And when they’re wrong, they just move on to the next scare. Like this one: It’s climate change creating infernos larger than ever. That’s just not true.

My next video will cover that and three more myths about our warming planet.

[Swoosh]

Thanks for watching. To make sure you get that next video, subscribe and hit that notification bell.

[Music]


Discover more from Watts Up With That?

Subscribe to get the latest posts sent to your email.

via Watts Up With That?

https://ift.tt/nB0Dujx

April 24, 2025 at 08:07AM

TEST

Test Post Only

via NOT A LOT OF PEOPLE KNOW THAT

https://ift.tt/Pl4Eo7i

April 24, 2025 at 07:35AM

BBC Prefer Propaganda To Facts

via NOT A LOT OF PEOPLE KNOW THAT

https://ift.tt/iV2mjQr

April 24, 2025 at 07:33AM

Eskdalemuir WMO 03162 – One of the UK’s Flagship premium quality sites?

55.31515 -3.20625 Met Office CIMO Assessed CLASS 4 Elevation 236 metres amsl. Installed 1/1/1908

“Monday, August 5, 2019

Eskdalemuir Observatory – Centennial celebrations

The World Meteorological Organisation (WMO) has recently awarded Eskdalemuir Observatory Centennial Observing Station status. The WMO issues this status to nominated stations that have provided long-term, high-quality climate records that tell current and future generations about climate variability and trends.“

Eskdalemuir Observatory is owned by the Natural Environment Research Council (NERC) and operated by the British Geological Survey (BGS). Eskdalemuir Observatory is part of the UK Met Office official observation network and the data that it provides is available in WOW. The observatory is also part of the Global Climate Observing System(GCOS); one of only 8 observing stations in the UK incorporated into this important climate monitoring network (Stornoway, Aldergrove, Waddington, Rothamsted, Camborne, Lerwick, Eskdalemuir and Shawbury are all classed as GCOS surface network stations).”

………………………………………………….

All the above comes from the Met Office’s own “Weather Observations Website” blog. Time to evaluate those claims.

Eskdalemuir is a small village in Dumfries and Galloway noted for two well known features, the BGS Observatory (that also hosts the Met Office weather station) and the nearby Kaygu Samye Ling Monastry which is the largest Buddhist community in Scotland. It is a site particularly noted for being very cold, wet and windy – points emphasised by the Royal Meteorological society in their review of the station. As a higher altitude and exposed Scottish site it is only representative of its immediate surroundings.

The Met Office puts great emphasis on the quality of its weather station there and affords it very extensive coverage on its web pages as below.

“Eskdalemuir Observatory Station

Eskdalemuir Observatory was established in 1908 to record geomagnetic observations. Previously these records had been made at Kew but the new electric tramways had started to affect the instrument readings. Initially the site was run by the National Physical Laboratory but it passed to the Meteorological Office in 1910. At that time it was thought that meteorology and geomagnetism were closely linked and so the site started to focus on a range of meteorological observations, becoming a first-order climatological and synoptic station. In May 1968 overall control passed to the Natural Environment Research Council (NERC) but the Met Office kept staff on site to continue the synoptic and climatological data. The British Geological Survey now operate the site on behalf of NERC. Records for Eskdalemuir are held in Scotland with climate records held at National Records of Scotland.

Early observations were made on Mondays to Saturdays, and gained the name ‘Hogg Obs’ after the observatory mechanic, Mr W J Hogg, who took the observations for a period of 21 years between 1937 and 1958. Observations were historically sent by telephone, this resulted in the observatory having one of the first telephones in the Valley, it was also one of the first to have motorised transport. Early staff were issued with 2 pairs of Wellington boots and one oilskin coat for protection against the elements.

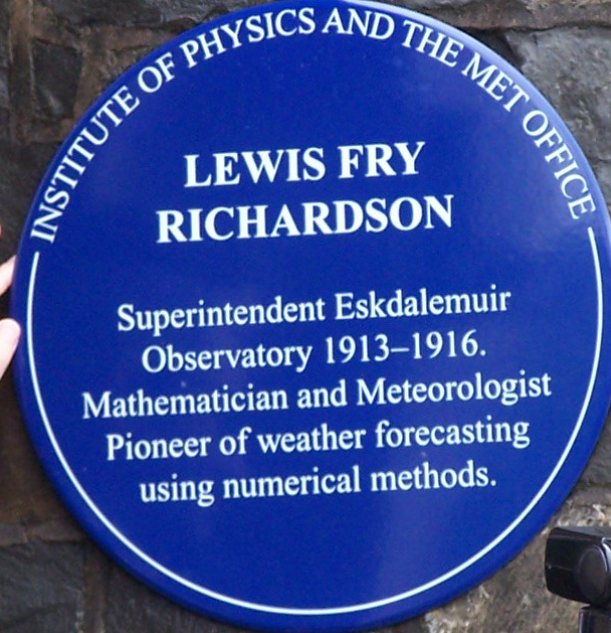
The most well-known member of Eskdalemuir staff was Lewis Fry Richardson who was employed as Superintendent in 1913 to oversee the running of the observatory and to further his research into methods of numerical weather prediction. In his book ‘Weather Prediction by Numerical Process’ he established the science of numerical weather prediction almost 50 years before the invention of a computer capable of actually carrying out his calculations.

The blue plaque situated at the observatory, which celebrates the pioneering work of Lewis Fry Richardson

Evacuee children and RAF officers were housed in the observatory from 1938 to 1945.  During this time the wives of staff were given meteorological training in case their husbands were called out on Home Guard or air raid protection duties.

All the original weather diaries are still in the library at Eskdalemuir and much of the historical equipment is still in situ.

These days observations from Eskdalemuir are largely automated, in fact the site hosted the first automatic weather station in the Met Office. Observations from Eskdalemuir do still contain manual data from 0800 to 1700 Monday to Friday, but are produced automatically at all other times.  Met Office staff on site today are responsible for a number of duties including the quality control of all UK METAR and synoptic observations, together with synoptic observations from around the world. 

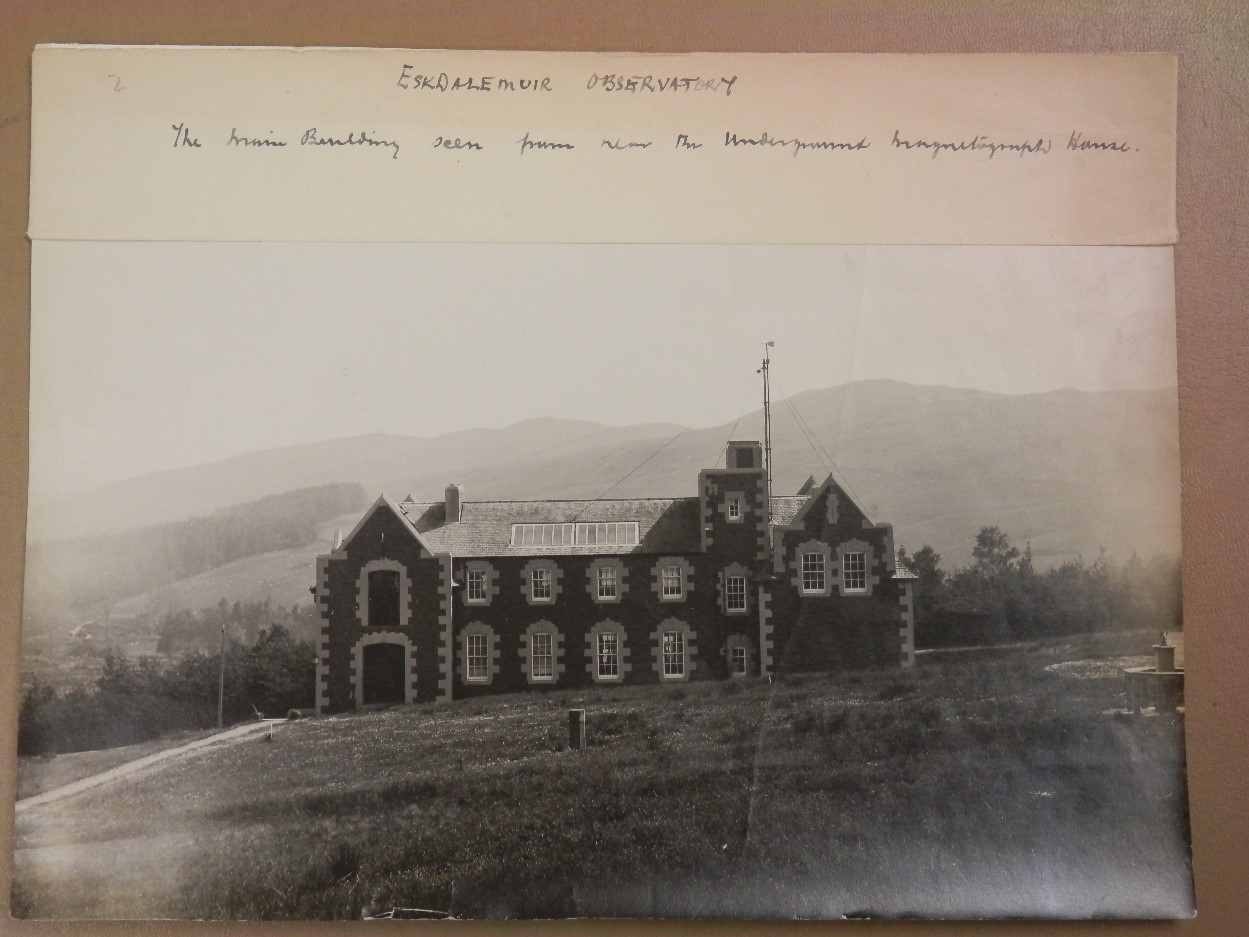
The main building of Eskdalemuir Observatory in the early 20th century. The Campbell Stokes Sunshine recorder can be seen on the far right of the image and there are wind vanes on the roof. “

………………………………………………………………………………………………….

Eskdalemuir has long history, is very well equipped indeed with permanent staffing plus it is one of just a selected eight stations to represent the entire UK in the GLOBAL Climate Observing System – with such a CV it must be an excellent site…….mustn’t it?

Leaving aside the CIMO regulations for a while, below is a refresher of how the Met Office themself describes their own “stringent” requirements.

“Weather station sites

Weather station sites are selected to ensure that the observations are representative of the wider area around the station and not unduly influenced by local effects.

Ideal site

  • Level ground.
  • No trees; buildings, or steep ground nearby that might influence the measurements.

Undesirable site

Top of a hill or steep escarpment where winds will be unrepresentative of the wider area.

Warming effect of buildings on the measurement of temperature

Sheltering or shading effects of trees on the measurement of sunshine and wind.

Frost hollow where overnight temperatures on still clear nights may be far lower than at neighbouring locations.”

………………………………………………………………………………………………

So to analyse that how does all that avoidance of “steep ground” or “where winds will be unrepresentative of the wider area” match up with the Met Office senior meteorologist (I.K.Dawson) account of the site?

So how about a close up view of the site itself – the Met Office seems unashamed to offer online close up imagery.

Is it just me (?) but how can anyone describe this as “Level Ground”? Consider the detail of the site firstly from the Ordnance Survey sheet. On this scale the contours are at 10 metre intervals – the screen is recorded as being at 236 metres amsl.

Elevation finder offers further details of the site gradient running from a high point of 254.4 metres (834 feet) down to 229.2 metres (752 feet) – a difference of 25.3 metres (82 feet) in just 250 metres (820 feet) – I make that a one in ten slope.

The Met Office’s own site classification standards are Excellent, Good, Satisfactory and Unsatisfactory. It would be hoped such a high profile site would be “Excellent” however, their evaluations I obtained under Freedom of Information request show Eskdalemuir just makes it in as “Satisfactory” and no better than that.

So how good is the observation record from this manned site? Below is a small extract from the “Remarks” section in the CEDA archive.

This really makes for surprising reading with the likes of:

  1. “discrepancy” noted of up to “6F”, in 1917,
  2. “inconsistent read times” in 1944.
  3. The noted effects of trees obstructing instrument readings
  4. Removal of tree shelter belts affecting exposure
  5. Missing data……with all those permanent staff?

And then there are more:

  1. More missing data
  2. Incorrect dates noted
  3. Three different screens noted of different types over different periods.
  4. Three different District county Network Numbered Screens.

So what were the effects of these three different screen types. Below is a typical example of the archived data – in this case from 1982.

Column A shows the reading’s date and time. Columns B and C show the site indicator number – NOTE both DCNNs 6677 and 6679 are being simultaneously archived. Columns I and J are maximum and minimum recorded figures…………….and they nearly always differ from one screen to another.

Which ones are used? For example on the 7th August 1982 was the maximum 21°C or 20.3°C – how does anyone actually know? Almost all daily readings are different. If this was purely a research experiment why archive spurious data for public viewing? The above example is typical of many years records in the archives.

Also worth noting from this alternative RMETS close up imagery showing all three screens (the largest being the current one still in use)……..are they all even located over grass?

This is all reminiscent of archived data at Waddington still showing the UK record of 40.3°C despite Met office claims of its readings corrupted by “weed killer”. Or even the example of Floors Castle/Charterhall were a Scottish all time (but allegedly expunged) record of 35.1°C is also archived as if accepted for posterity. How would a future researcher know which data to accept or ignore and thus how does anyone now know which historic data to trust?

Moving onto another important aspect, why is the World Meteorological Organisation awarding sites which only meet its own lowest actually regulated standard of Class 4. {n.b. Class 5 has no regulations being only described as ” Site not meeting the requirements of class 4.“} The WMO has clearly stated:

“Every part per million and every fraction of a degree temperature increase has a real impact on our lives and our planet. Prof. Celeste Saulo, WMO Secretary-General”

Well very clearly granting awards to sites that have an assessed area representation error margin of =/-2°C as in “Class 4 (additional estimated uncertainty added by siting up to 2 °C)” is completely contrary to the above statement. Does the WMO not know this is such a poorly rated site because the Met office did not tell them, after all the CIMO classifications of sites are not freely available in the public arena. {Ed. note – apart from on Tallbloke’s Talkshop!}

I shall repeat one of the headline statements from the Met office themselves.

“The WMO issues this status to nominated stations that have provided long-term, high-quality climate records that tell current and future generations about climate variability and trends.“

Does anybody really believe that given the facts?

via Tallbloke’s Talkshop

https://ift.tt/ncHKIAN

April 24, 2025 at 07:19AM