
Experts say every place on earth is warming twice as fast as the global average.

About Tony Heller
Just having fun
This entry was posted in Uncategorized. Bookmark the permalink.
via Real Climate Science
April 4, 2025 at 09:51PM
Experts say every place on earth is warming twice as fast as the global average.
Just having fun
This entry was posted in Uncategorized. Bookmark the permalink.
via Real Climate Science
April 4, 2025 at 09:51PM
“As Miami Keeps Building, Rising Seas Deepen Its Social Divide
Ignoring sea level rise and intensifying flooding, Miami has continued to build luxury real estate near the water at a rapid pace. But as developers eye higher ground, communities of color will likely bear the heaviest burden from the changes wrought by climate change.”

As Miami Keeps Building, Rising Seas Deepen Its Social Divide – Yale e360
Just having fun
This entry was posted in Uncategorized. Bookmark the permalink.
via Real Climate Science
April 4, 2025 at 09:07PM
Guest Post by Willis Eschenbach (still banned from X aka Twitter, see here)
The most excellent reef and ocean scientist Jennifer Marohazy put up a Facebook post recently on the lack of much effect on the atmosphere CO2 levels from the 2020 emissions drop due to COVID. She says this shows human CO2 emissions have very little effect on atmospheric CO2 levels. However, I fear her graph is greatly misleading.
The problem is that she is showing the full range of two related but very different variables. Let me see if I can clear up the confusion.
To begin with, we need to change the CO2 emissions to parts per million by volume (ppmv) of CO2. To do that, we need to divide the gigatonnage (billions of tonnes) of CO2 by 8.71 gigatonnes of CO2 emissions per each 1 ppmv increase.
Next, we need to account for the fact that the earth is constantly absorbing and sequestering CO2. I find there’s an excellent fit to be had by using the following procedure. The underlying assumption is that every year, a certain small percentage of “excess” airborne CO2 is being sequestered by natural processes, with the rest of prior emissions remaining in the air. What is “excess CO2“? Well, it is the amount in excess of some undetermined baseline, which we expect to be on the order of the historical value of about 285 ppmv.
So I set up an Excel spreadsheet to use Solver to search for the value of the unknown percentage which remains after the ongoing sequestration, as well as the value of the unknown baseline, that give the best fit to the actual airborne CO2. You can download my spreadsheet here, it’s only 23 kbytes. I get the following values:
Unknown baseline: best fit = 286.8 ppmv
Given that the fitting process could have come up with a very wide range of values, that is a very good indication that atmospheric CO2 levels are indeed related to human emissions.
Unknown percentage remaining after each year’s sequestration: best fit = 98.1%
And here is what those values give as a result. Remember, I’m calculating the best fit of human emissions to the actual airborne CO2 values using just two fitted variables—the amount remaining after annual sequestration, and the pre-industrial baseline.
Now, on my planet at least, that’s a very good fit. At all points, it’s within 1.5 ppmv of observations, and the R2 of the estimate and the observations is 0.997
A couple of comments on that. First, for a two-parameter fit between emissions and CO2 level, with one of the fitted parameters coming out very near the expected value, that seems clear evidence that the rise in CO2 levels is MAINLY a result of human emissions.
I say “mainly” because as you note, the observed CO2 level goes both above and below the estimate. I assume this is because of changes in both emissions and sequestration rates.
Now, as you can see, Jennifer is right that the estimate for the time of the dip due to COVID is slightly below the actual values. How much? The largest difference is the year after COVID, when observations are a whopping 0.7 ppmv above the value estimated from the emissions … be still my beating heart.
However, the same is true during a number of periods in the record.
Why doesn’t the COVID drop make much difference? Four reasons.
First, the e-folding time “tau” for the slow decay of a pulse of CO2 is ~ 50 years, so any year is greatly affected by the previous years.
Second, the drop in the emissions was small, only about 5%. Such small changes occur throughout the emissions record, and are smoothed over by the natural process of sequestration.
Third, the emissions dip was short, only one year long, with the next year returning to normal amounts.
Fourth, there are other factors at play, changes in natural emissions and sequestrations.
In closing, folks may ask about “tau”, the time constant being only 50 years when the scientific solons say excess CO2 remains in the air for hundreds and hundreds of years. So are they correct? Well … yes …and no. Excess CO2 remains, just not very much. Given the annual decay rate calculated above, .981, here’s how that plays out for the excess carbon.
(Yes, I know that’s different from what the standard “Bern Model” of CO2 sez … see my post on that model, including the previous post linked therein.)
My best wishes to Jennifer Marohazy despite her claims in this one case—she’s a most valuable and insightful scientist.
==========
Me, I’m not only in the very remote Solomon Islands near the Equator, north of Australia, where I worked for eight most wonderful years. I’m in the even more remote Western Province of the Solos, chewing betel nut with lime and leaf, and having a great time. I also, for the first time in three weeks, have reasonable Internet. Why?
My friend with whom I’m staying has Starlink. So for all you Elon haters out there, he’s done a huge service for mankind.
Best of the South Pacific to all, going scuba diving tomorrow, back to the US next week.
w.
AS IS MY CUSTOM, I ask that when you comment you quote the EXACT WORDS you are discussing. It avoids endless misunderstandings.
Subscribe to get the latest posts sent to your email.
via Watts Up With That?
April 4, 2025 at 08:03PM
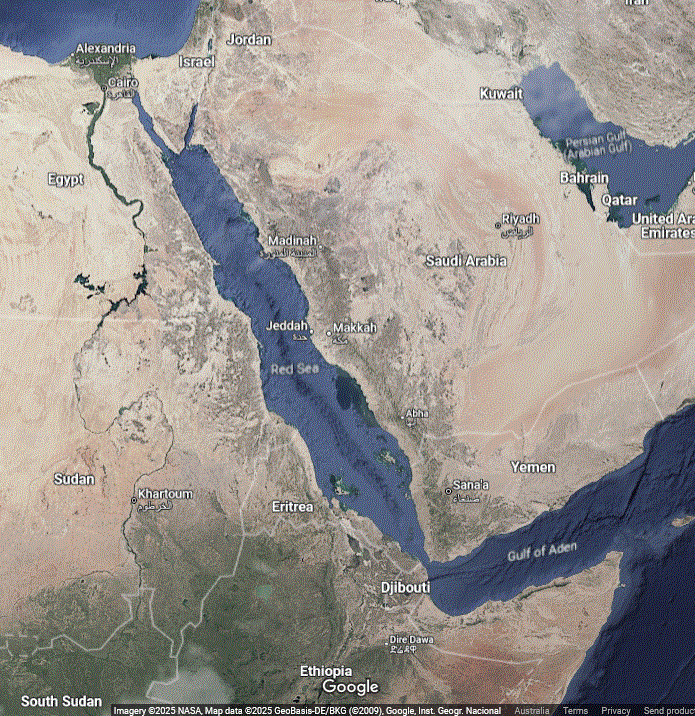
The Red Sea
By Jo Nova
Each polyp might be fragile, but coral ecosystems are apparently the couch-grass of the oceans.
A new paper rather puts the man-made panic about corals into perspective.
The most terrible events that could happen to corals have already happened, and the corals appear able to bide their time for two thousand years and return in all their glory.
The worst thing for the worlds corals is not rising seas but falling ones.
We panic over the odd bit of bleaching here and there, but it’s nothing compared to mother nature. The shallow edges of the oceans of the world are savage places. And the best place to study this mayhem is the Red Sea. Not only is it hot, but long, thin, deep, and it’s tectonically active too. In the depths of the last ice age, it was cut off from the Indian Ocean and the salinity rose to a death defying 47% at the Southern end, and 57% in the north. For thousands of years, the Red Sea was pickled.
When the world finally warmed and waters came back 18,000 years ago, baby corals had to travel 2,400 kilometers from the Gulf of Aden to get to Eliat, at the far northern end of the Red Sea, yet they easily did. And the seas kept on rising for thousand of years, and that was all fine and dandy, until disaster struck 4,000 years ago when the seas started to fall, and presumably those delicate polyps were left to bake in the sun.
Feldman et al, studied this phenomenon in the Red Sea and noticed that other scientists have already reported coral growth stagnated in all the major oceans at roughly the same time. For two thousand years there are almost no new fossil corals in any of the cores they drilled. Then somehow, the distinct coral communities that had thrived long before, all reappeared.
Imagine if seas were falling by a few millimeters a year today? The government funded scientists would be raging against the falling of the tide. Whole institutes would be established to move corals to baby nurseries, or special zoos, or to set up seed banks. People would be dreaming up schemes to heat the oceans…
Thanks to Kenneth Richard at NoTricksZone for recognising the importance of this paper:
In this study, we propose not just a local sea level condition causing specific reef turn-offs or hiatuses, but rather a global phenomenon of sea level fall. In light of our findings from Eilat and examining the reports from different locations around the globe (discussed above), we identify a global hiatus in reef growth between approximately 4000 and 2300 years BP (Figure 5). The available studies found almost no fossil corals dated to this time interval at sites across the Atlantic, Indian, and Pacific Oceans (Cortes et al. 1994; Dechnik et al. 2019; Gischler et al. 2008; Perry and Smithers 2011; Shaked et al. 2004, 2005, 2011; Toth et al. 2012),
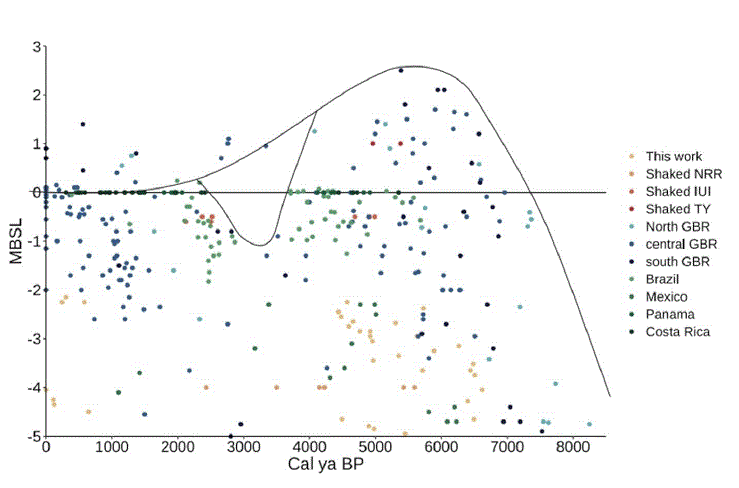
FIGURE 5 | Reconstruction of global sea level—Compilation of radiocarbon dates from seven sites vs. mean below sea level (MBSL). Possible
global sea level curve is presented with demonstrated fall between ~4000–2300 years BP.
Reading the paper is like trawling through an epic biblical drama. Corals want to grow near the surface to harvest the sunlight, so as the seas rise, they just grow upward. When seas stabilize they spread outwards. But the Red Sea has steep sides and the corals can’t expand far. The reef they studied at Eliat at the far northern end, was 1 kilometer long, but only 20m wide. Then just when those delicate corals get settled, a tectonic upheaval blows it away.
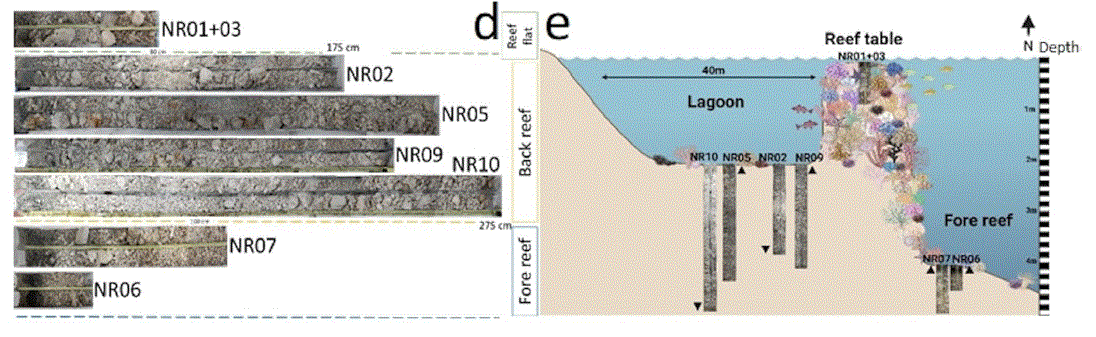
(d) Pictures
of all seven cores extracted from the lagoon, reef flat and fore reef of the Nature Reserve in Eilat, and some of the coral species that have been found (e) A sketch of Eilat’s Nature Reserve coral reef with all seven extracted cores and their locations. Black arrows on core’s sides represent if were taken from the north (up) or south (down) jetty.
So Feldman et al drill all these cores, and find all the remnants of different species, but when they date the samples they discover there is a kind of Bermuda triangle of corals. All corals below a certain depth are 4400 years or older, and just above that they are 700 years old.
At some point the corals must have completely died, and been reseeded from a far distant area. Or a few remnants struggled on somewhere, and somehow they still came back.
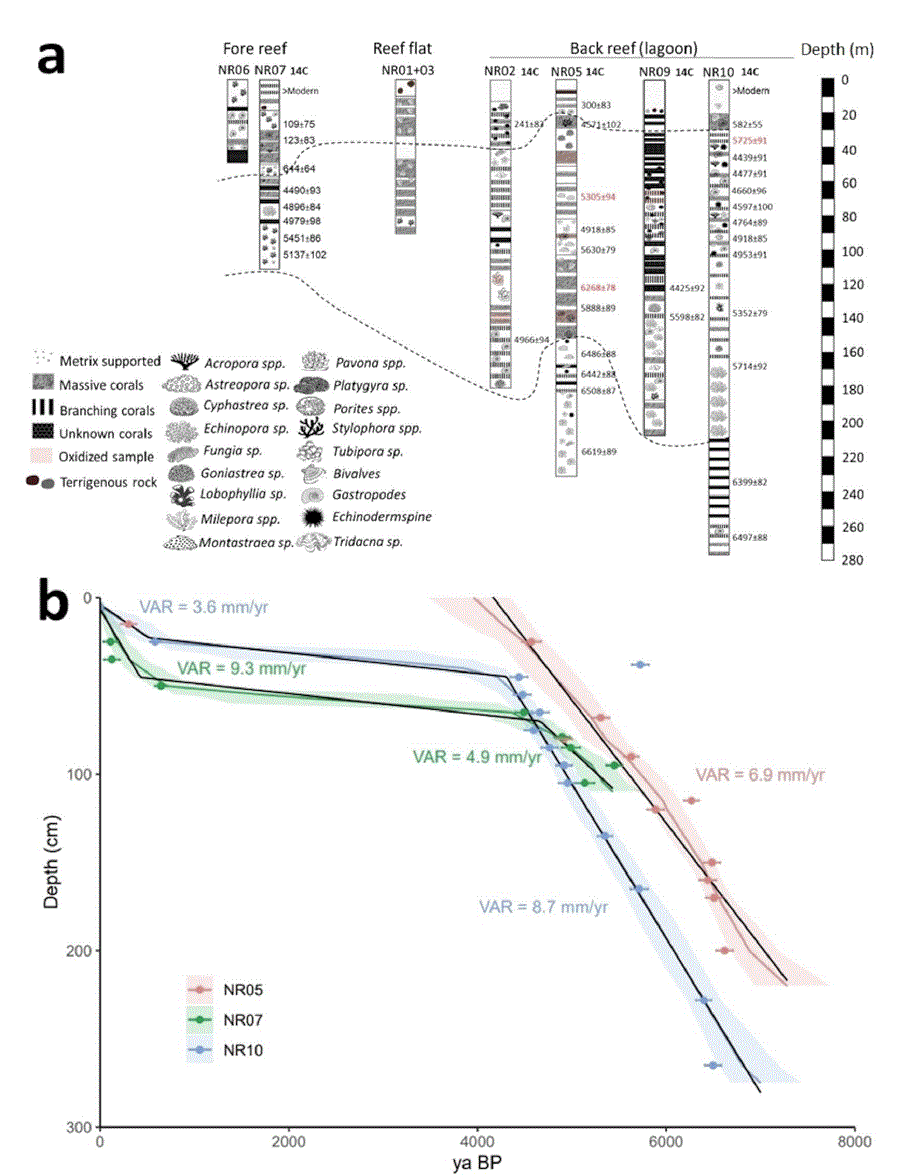
FIGURE 2 | (a) Core lithology and coarse coral community structure of all seven cores from the Nature Reserve Eilat. 14C dates (calibrates year BP) as well as U-Th dates are presented at the right side of each core. Dates in red represent age reversals. The upper dashed line separate between recent samples and 4000 yr. dated samples. The middle part separates the 4000 yr. dates and the 5000 yr. samples. Everything beneath the lower line is 6000 yr. and older. (b) Age depth model for cores NR05, NR07 and NR10. Measured ages are marked by colored symbols and error bars (dR = −8 and uncertainty = 33). The model is the black line with error in matching color. Accordingly, the hiatus spans between ~4400 y cal BP and ~ 700 y cal BP.
Spare a thought for all those poor little polyps when the next real crisis comes and we get another Ice Age. Spare a thought for us, too..
Feldman B, Torfstein A, O’Leary M, Blecher NS, Yam R, Shaked Y, Shemesh A, Huang D, Levy O. (2025) Late Holocene “Turn-Off” of Coral Reef Growth in the Northern Red Sea and Implications for a Sea-Level Fall. Glob Chang Biol. 2025 Feb;31(2):e70073. doi: 10.1111/gcb.70073. PMID: 39936330; PMCID: PMC11815541.
0 out of 10 based on 0 rating
via JoNova
April 4, 2025 at 04:51PM


