
0 out of 10 based on 0 rating
via JoNova
March 30, 2025 at 10:19AM
“There’s a link between the climate crisis and earthquakes,” former German Green Party leader suggests.

Image generated by Grok AI
Germany’s online Apollo News here reports on what Germany’s former Green Party leader, Simone Peter, suggests a cause of the huge earthquake in Southeast Asia: climate change.
And Europeans better worry about that, she adds!
According to Apollo, Ms. Peter bases her claim on an article that once appeared in the German leftist TAZ newspaper, which reported how a geologist speculated that melting of glaciers could possibly trigger earthquakes.
Ms. Peter reacted to the earthquake: “Wow, the massive quake in Myanmar and Thailand was also measurable in Europe.” … ‘“We know that earthquakes will continue to increase with the climate crisis, this is worrying for many parts of the world.”
“Geologists are increasingly in agreement that there is a link between the climate crisis and earthquakes,” she continued.
Peter’s claim are of course utterly preposterous as there are no glaciers anywhere near Thailand and Myanmar to begin with. Earthquakes are instead caused by moving tectonic plates that have been shifting for hundreds of millions of years.
If Peter’s claims haven’t convinced you by now that the “climate crisis” is a hoax perpetrated by greens and leftists, then nothing will. Consider yourself scientifically hopeless.
Donate – choose an amount
via NoTricksZone
March 30, 2025 at 09:07AM
Banks are not only fleeing from the Net-Zero Bankers club, now they are abandoning their own Net Zero targets too, and in dumping them, we find out they never meant a damn thing anyway
via CFACT
March 30, 2025 at 09:04AM

Summary of Main Points
By choosing the “best” models and estimates of CO2 fluxes (those which best explain year-to-year changes in atmospheric CO2 content as measured at Mauna Loa, HI) for the period 1959-2023 as provided by the Global Carbon Project, a multiple linear regression of yearly Mauna Loa CO2 changes against those “best” estimates of sources and sinks leads to the following alterations to the “official ” Global Carbon Project estimates of the sources and sinks leading to the observed rise in atmospheric CO2. (NOTE: being a statistical exercise, this does not constitute “proof”… these are just some areas that carbon budget modelers might want to look into when tweaking their models):
Background
Many researchers have spent their careers trying to estimate the various global sources and sinks of atmospheric CO2. The main net sources are anthropogenic emissions (including cement production) and land use (mainly biomass burning). The main CO2 sinks are land (vegetation and soil storage), the ocean (mixing the “excess” atmospheric CO2 downward… biological uptake remains largely unknown), and cement carbonation (old cement absorbs atmospheric CO2).
The Global Carbon Project (GCP) periodically summarizes various estimates of these sources and sinks and produces easily-accessible spreadsheets of the data. I suppose for political expediency (don’t insult your peers), the GCP (like the IPCC does for climate models) just takes virtually all of the estimates of CO2 fluxes and averages them together to produce a single “best” estimate of specific fluxes on a yearly basis. For example, they average 20 (!) different land models results for yearly net CO2 fluxes into the land surface (I say “into” because the current atmospheric “excess” of CO2, around 50% above pre-Industrial levels, causes the land and ocean to be net sinks of CO2).
What I Did
But since I am not part of the global carbon budget research community, I can pick and choose which models and data-based estimates I use. Some of these models are better than others at explaining the yearly increase in atmospheric CO2 at Mauna Loa, Hawaii, and here I will provide an analysis using only the best estimates.
(Now, some researchers believe that an average of all estimates will be better than any individual estimates. I don’t believe that… and neither should you. As a simple example, you can’t make a better estimate of something by averaging a good estimate with a bad estimate.)
So, what I did was to examine how well each individual model estimate (or sometimes an observational estimate) helped to explain the yearly CO2 increases at Mauna Loa. I then chose the best ones, and averaged them together. Then I regresses the yearly CO2 changes at Mauna Loa against these averages. As Fig. 1 shows, this produces a much better estimate of the Mauna Loa CO2 record than the GCP estimates of CO2 fluxes based upon all available estimates from various sources.
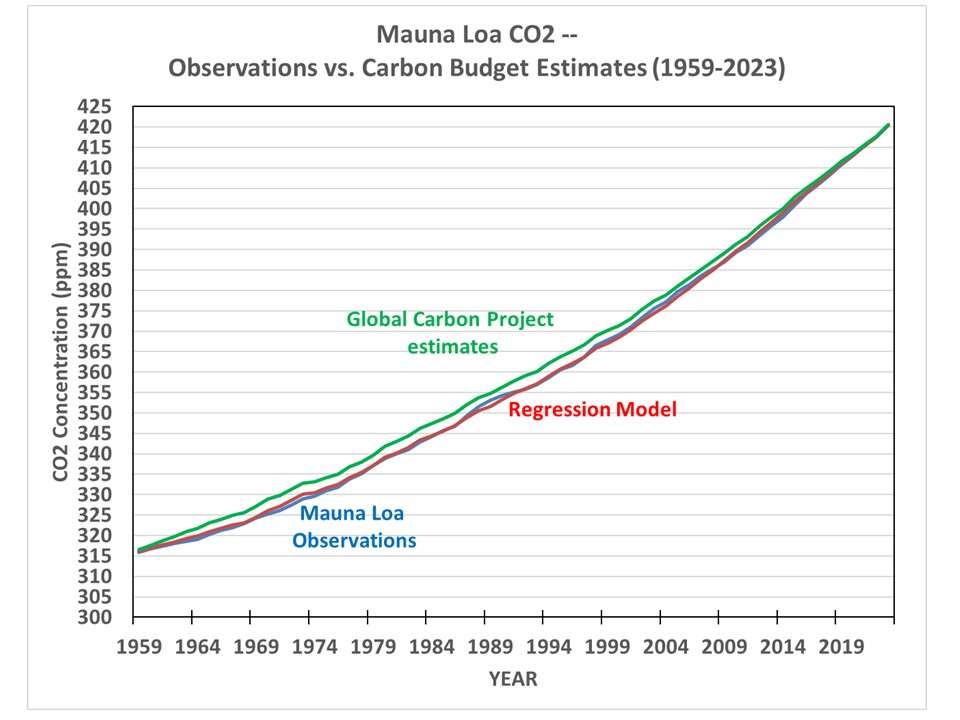
Now, to be fair, part of this better agreement comes from the statistical regression. The GCP estimates (quite admirably) use all of the available estimates based upon physics and parameterizations, and then sees how well the results match the Mauna Loa record. And they even include the yearly “residual” in their spreadsheet to show how well (or how poorly) the models fit the data. Kudos.
But I used the best models and estimates, and then use multiple linear regression, to see how closely the data can be fit to the Mauna Loa observations. Again, the year-to-year changes in observed CO2 concentrations are statistically related to the sources and sinks of CO2 which come from (1) anthropogenic emissions, (2) land use emissions, (3) land vegetative and soil uptake, (4) ocean uptake, and (5) cement carbonation (old cement removes CO2 from the atmosphere).
The results give a total regression model explained variance of 81%. The regression coefficients tell us whether the individual CO2 budget terms (sources and sinks of CO2) have been underestimated or overestimated. If the terms equal +1 (for sources) or -1 (for sinks), then the model estimates of the yearly CO2 sources and sinks are (on average) unbiased in their explanation of yearly CO2 changes at Mauna Loa.
Again I emphasize that such statistical results can be misleading. Errors in one term’s regression coefficient can cause errors in other terms’ coefficients. But regression analysis can also sometimes can reveal insights into what physics might be missing. I have seen both in my 40 years of doing such calculations.
Here are the results:
Global Anthropogenic Emissions: Coefficient = 1.3 (+/-0.22) This suggests anthropogenic emissions have been underestimated by about 30%. I find this hard to believe. Energy use is pretty well known. Maybe the cement production source has been underestimated?
Global Land Use: Coefficient = 0.43 (+/-0.45) This suggests land use emissions have been overestimated (but the coefficient uncertainty is large). Also, if there is little skill in a term, a lower coefficient will result due to the “regression to the mean” effect. This result suggests to me that yearly land use as a source of CO2 remains very uncertain.
Global Land Sink: Coefficient = -1.26 (+/-0.16). This suggests the land (mainly vegetation) sink has been underestimated by maybe 25%. The error is the coefficient is pretty small, so I think this result is significant.
Global Ocean Sink: Coefficient = -0.80 (+/- 0.49) This suggests the ocean sink has been overestimated (but with rather large uncertainty) by about 20%. I haven’t looked at whether these ocean models include CO2 outgassing as the temperature rises (a small effect). I’m not convinced that this coefficient is significantly different than 1.0, which would be the case if the models are unbiased in their estimates of the ocean sink.
Cement Carbonation Sink: (-7.3 +/-4.9) This suggests the CO2 uptake by old cement has been greatly underestimated (but with large uncertainty). This is a surprisingly large number, and I don’t know what to make of it.
I’m not convinced of most of these conclusions, except maybe the vegetation sink of CO2 being underestimated by the models. There have been recent papers published finding some vegetation uptake processes have been underestimated by the models.
The global anthropogenic emissions source being underestimated is also intriguing. Being greater than 1, the 1.3 coefficient is the opposite of what we would get from regression if the yearly anthropogenic emissions estimates were poor. So, I’m inclined to believe this is real.
Anyway, this was an quick-and-dirty exercise. Maybe 4 hours of my time. You can access the GCP data spreadsheet here.
via Roy Spencer, PhD.
March 30, 2025 at 09:02AM

