Not a government but a giant money laundering racket

By Jo Nova

Just another $20 billion dollars for the Climate Swamp

The New EPA chief has just tracked down another $2 billion handed out to a 2-bit nothing climate entity at the last minute. It’s only a tiny part of the Monster Swamp but it captures the spirit of bald-faced looting that was The US bloated Government.

After US voters voted to cut government spending and clean up the EPA on November 5th, the obvious thing for Democrats to do was, the exact opposite.

In the last days of the Biden pillage about $20 billion dollars was “allocated” to the EPA and parked in a bank account. Presumably in the hope of keeping the NGO activists of “climate” alive through the dark days of Trumpian hell. It may also have been a way to pay off friends, or stash funds for nice post-Trump career opportunities, who knows? But it was all a bit of a panic and the aid was jetting out through a fire hose. So much so, that, one community group with only a $100 in revenue, was given $2 billion.

New York Post

The funds were set aside at an outside financial institution — Citibank — before Biden left office and part of a larger, $20 billion pot of money the former president’s EPA received through the Inflation Reduction Act to dole out to climate groups.

“It’s extremely concerning that an organization that reported just $100 in revenue in 2023 was chosen to receive $2 billion,” EPA Administrator Lee Zeldin told the outlet, referring to Power Forward Communities’ latest tax filings. “That’s 20 million times the organization’s reported revenue.”

The $2 billion was part of a $20 billion dollar spray that was supposed to go towards eight different NGO’s with instantly forgettable names like Power Forward Communities, and the  Climate United Fund. In the world of teenage protestors, and B-grade scientists  it’s a massive amount of money. Think how many hack modelers someone could employ to churn out meaningless papers with headlines like “Climate change is making crocodiles hotter”?

In theory, some of the money was supposedly going to “decarbonize” low income houses, which nearly as useless. In the end, a few poor people get to pay tax to employ a bureaucrat who spends their own money buying them a solar panel they wouldn’t have bought, which achieves nothing they didn’t have cheaper twenty years ago, but flows right on through to improves the solar stock options of some friends of the bureaucrats. It’s just a form of servitude. The poor get green electrons they didn’t want, and the only lives that are enriched are in the bureaucracy and insiders at the stock exchange.

To truly appreciate the soul sucking nature of the looting it’s worth revisiting the words of the young EPA staffer two months ago, who casually bragged about the wild spending of “$50 billion dollars”  in the last days of the Biden era bonfire:

” It truly feels like we’re on the Titanic and we’re throwing, like, gold bars off the edge”

Project Veritas got undercover footage of Brent Efron (seen in the video below), who gloated that the money was being stuffed into NGO’s as “an insurance policy against Trump”. He giving it to NGO’s was so much better than spending it on government programs, because that way, it’s harder for the Trump administration to get it back. (We can see how much they care about the voters.)

He went on to say that he might work for one of these places “it would be really cool”. So the EPA worker and his colleagues were potentially stashing the money for their future careers. There’s a word for that…

Fortunately, the new head of the EPA, Lee Zeldin, has the receipts, and wants the money back:

New York Post

“The financial agent agreement with the bank needs to be instantly terminated, and the bank must immediately return all of the gold bars that the Biden administration tossed off the Titanic,” he argued…

The saying “like Gold Bars off the Titanic” will become legend, so if you missed this video in early December, watch it now. It really is something…


Comments under the video


0 out of 10 based on 0 rating

via JoNova

https://ift.tt/OUpqDYZ

February 20, 2025 at 03:11PM

A Game-Changer for Liberty: President Trump’s Latest Executive Order Unleashes the DOGE Revolution!

Folks, hold onto your hats because today, February 20, 2025, is a red-letter day for freedom-loving Americans everywhere! President Donald J. Trump has just dropped a bombshell of an Executive Order titled Ensuring Lawful Governance and Implementing the President’s “Department of Government Efficiency” Regulatory Initiative—and it’s nothing short of a masterstroke. Published on the White House website last night (February 19, 2025, at 22:26 EST), this move is a full-throttle charge toward dismantling the bloated, overreaching administrative state that’s been choking the life out of our economy and personal liberties for far too long. Here at Watts Up With That, we’re all about cutting through the noise and getting to the meat of what matters—and this EO is a sizzling steak of good news for anyone who values limited government, constitutional principles, and a legal landscape primed for real reform.

The core mission here is crystal clear: refocus the federal government’s enforcement powers on regulations that are actually authorized by law—meaning those pesky, made-up rules conjured by unelected bureaucrats are about to get the axe. The order directs agency heads, working hand-in-hand with their Department of Government Efficiency (DOGE) Team Leads and the Office of Management and Budget (OMB), to scour every regulation under their purview. If it doesn’t pass the smell test of constitutional legitimacy or align with the Trump Administration’s pro-freedom, pro-growth agenda, it’s toast. This isn’t just a tweak—it’s a top-to-bottom housecleaning of the regulatory swamp, and it’s long overdue.

By the authority vested in me as President by the Constitution and the laws of the United States of America, it is hereby ordered:

     Section 1.  Purpose.  It is the policy of my Administration to focus the executive branch’s limited enforcement resources on regulations squarely authorized by constitutional Federal statutes, and to commence the deconstruction of the overbearing and burdensome administrative state.  Ending Federal overreach and restoring the constitutional separation of powers is a priority of my Administration.  

https://www.whitehouse.gov/presidential-actions/2025/02/ensuring-lawful-governance-and-implementing-the-presidents-department-of-government-efficiency-regulatory-initiative/

What’s got me especially pumped is the sheer audacity of the intent: “commence the deconstruction of the overbearing and burdensome administrative state.” That’s not just a policy goal; it’s a battle cry! For years, we’ve watched federal agencies balloon into mini-fiefdoms, issuing edicts that strangle small businesses, jack up costs for families, and push dubious climate agendas with zero accountability. Now, with DOGE unleashed (and yes, I’m loving the acronym nod to a certain meme coin—it’s peak Trump energy), we’re seeing a real push to restore the constitutional separation of powers. Congress makes the laws, not some desk jockey in a cubicle with a rubber stamp. Hallelujah!

 Sec. 2.  Rescinding Unlawful Regulations and Regulations That Undermine the National Interest.  (a)  Agency heads shall, in coordination with their DOGE Team Leads and the Director of the Office of Management and Budget, initiate a process to review all regulations subject to their sole or joint jurisdiction for consistency with law and Administration policy.  Within 60 days of the date of this order, agency heads shall, in consultation with the Attorney General as appropriate, identify the following classes of regulations:
(i)    unconstitutional regulations and regulations that raise serious constitutional difficulties, such as exceeding the scope of the power vested in the Federal Government by the Constitution;
(ii)   regulations that are based on unlawful delegations of legislative power;
(iii)  regulations that are based on anything other than the best reading of the underlying statutory authority or prohibition;
(iv)   regulations that implicate matters of social, political, or economic significance that are not authorized by clear statutory authority;
(v)    regulations that impose significant costs upon private parties that are not outweighed by public benefits;
(vi)   regulations that harm the national interest by significantly and unjustifiably impeding technological innovation, infrastructure development, disaster response, inflation reduction, research and development, economic development, energy production, land use, and foreign policy objectives; and
(vii)  regulations that impose undue burdens on small business and impede private enterprise and entrepreneurship.
(b)  In conducting the review required by subsection (a) of this section, agencies shall prioritize review of those rules that satisfy the definition of “significant regulatory action” in Executive Order 12866 of September 30, 1993 (Regulatory Planning and Review), as amended.
(c)  Within 60 days of the date of this order, agency heads shall provide to the Administrator of the Office of Information and Regulatory Affairs (OIRA) within the Office of Management and Budget a list of all regulations identified by class as listed in subsection (a) of this section.
(d)  The Administrator of OIRA shall consult with agency heads to develop a Unified Regulatory Agenda that seeks to rescind or modify these regulations, as appropriate.

And here’s where it gets even juicier: the legal muscle behind this move. The EO lands hot on the heels of seismic shifts in administrative law, thanks to the Supreme Court’s 2024 Loper Bright Enterprises v. Raimondo decision. For decades, the Chevron doctrine—born in 1984—gave agencies a free pass to interpret ambiguous laws however they pleased, with courts bowing to their “expertise.” Loper Bright flipped that script, axing Chevron deference and putting judges back in the driver’s seat to interpret statutes without kowtowing to agency spin. As the Americans for Prosperity Foundation noted, this EO is Trump’s opening salvo to leverage that ruling, directing agencies to rethink rules that might not hold up under stricter judicial scrutiny. It’s a one-two punch: the Court cleared the path, and now Trump’s swinging the deregulatory sledgehammer.

Loper Bright famously overturned the Chevron Doctrine, which had previously directed courts to defer to agency interpretations of ambiguous laws, even if that interpretation was not the best reading of the law.  The administrative state was built on the back of these questionable legal interpretations, and Loper Bright opens the door for the public, agencies, and courts to restore the scope of agency authority to its proper statutory limits.

https://americansforprosperityfoundation.org/loper-bright/trump-administration-begins-deregulatory-review-with-eo-on-lawful-governance/

The details are just as thrilling. Agency heads are tasked with reviewing all regulations—joint or solo—for “consistency with law and Administration policy.” That means no more sneaky “guidance documents” or backroom rule-making that dodges public scrutiny. The Loper Bright effect amplifies this: without Chevron to shield them, agencies can’t bank on courts rubber-stamping their overreach. Every rule now faces a tougher test—does it square with the plain text of the law Congress wrote? If not, it’s fair game for the chopping block. The EO even defines “enforcement action” broadly, covering any move that affects your rights or property, so agencies can’t wiggle out by slapping a different label on their power grabs. This is precision-engineered to stop the nonsense cold, with a legal backbone that’s freshly forged in the post-Chevron era.

Now, let’s talk impact. For those of us who’ve been banging the drum on climate realism—like the good folks reading Watts Up With That—this could be a game-changer. How many times have we seen the EPA or other agencies twist science into knots to justify job-killing regs based on shaky climate models? With this EO, those rules are under the microscope. If they’re not grounded in solid statutory authority or they clash with Trump’s America-First priorities, they’re history. Imagine a world where energy policy gets unshackled from green dogma and we can drill, mine, and build again without jumping through endless hoops. The Loper Bright shift only turbocharges this—courts won’t just nod along to agency excuses anymore. That’s the vision here, and it’s electrifying.

And here’s another layer of brilliance in this EO: it’s not just about slashing unlawful rules—it’s about making sure every regulation that sticks around actually pencils out. The order mandates that agency heads, in coordination with DOGE Team Leads and the OMB, conduct a rigorous cost-benefit analysis for regulations under review. No more vague hand-waving or feel-good justifications—every rule has to prove its worth, dollar for dollar, against the burden it imposes on businesses, families, and the economy. This is a direct shot at the kind of pie-in-the-sky climate regs we’ve railed against here at Watts Up With That, where costs soar into the billions while benefits remain speculative at best. With Loper Bright already tightening the legal screws, this cost-benefit hammer ensures that only rules with real, measurable merit survive the cut. It’s practical, it’s pro-growth, and it’s a win for taxpayers who’ve footed the bill for bureaucratic excess for too long.

Of course, the usual suspects will cry foul. The beltway crowd and eco-alarmists will wail about “deregulatory chaos” or some such gibberish. But let’s be real: the chaos has been the last few decades of unchecked bureaucratic sprawl. This EO isn’t about anarchy—it’s about accountability, supercharged by a legal framework that’s finally tilting back toward the Constitution. With Loper Bright in play, agencies can’t hide behind “reasonable interpretations” of vague laws—they’ve got to prove their rules hold water. And with Trump’s first-term track record—slashing regs at a historic pace—he’s got the chops to make this stick.

So, what’s next? The wheels are already turning. Agency heads are on the clock to get cracking, and the DOGE teams are ready to sniff out the waste and fraud, with Loper Bright as their legal tailwind. We’ll be keeping a hawk’s eye on how this plays out—because if Trump’s first term taught us anything, it’s that he delivers on deregulation like nobody else. Remember his 2-for-1 rule that ended up axing five regs for every new one? This is that on steroids, with a Supreme Court ruling that’s got his back.

To every patriot out there: raise a glass tonight. This Executive Order is a bold step toward reclaiming our government from the clutches of the deep state, putting power back where it belongs—with the people—and it’s got the legal heft of Loper Bright to make it stick. It’s a win for liberty, a win for prosperity, and—dare I say it—a win for common-sense science over ideological nonsense. Stay tuned to Watts Up With That as we track this revolution in real time. The DOGE is off the leash, and it’s about to shake things up big-time!

Check out the full text of the EO here: White House Presidential Actions


Discover more from Watts Up With That?

Subscribe to get the latest posts sent to your email.

via Watts Up With That?

https://ift.tt/jhRN45s

February 20, 2025 at 11:07AM

Solar Activity Linked to Ocean Cycles

Solar energy accumulates massively in the ocean and is variably released during circulation events.

Thanks to Franklin Isaac Ormaza-González alerting me to this paper Did Schwabe cycles 19–24 influence the ENSO events, PDO, and AMO indexes in the Pacific and Atlantic Oceans? by Ormaza-González, Espinoza-Celi and Roa-López, all from ESPOL Polytechnic University, Ecuador.  Why is this important? Because warming in the modern era is closely tied to El Niño and La Niña events (ENSO).  For example,
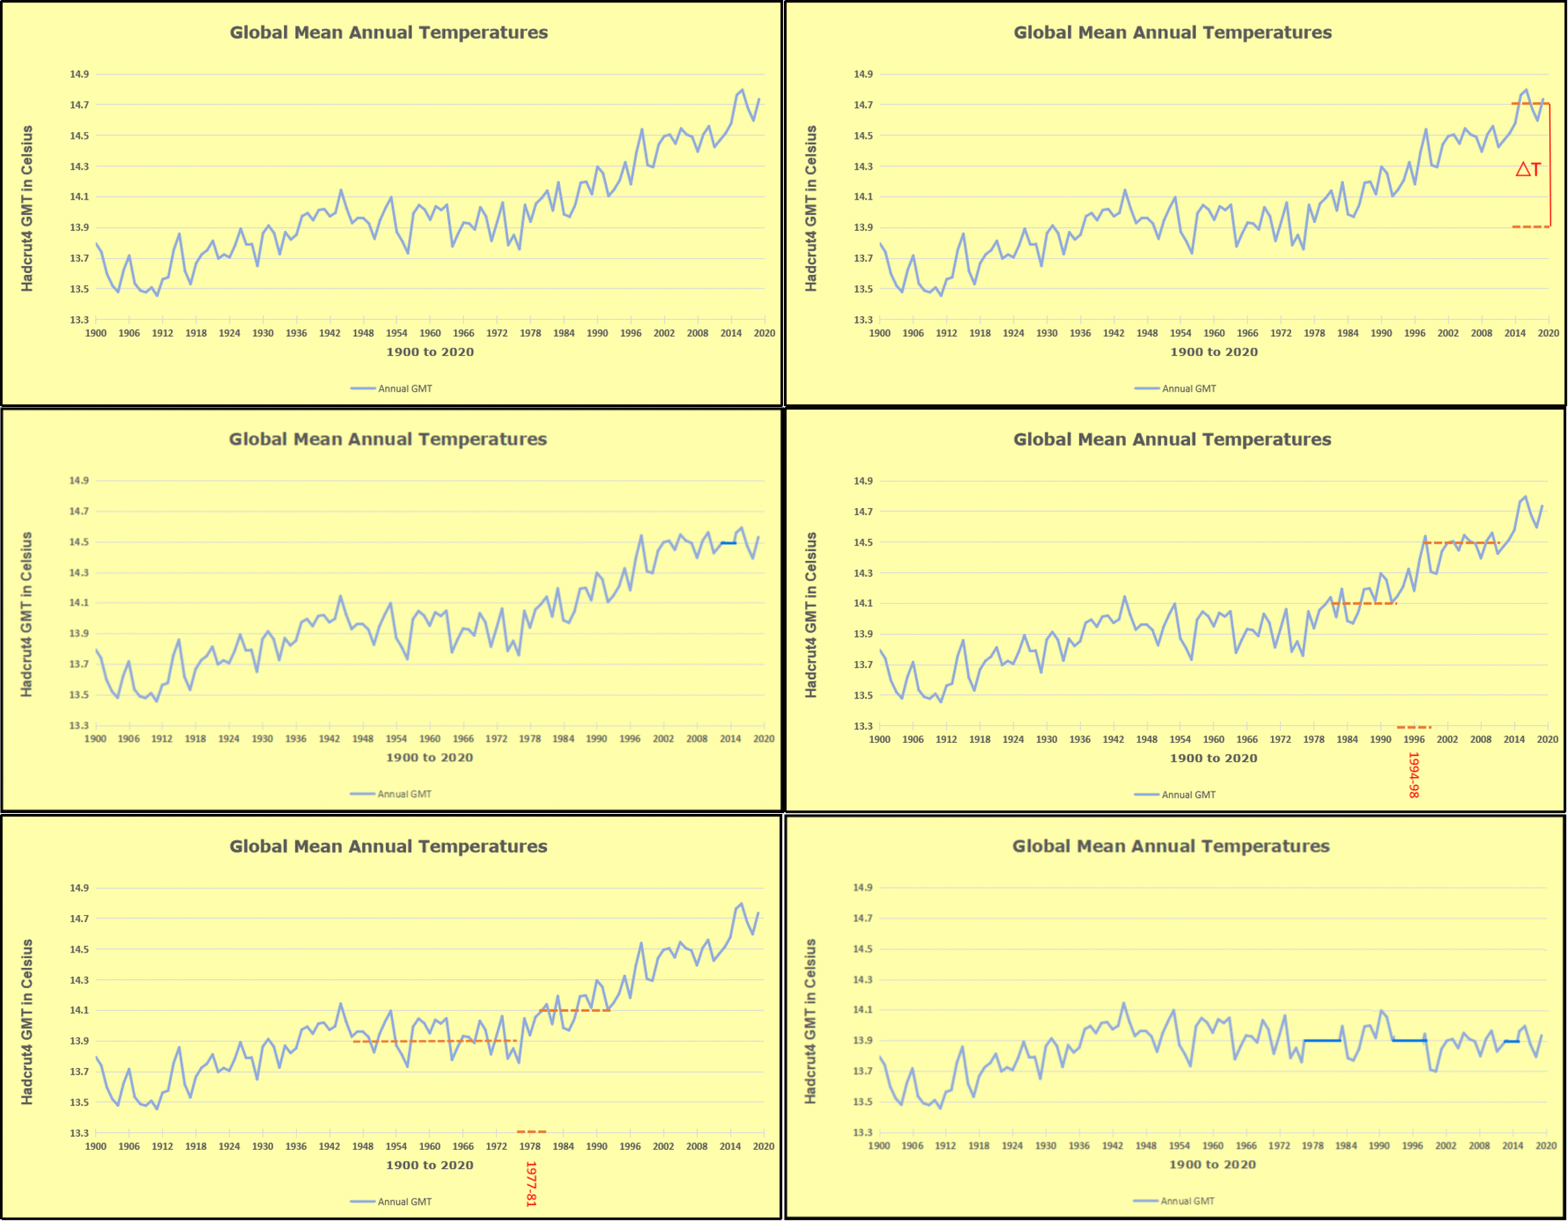
The exhibit shows since 1947 GMT warmed by 0.8 C, from 13.9 to 14.7, as estimated by Hadcrut4.  This resulted from three natural warming events involving ocean cycles. The most recent rise 2013-16 lifted temperatures by 0.2C.  Previously the 1997-98 El Nino produced a plateau increase of 0.4C.  Before that, a rise from 1977-81 added 0.2C to start the warming since 1947.

As shown in the synopsis below, the paper analyzes multiple oceanic oscillations during the years 1954 to 2019 in order to compare with solar cycles of sunspots 19 through 24 occurring during that time frame.  The title is stated as a question, and the conclusion provides this answer (in italics with my bolds).

Finally, did Schwabe cycles 19–24 influence the ENSO events, PDO, and AMO indexes in the Pacific and Atlantic Oceans? Yes, it has been found a wide range correlation coefficient from 0.100 to about 0.500 statistically significant (p < 0.05) with lag times from few months to over 2 years between the Schwabe cycles and the ocean indices chosen here. These results could be a potential source to improve predictive skills for the understanding of ENSO, PDO and AMO interannual and decadal fluctuations. Better predictive models are imperative given that El Niño or La Niña has vast impacts on lives, property, and economic activity around the globe, especially when dramatic peaks of El Niño occur. The new cycle 25 has started and could have a major oceanic swing follow suit, and the next El Niño would be in around 2023–2024 according to historical events and results presented here.

Given that the paper was drafted before submitting in February 2022, and publication in October that year, the forecast of a 2023-24 El Nino was confirmed in a remarkable way.

To enlarge, open image in new tab.

The cyan line represents SST anomalies in the Tropics and shows the major El Ninos, 2015-16, 2019-20 and 2023-24.  Note all three events included pairs of major NH summer warming peaks. The synopsis below consists of excerpts in italics with my bolds to present the broad strokes of the analyses and findings. (Note: The paper includes detailed analyses and many references to supporting studies, and interested readers can access them by linking there.)

Context

The surface-subsurface layers of the ocean that interact with the lower atmosphere alternately release and absorb heat energy. The work of Zhou and Tung (2010) reported the impact of the TSI on global SST over 150 years, finding signals of cooling and warming SSTs at the valley and peak of the SS cycles. Schlesinger and Ramankutty (1994) report a global cycle of 65–70 years for SST that is affected by greenhouse anthropogenic gases, sulphate aerosols and/or El Niño events, but they did not imply any external forcing such as the SS. There have been other studies on how solar radiation variability could affect temperature; recently, Cheke et al. (2021) have studied those solar cycles of SS that would affect the El Nino Southern Oscillation (ENSO) indexes.

There are well known oceanic events that show periodicity with low or high frequencies: 25–30 and 3–7 years, respectively. These include the Pacific Decadal Oscillation (PDO), Atlantic Multidecadal Oscillation (AMO),  and Interdecadal Pacific Oscillation (IPO), as well as El Niño or La Niña.  During El Niño events, the surface and subsurface lose energy to the atmosphere and the opposite occurs during La Niña; these events have a periodicity of 3–7 years. The Interdecadal oscillations have a series of impacts; e.g., the PDO gives rise to teleconnections between the tropic and mid-latitudes, and the effects include:

1) ocean heat content,
2) the lower and higher levels of the trophic chain including small pelagic fisheries (tuna and sardines);
3) biogeochemical air-sea CO2 fluxes;
4) the frequency of La Niña/El Niño.

The interactions between decadal oscillations PDO/IPO and AMO may also affect ocean heat content. All these low and high frequency oceanographic events have a direct impact on local, regional, and global climate patterns, and there is growing evidence from many studies that the driving source of energy is the sun.

Thus, whatever affects the solar irradiation falling on the surface of the oceans, including volcanic eruptions (Fang et al., 2020), and cloudiness for example, it would affect the gain or loss of heat content of the oceans. The cited works tried to find the physical reasons for these connections, but they remained unknown or difficult to explain.

The work reported here investigates how fluctuations of sunspots over time (1954–2019) may cross-correlate with low and high frequency oceanic events such as the sea surface temperature (SST), anomalies (SSTA), Oceanographic El Niño Index (ONI), Multivariate ENSO Index (MEI), Southern Oscillation Index (SOI) in the central and east equatorial Pacific Ocean; and PDO, as well as on the AMO in the North Pacific and Atlantic basins. The hypothesis is that even small variations of the TSI can be reflected in these tele-connected indexes.

Discussion

Fig. 1. Behaviour of monthly counts of SS, ONI, MEI, PDO and AMO. The Indexes start at t = 0, 12, 24 and 36 months (panels a, b, c, and d respectively). The SS series starts at t = 0 in the four panels. The left vertical axis gives the values for the Indexes, and SS counts at the right vertical scale. The end of each Schwabe cycle is marked by vertical dashed lines.

Maxima in the PDO, AMO, ONI, and MEI series were offset by 0, 12, 24 and 36 months (Fig. 1, panels a, b, c, and d respectively), with the SS series starts at t = 0 in the four panels. It has been reported that the lag times for responses of some Indexes to SS cycles (SS) are around 12–36 months (see fig. 1 of Hassan et al., 2016), and Fang et al. (2020) have reported that ENSO responds with a 2–3 years of lag time after a major volcanic eruption. From 1954 to the present time, each sunspot cycle from 19 to 24 has occurred with a period of around 11 years (Hathaway, 2015), which is slightly less than the 11.2 years reported by Dicke (1978). The highest SS activity is seen in cycle 19 with around 250 SS/month, followed by <150, and at cycle 21 around 200, before decreasing steadily over cycles 22 to 24 to just over 100 SS/month. Cycle 24 is the lowest contemporary value of SS activity that is comparable only to cycles 12–15 (around 1880–1930) and is the lowest in the last 200 years (Clette et al., 2014).

Fig. 12. Sunspots monthly counts curves per cycle. Red and blue lines represent El Niño and La Niña events. Note that Cycle 24 finished on December 2019 (National Weather Service, 2020).

The SSTA in El Niño 1 + 2 region cross-correlated with SS many times, especially during descending phases of all cycles except SS 22 with cc-ρ up 0.389 (SS 24) and main lag times from 5 to 13 months. The SS cycles (20 and 24) during cold phase PDO showed alternate cross-correlation reaching a maximum 0.389 and negative −0.314 (p < 0.05). During the ascending phase in El Niño 1 + 2 region (blue bars, Fig. 5a) the cc-ρ peaked at 0.393 (p < 0.05). In the cycles 19 and 24 the highest cc-ρ were found, −0.460 and 0.394 (p < 0.05) respectively. These coefficients coincided with the largest (over 2 years) and most intense (<−1.5C) La Niña during 1954–1955, and 2010–2012 (Fig. 12).
It must be noticed that during cycle 21 two big events El Niño (1983–1985) and La Niña (1984–1985) were registered as well as in cycles 23 and 24 with coefficients just around 0.2. The highest coefficients would mean an influence up to 21.2% and 15.5% of the SS on the SSTAs in El Niño 3.4 region. These results would suggest the cross-correlations are stronger in El Niño 3.4 region due to the less dispersing oceanographic-meteorological conditions than in El Niño 1 + 2 region. Also, these findings would suggest that during the cold phase of PDOs (see NOAA, 2016), the cc-ρ in El Niño 3.4 region tends to be higher, as the solar energy reaching the ocean surface increases as the cloudiness tends to decrease significantly during prolonged periods around or over in El Niño 3.4 region (Porch et al., 2006).
The sun cycle 19 is the most intense since the last 100 years, the contrary is the cycle 24 (NWS, 2021). In general, the ascending phase of the SS cycles takes a shorter time than descending phase, therefore the slope of the curve is steeper (Fig. 12); then the increasing change of the TSI influences in a clearer way the studied indexes. It seems that during the ascending phases, El Niño events are prone to develop as TSI increases (as well as UV radiation does, NWS, 2021), while during plunging SS phases, when the TSI tends to diminish (see Formula (1)), could lead to La Niña events, like the 2020–2022 occurrence (Ormaza-González, 2021).
Most of the La Niña events occur during the descending phase or just when approaching or leaving the valley or minimum SS counts (Fig. 12) when the TSI decreases and reaches the minimum (Scafetta et al., 2019). La Niña 2020–2022 is a good example, the lowest SS counts (<2 counts/months) occurred during extended periods when reaching the valley of the SS 24. The valley of SS 24 has had an extended period of close to 3 years, during which there have been weeks and months without sunspots, before the SS 25 started in December 2020.
The weakest sunspot cycle (SS 24) over the last 100 years (NWS, 2021) has had four La Niña events: 2007–2009, 2010–2012, 2016–2017, and 2020–2022 (Fig. 12), it is the only cycle with that number of La Niña events.

Conclusions

Over the studied period 1954–2019, sunspot numbers decreased from a monthly maximum between 225 (SS 21) to a minimum around 20–25 (SS 24). The SS 24 had 913 days without SS counts until December 2019 (Burud et al., 2021), being this cycle the weakest since 1755; and the SS 25 will probably be weaker than or like SS 24 (Ineson et al., 2014; Chowdhury et al., 2021; NASA, 2021a, NASA, 2021b). Thus, the Earth has been receiving slightly decreasing solar energy over this almost 7-decade period.
On the ocean surface the influence of sunspots could chiefly be due to UV energy fluctuation (Ineson et al., 2014) as this radiation penetrates down to 75–100 m depth in the water column (Smyth, 2011). van Loon et al. (2007) suggested that even though SS cycles produce weak changes on the Total Solar Irradiation (TSI) of about 0.07% (Gray et al., 2010), these can still produce decadal and millennial impacts on global thermohaline circulation (Bond et al., 2001; Gray et al., 2016).
The ONI Index showed to be poorly cross-correlated with cc-ρ values <0.100, only twice approached to −0.200. On the other hand, the MEI registered around ±0.200 through all cycles and predominant lag times within 12 months. The SOI showed cross-correlations with SS cycles (19–21, and) averaging a coefficient of 0.200 with lags times range of 9–34 months. The SOI temporal behaviour has also been associated with SS and it could enhance or affect the oceanographic Indexes of the equatorial Pacific (Higginson et al., 2004). [The Multivariate ENSO Index does not only consider the SST Anomaly but also sea-level pressure and other variables.]
The MEI index could have been influenced from 7.3% up to 23%. The MEI correlated in all ascending and descending phases of SS cycles. The SOI had similar cross-correlation coherence to those oceanographic indexes during ascending and descending phases. These results would provide evidence on how SS affects the studied Indexes during the ascending/descending phases of their cycles. In some cycles, the impact will be stronger and in other weaker depending on intensity and behaviour in time of the cycle.
Finally, did Schwabe cycles 19–24 influence the ENSO events, PDO, and AMO indexes in the Pacific and Atlantic Oceans? Yes, it has been found a wide range correlation coefficient from 0.100 to about 0.500 statistically significant (p < 0.05) with lag times from few months to over 2 years between the Schwabe cycles and the ocean indices chosen here. These results could be a potential source to improve predictive skills for the understanding of ENSO, PDO and AMO interannual and decadal fluctuations. Better predictive models are imperative given that El Niño or La Niña has vast impacts on lives, property, and economic activity around the globe, especially when dramatic peaks of El Niño occur. The new cycle 25 has started and could have a major oceanic swing follow suit, and the next El Niño would be in around 2023–2024 according to historical events and results presented here.

via Science Matters

https://ift.tt/HVuCgdR

February 20, 2025 at 11:00AM

Hurn WMO 03862 – Can this site’s readings be taken seriously? …Yes Minister.

50.779375 -1.836333 Met Office Assessed CIMO Class 4 Archived temperature records from 1/1/1957

Hurn weather station is located in an area better known as the international airport serving the Bournemouth Area. There are 40 jet aircraft in the above image of the southern section of the airport. There are a further 12 visible in the northern section plus numerous propeller driven aircraft. The little red kite marks the Stevenson screen location.

The image below is a closer up view. This shows the screen likely subject to the shade effects of the control tower to the south east and a short distance to the taxiway along which most of those aircraft above will travel to get to the main runway to and from the parking aprons and hangars.

The Met Office will claim this is an “Internationally Agreed Distance from the Runway” which is a non- existent metric. I suggest that most reasonable minded people would consider that, whilst it is important for airports to have accurate advice of the local weather conditions, those same local weather conditions would most certainly not represent the wider natural environment. As demonstrated with video evidence in both my reviews of Coningsby and Leuchars/Heathrow the aircraft gas turbine engines willl have dramatic effects of both wind and temperature on their close environs. As a former senior manager for the Met Office guest posted for the Talkshop, modern instrumentation will readily respond to such transient effects

” For example a site on an airport may present no problems for a MiG; the quicker response of the Pt may catch a quick burst of an aeroplane’s exhaust as it passes en route for take-off or landing.   This will result in a higher Maximum Temperature recorded for that day.“

The Met Office itself readily admits this site does not reflect the wider area by giving it a Class 4 rating which clearly indicates ” 2.5 Class 4 (additional estimated uncertainty added by siting up to 2 °C)“

Hurn weather stations readings are, beyond any reasonable doubt, wholly unsuitable both for inclusion into the national historic temperature record nor indeed for any representation of the wider area temperature.

Unfortunately both the Department for Science, Innovation and Technology nor the Department for Energy Security and Net Zero appear to have any whit of understanding of such matters and instead double down on the absurdity as also demonstrated at Leconfield. From https://www.gov.uk/government/collections/weather-statistics

This is how government departments collate “average daily temperatures” for the UK as a whole and by regions. Take SEVENTEEN wholly unrepresentative locations from a completely unrepresentative geographical spread, DOUBLE the readings from FOUR randomly selected sites and then divide by TWENTY TWO. Let this sink in for a while……….

“Double counted stations in the calculations to produce the national averages for temperature correction”

Hurn, a Class 4 aviation site, has its figures doubled and added to a Class 5 Aviation site at RAF Boscombe Down just 31 miles away to represent a large proportion of where people live. I contest that the vast majority of the UK adult population would not find that a remotely acceptable way to derive statistics from which government energy policies are formulated. It lies more in the realms of a humorous “Yes Minister” script than any reality most would be familiar with.

In summary Hurn is a completely unacceptable site for climate purposes that produces readings affected by both its wholly unnatural surroundings, heavy shading, and the influences of multiple aircraft movements in close proximity. These unacceptable readings are then grotesquely manipulated to produce absurd averages (that 100% of statisticians would reject) and then used to formulate policy…..Yes Minister!

via Tallbloke’s Talkshop

https://ift.tt/WV5j7Gy

February 20, 2025 at 08:26AM