Manhattan To Drown Again

Scientists say Manhattan will drown by the year 2100. Revealed: What life on Earth will look like in 2100 – with entire cities plunged underwater and millions of people perishing in the heat | Daily Mail Online Previously they said … Continue reading →

via Real Climate Science

https://ift.tt/25nKFep

February 1, 2025 at 04:34PM

Structures On Mars

People have once again used image enhancement techniques to convince themselves of intelligent life on Mars. (14) Joe Rogan on X: “This is fucking WILD.” / X This is the original image. (18) Jay Dook on X: “@chrisramsay52 Here is … Continue reading →

via Real Climate Science

https://ift.tt/kyX7dvs

February 1, 2025 at 04:13PM

EPA’s “Carbon Scare Framework” aka “Endangerment Finding” – A Classic Case of Government Overreach

President Trump’s first week marked a significant shift in U.S. climate and energy policy. His administration prioritized energy independence, rolled back burdensome regulations, and withdrew from the Paris Climate Agreement, citing disproportionate costs to the American economy. Among his most consequential moves was rolling back Obama-era climate policies that were rooted in the EPA’s Endangerment Finding. Trump’s executive actions highlighted the urgent need to revisit and rescind that Endangerment Finding. This 2009 EPA edict underpins much of the federal government’s sweeping climate agenda, driving regulations that increase costs for consumers, harm industries, and expand government overreach into nearly every aspect of life.

The Endangerment Finding, classified carbon dioxide (CO₂) and five other greenhouse gases as pollutants under the Clean Air Act. This allowed the EPA to regulate these gases despite the fact that the Clean Air Act was originally intended to address harmful pollutants like smog, soot, and sulfur dioxide—substances with direct and immediate health impacts.

Carbon dioxide, however, is neither toxic nor harmful at current atmospheric levels. It is a naturally occurring gas, essential to life on Earth, and plays a vital role in plant growth and food production. By declaring CO₂ a pollutant, the EPA dramatically expanded its regulatory reach. This finding set the stage for far-reaching mandates on power plants, vehicles, appliances, and more, giving the federal government a license to micromanage industries and individual choices alike.

CO₂ has been unjustly vilified in the political and media narrative surrounding climate change. While it is true that CO₂ is a greenhouse gas, its role in the climate system is far from simple or all-encompassing. For instance, water vapor is the most significant greenhouse gas in terms of its warming potential, accounting for roughly half of it due to its abundance in the atmosphere compared to other greenhouse gases, yet it is rarely discussed because it is beyond the scope of regulation.

The Endangerment Finding has triggered a cascade of regulations with far-reaching and often harmful consequences for industries, consumers, and the broader economy.

  1. Energy Costs and Reliability:
    Regulations targeting coal and natural gas power plants have forced many reliable energy sources offline, driving up electricity costs for consumers. Affordable, dependable energy is a cornerstone of economic growth, yet these regulations undermine it.
  2. Transportation:
    Vehicle emissions standards linked to the finding have raised car prices and accelerated the push for electric vehicles (EVs). Consumers are left with fewer choices and higher costs, all in the name of reducing CO₂ emissions.
  3. Housing and Appliances:
    Energy efficiency mandates stemming from the finding have increased costs for home construction and everyday appliances like refrigerators, water heaters, and air conditioners. These mandates often result in products that are less effective or less durable, burdening households with higher costs for questionable benefits.
  4. Agriculture and Food Prices:
    Farmers are now under pressure to reduce emissions of methane and nitrous oxide, two other greenhouse gases identified in the Endangerment Finding. These regulations drive up farming costs, which are inevitably passed on to consumers. This has serious implications for food security and affordability.
  5. Erosion of Individual Freedoms:
    The Endangerment Finding enables the federal government to intrude into everyday decisions, from the kind of car you drive to the appliances you use to how you heat your home. What were once personal choices are increasingly dictated by federal mandates, all justified by the need to reduce emissions.

The unintended consequences of this EPA overreach hurts average Americans.

One of the greatest flaws of the Endangerment Finding is its tunnel vision. By focusing almost exclusively on CO₂, it ignores the broader environmental picture.

Similarly, the push for renewable energy has downsides that are often overlooked. Wind and solar energy require vast amounts of land, disrupt ecosystems, and rely on mining rare materials that cause significant environmental damage. Meanwhile, the policies driven by the Endangerment Finding disproportionately harm low-income households, who are least able to absorb rising energy and food costs.

The Endangerment Finding must be rescinded – it’s out of step with American values.

President Trump’s rollback of climate policies highlighted the dangers of the Endangerment Finding but did not go far enough. To truly safeguard America’s energy independence, economic growth, and individual freedoms, the Endangerment Finding must be rescinded. Its foundation is shaky—built on exaggerated claims about CO₂ and a misinterpretation of climate science. Eliminating it would free industries from burdensome regulations, lower costs for consumers, and restore balance to environmental policymaking.

Rescinding the finding would not mean abandoning environmental stewardship. Instead, it would allow for a more rational approach to climate and energy policy—one that respects scientific complexity, avoids alarmism, and considers the real-world consequences of overreach. A balanced policy would prioritize innovation, voluntary efforts, and adaptation over heavy-handed mandates.

The EPA’s Endangerment Finding, better understood as the “Carbon Scare Framework,” represents a gross overreach of regulatory authority. By declaring carbon dioxide a pollutant, the federal government has imposed costly and far-reaching rules that affect every aspect of life, often to the detriment of the economy, individual freedoms, and even the environment itself.

The path forward begins with rescinding the Endangerment Finding and reevaluating the role of CO₂ in climate policy. America needs a balanced, evidence-based approach—one that prioritizes innovation, economic freedom, and environmental stewardship without succumbing to alarmism or ideological agendas. If policymakers are serious about addressing real challenges, it’s time to step away from the carbon scare narrative and toward rational, practical solutions.


Discover more from Watts Up With That?

Subscribe to get the latest posts sent to your email.

via Watts Up With That?

https://ift.tt/XZu1ShB

February 1, 2025 at 04:02PM

Arctic Ice Recovery Stalls January 2025

Arctic ice recovered more slowly than usual in December and January, likely due to polar vortex pulling freezing air from the Arctic down into lower latitudes, replaced by warmer southern air.  A post at Severe Weather Europe is February 2025 Forecast, describing the dynamics this winter.  

After a mild start, a new Polar Express is looming
for the United States and Canada mid-month.

As January is slowly ending, we can look at preliminary surface temperature data for the month so far. Below is the CDAS analysis, and you can see that January was colder than normal across the entire United States, apart from California and parts of Nevada. But these anomalies do not show the full picture of just how cold some days in the month were, breaking records for several years and even decades in the past.
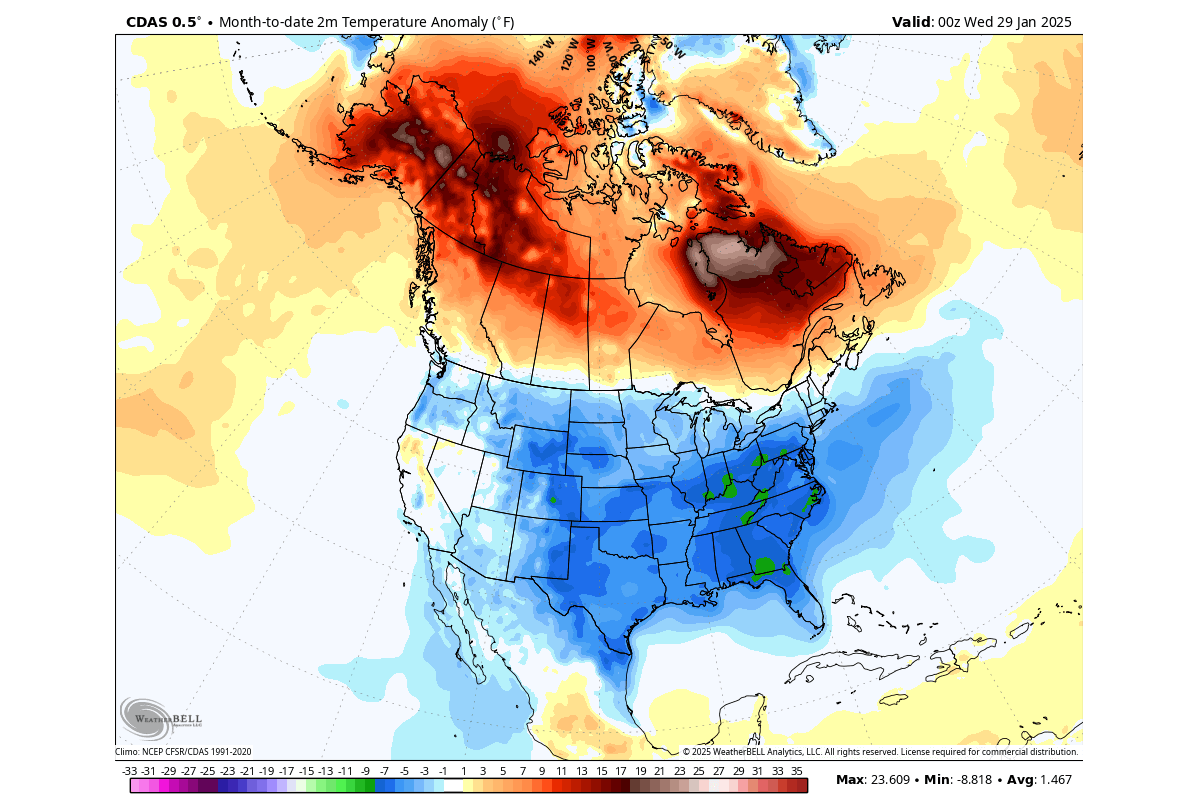
On the other hand, we can see that Canada had warmer than normal temperatures. This is an expected pattern, as while the colder air was transported further south into the United States, it was replaced by high-pressure and a warmer-than-normal airmass.

The movement of the pressure systems drives these temperature patterns and weather changes. Pairs of pressure systems are also known as Rossby Waves. You can see an example of Rossby waves in the image below by NOAA and how they are all connected and function with the jet stream.

The purple line connecting these pressure systems is called the jet stream. This rapid stream of air is found around 9 to 14 kilometers (6 to 9 miles) above sea level.

In late January, the average temperatures in the northern United States and southern Canada are still around or below freezing, so even a strong positive anomaly does not actually mean warm temperatures in that region. But, it is interesting to see the rapid shift in temperature anomalies as the pressure systems reposition.

February 2025 is about to start, with the latest weather forecasts indicating a very dynamic month over the United States and Canada. After the power struggle between the cold and warmth at the start of the month, another Polar Vortex lobe looms for the United States around mid-month.

Below is the surface temperature anomaly, averaged for next week. You can see the large supply of colder air over the northern United States and western Canada. Another cooler area is forecast for eastern Canada and the northeastern United States.
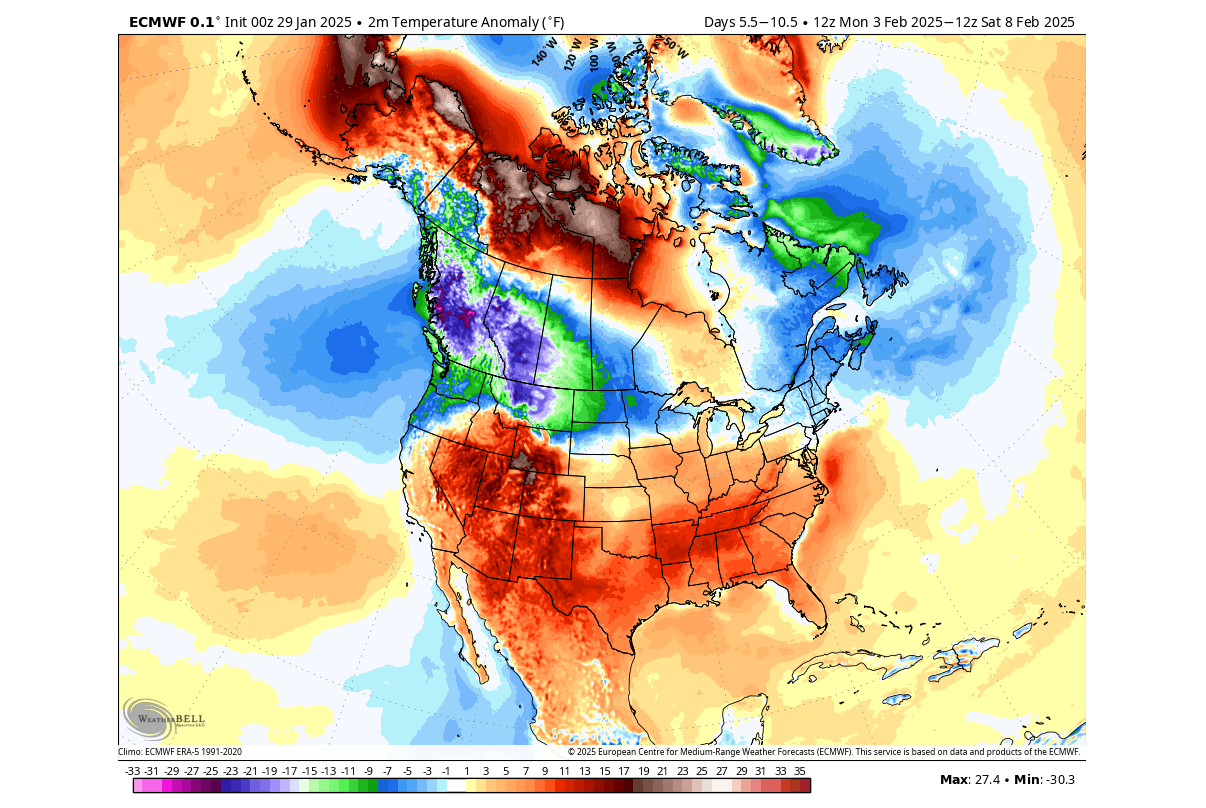
But most of the central and southern half of the United States is forecast to have above-normal temperatures. We often see such a division in the weather patterns, where the colder and warmer air separate along the jet stream.

Going into the weather trend for the second half of February, we will use the extended-range ensemble forecasts. These forecasts serve as trends that show the prevailing idea of where the pressure systems are positioned and how the airmass is expected to move.

The continuous low-pressure systems over Canada helped to initiate large-scale cold air transport from the Arctic into the United States and Canada, also powered by the Polar Vortex in the stratosphere.

We continue to see the presence of the low-pressure area over Canada in the forecast for February. But the forecast now indicates an interesting core movement of the Polar Vortex in the stratosphere, likely to initiate another deep cold event around mid-month over the United States and Canada.

Impact on Arctic Ice Extents
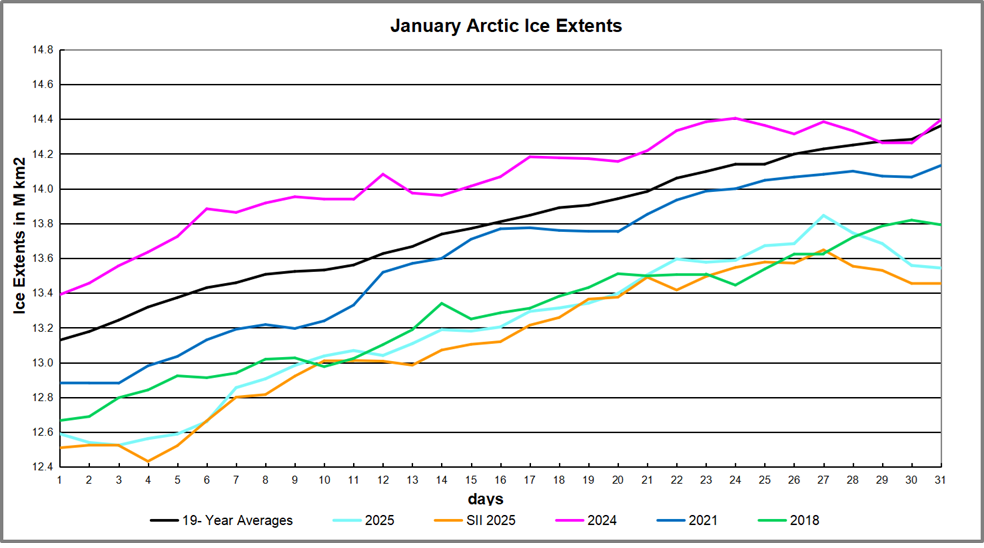
The 19-year average for January shows Arctic ice extents started at 13.13M km2 and ended the month at 14.36M km2.  2024 started somewhat higher and matched average at the end.  Other recent years have been lower, and 2025 started 540k km2 in deficit and 818k km2 below average at month end. The gap had closed to 400k km2 before losing extents at the end.  SII and MASIE tracked closely this month.

The table below shows year-end ice extents in the various Arctic basins compared to the 19-year averages and some recent years.  2007 seven was close the the average, 2018 is shown for comparison.

Region 2025031 Ave Day 031 2025-Ave. 2018031 2025-2018
 (0) Northern_Hemisphere 13543740 14362137 -818398 13792271 -248532
 (1) Beaufort_Sea 1071001 1070386 614 1070445 556
 (2) Chukchi_Sea 965989 965974 15 965971 18
 (3) East_Siberian_Sea 1087137 1087063 74 1087120 18
 (4) Laptev_Sea 897845 897824 21 897845 0
 (5) Kara_Sea 921520 917381 4139 895363 26157
 (6) Barents_Sea 428814 563859 -135044 481947 -53133
 (7) Greenland_Sea 614789 613370 1418 501411 113378
 (8) Baffin_Bay_Gulf_of_St._Lawrence 1080930 1328380 -247450 1406903 -325972
 (9) Canadian_Archipelago 854878 853510 1368 853109 1769
 (10) Hudson_Bay 1260903 1260778 125 1260838 66
 (11) Central_Arctic 3211379 3210507 872 3184817 26562
 (12) Bering_Sea 534452 648807  -114354 382206 152245
 (13) Baltic_Sea 39334 62876  -23542 41713.99 -2380
 (14) Sea_of_Okhotsk 559692 823877  -264185 704398 -144707

This year’s ice extent is 818k km2 or 5.7% below average.  About half of the deficit comes from the Pacific basins of Bering and Okhotsk sea.  The other two major losses are in Barents Sea and Baffin Bay.  With the annual maximum typically occurring mid-March, it is likely the ice then will also be lower than usual.   


Illustration by Eleanor Lutz shows Earth’s seasonal climate changes. If played in full screen, the four corners present views from top, bottom and sides. It is a visual representation of scientific datasets measuring Arctic ice extents and NH snow cover.


via Science Matters

https://ift.tt/HE6iAYz

February 1, 2025 at 03:16PM