Only bad people get their news from social media and believe “conspiracy theories”

By Jo Nova

The Blob are afraid the readers will believe social media…

Academics and the old dying media have produced a study that “proves” people who believe social media posts are bad people. Only horrible people get their news from sites like X or TikTok and score badly on civic values.

The trick in this “peer reviewed” propaganda is  how they define civic values. You might think it means checking on elderly neighbors, donating to charity, or volunteering at the Scouts, but actually “Civic values were defined as an individual’s belief in democratic institutions “. So if you question parliament or universities you are not a good citizen. The institutions are sacred!

This transparent paper is just a get out of jail free card for sloppy self serving academics. Mike Benz warned us that the Blob redefined “democracy” as “democratic institutions” in 2016, which meant people could be tarred with the “anti-democratic” brush if they criticized the “essential institutions” of democracy, like elections, insurrections,  vaccines, or senile Presidents.

Amanda Meade, The Guardian

Those who believe global heating is a conspiracy get most of their information about news and current events from commercial and social media, according to a study by researchers at Monash University.

The study, led by Prof Mark Andrejevic and Assoc Prof Zala Volcic, found that those who relied on social media as the main source of news scored lower on a measure of “civic values” than people who relied on newspapers and non-commercial media.

Civic values were defined as an individual’s belief in democratic institutions and practices, as well as their openness to considering perspectives that challenged their own.

Of course, having redefined “civic values” they can also define “conspiracies” any way they want. Even if a Nobel Prize winner is not convinced about a wild hypothesis invented by B Grade modelers, just call it a conspiracy…

For the climate change question, researchers asked whether “fluctuations in the climate are the result of natural cycles that take place regardless of human activity”.

Of those who got most of their news from commercial TV and radio, 37% agreed with the statement. Of those who got most of their information from social media, 25% believed climate change was a conspiracy.

To rephrase, nearly 40% of the people said climate fluctuation is natural, which presumably the team at Monash would call a “conspiracy”.  The Sun colludes with the moon-wolf or something.

But the social purity of the ABC radio audience is 98%. They are practically offering hypnosis:

Conversely, those who disbelieved in conspiracies about climate change were more likely to get their information from public broadcasters ABC and SBS. Only 2% of those whose main source of information was public radio and 6% of those whose main source was public television believed the climate crisis was a conspiracy.

So 98% of public radio listeners all think the same thing on a complex topic, and this is supposed to a sign of a healthy democracy?

But the good news is that 60% of Australians mainly get their news from social media sources.
No wonder the Blob is worried. Only 34% got their news from Channel Seven, Nine and Ten, and just 6% got it from ABC or SBS public broadcasters.


REFERENCE


0 out of 10 based on 0 rating

via JoNova

https://ift.tt/5jt69a3

January 28, 2025 at 02:33PM

Devious Climate Attribution Studies

Patrick Brown raises the question Do Climate Attribution Studies Tell the Full Story? Excerpts in italics with my bolds and added images, his analysis concluding thusly:

How a cascade of selection effects bias
the collective output of extreme event attribution studies.

Weather and climate extremes—such as high temperatures, floods, droughts, tropical cyclones, extratropical cyclones, and severe thunderstorms—have always threatened both human and natural systems. Given their significant impacts, there is considerable interest in how human-caused climate change influences these extremes. This is the focus of the relatively new discipline of Extreme Event Attribution (EEA).

Over the past couple of decades, there has been an explosion in EEA studies focusing on (or, “triggered by”) some prior notable weather or climate extreme. Non-peer-reviewed reports from World Weather Attribution (e.g., here, here, and here) represent some of the most notable examples of these kinds of analyses, and many similar studies also populate the peer-reviewed literature. The Bulletin of the American Meteorological Society’s “Explaining Extreme Events From a Climate Perspective” annual series compiles such studies, as does the Sabin Center for Climate Change Law, and they are also synthesized in reports like those from the IPCC (IPCC WG1 AR6 Chapter 11.2.3) and the United States National Climate Assessment.

The collective output of these kinds of studies certainly gives the impression that human-caused climate change is drastically changing the frequency and intensity of all kinds of weather extremes. Indeed, Carbon Brief recently published an extensive summary of the science of EEA studies, which begins with the proclamation, “As global temperatures rise, extreme weather events are becoming more intense and more frequent all around the world.”

However, these numbers cannot be taken as an accurate quantification of the influence of climate change on extreme weather because they are heavily influenced by a cascade of selection biases originating from the physical climate system, as well as researcher and media incentives. Identifying and understanding these biases is a prerequisite for properly interpreting the collective output of EEA studies and, thus, what implications they hold for general scientific understanding, as well as political and legal questions.

The large apparent discrepancy between the size of the influence of human-caused climate change on extreme weather reported in EEA studies (like those compiled by Carbon Brief) compared to more comprehensive systematic analyses (like those compiled by the IPCC) can, in large part, be attributed to the many layers of Selection Biases that influence the EEA literature’s collective output.

Selection Bias is a broad term that refers to any bias that arises from a process that selects data for analysis in a way that fails to ensure that data is representative of the broader population that the study wishes to describe.

Selection biases in the context of EEA studies include those associated with the physical climate system itself, those concerning proclivities and incentives facing researchers/journals, and those concerning the proclivities and incentives facing the media. They include
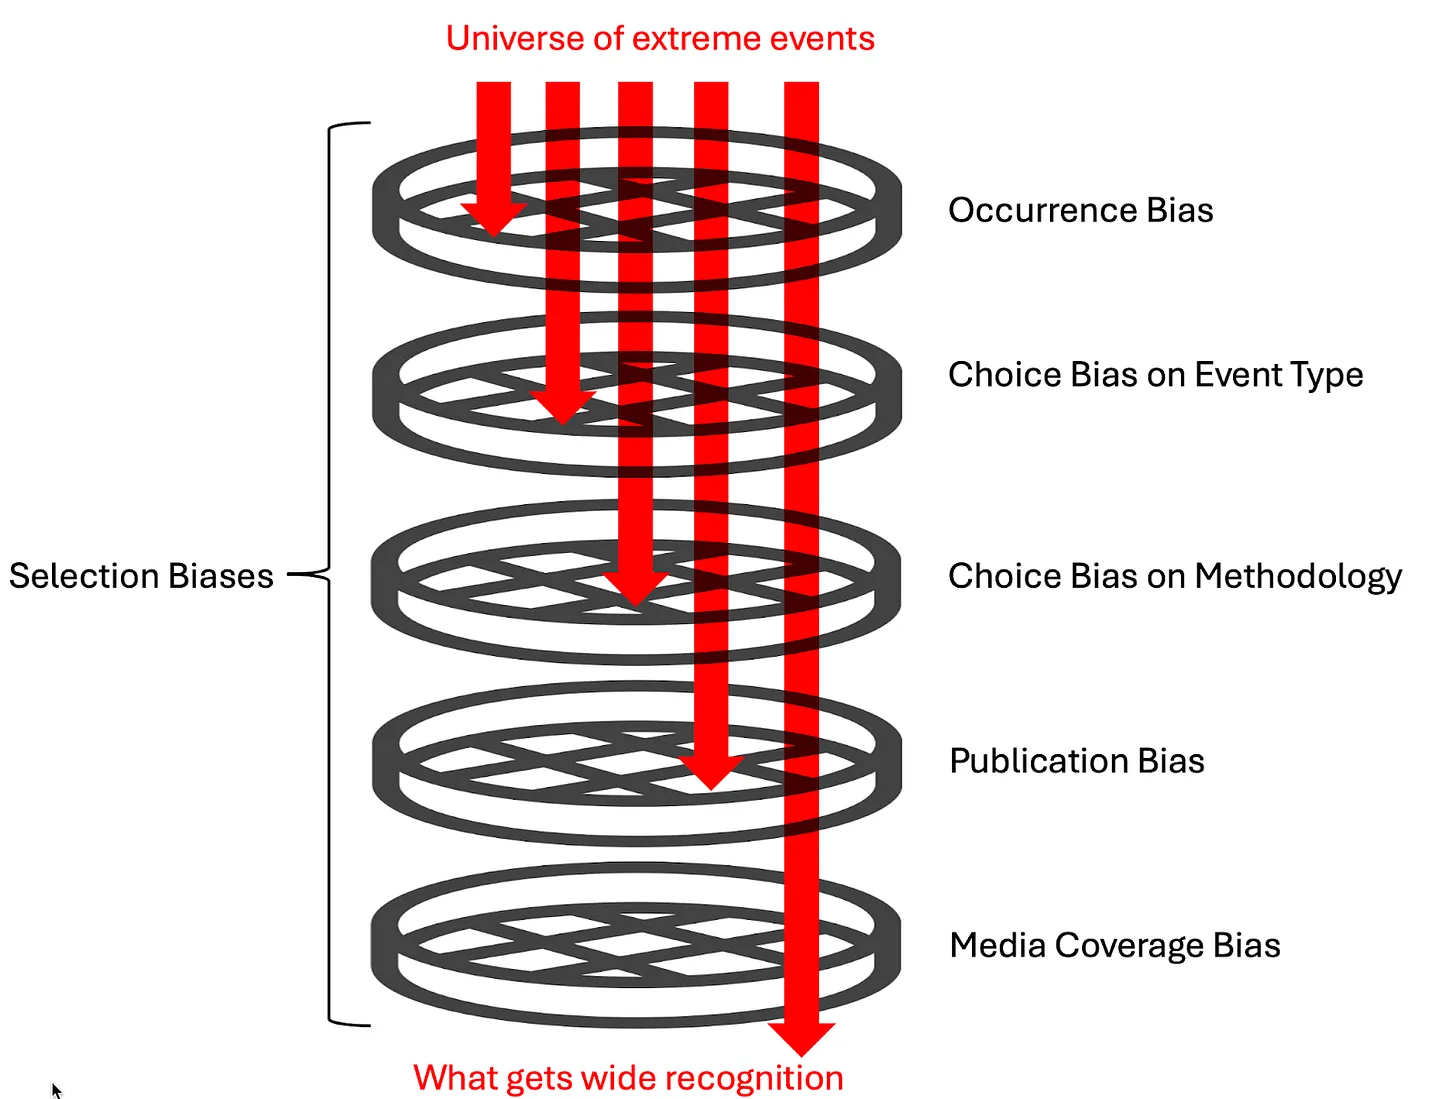
Occurrence Bias is a bias introduced by the physical climate system. Since EEA studies tend to be triggered by extreme events that have actually occurred, there is reason to believe that these studies will disproportionately sample events that are more likely than average to be exacerbated by climate change because the events occurred in the first place. Essentially, extreme events that are more likely to occur under climate change—and thus more likely to be observed—are going to be overrepresented in EEA studies, and extreme events that are less likely to occur under climate change—and thus less likely to be observed—are going to be underrepresented in EEA studies.

The map below illustrates this phenomenon. It shows changes in the magnitude of extreme drought under climate change. Specifically, it shows the fractional change in the intensity of once-per-50-year droughts (as quantified by monthly soil moisture) between a preindustrial and 21st-century run (SSP2-4.5 emissions) of the highly-regarded NCAR CESM2 Climate Model. Blue areas represent locations where the model simulates that extreme droughts become less frequent and intense with enhanced greenhouse gas concentrations, and red areas represent locations where the model simulates that extreme droughts become more frequent and intense with enhanced greenhouse gas concentrations. It is notable that overall, this model simulates that warming decreases the frequency and intensity of extreme drought in more locations than it increases it (consistent with soil moistening under warming simulated by other models).
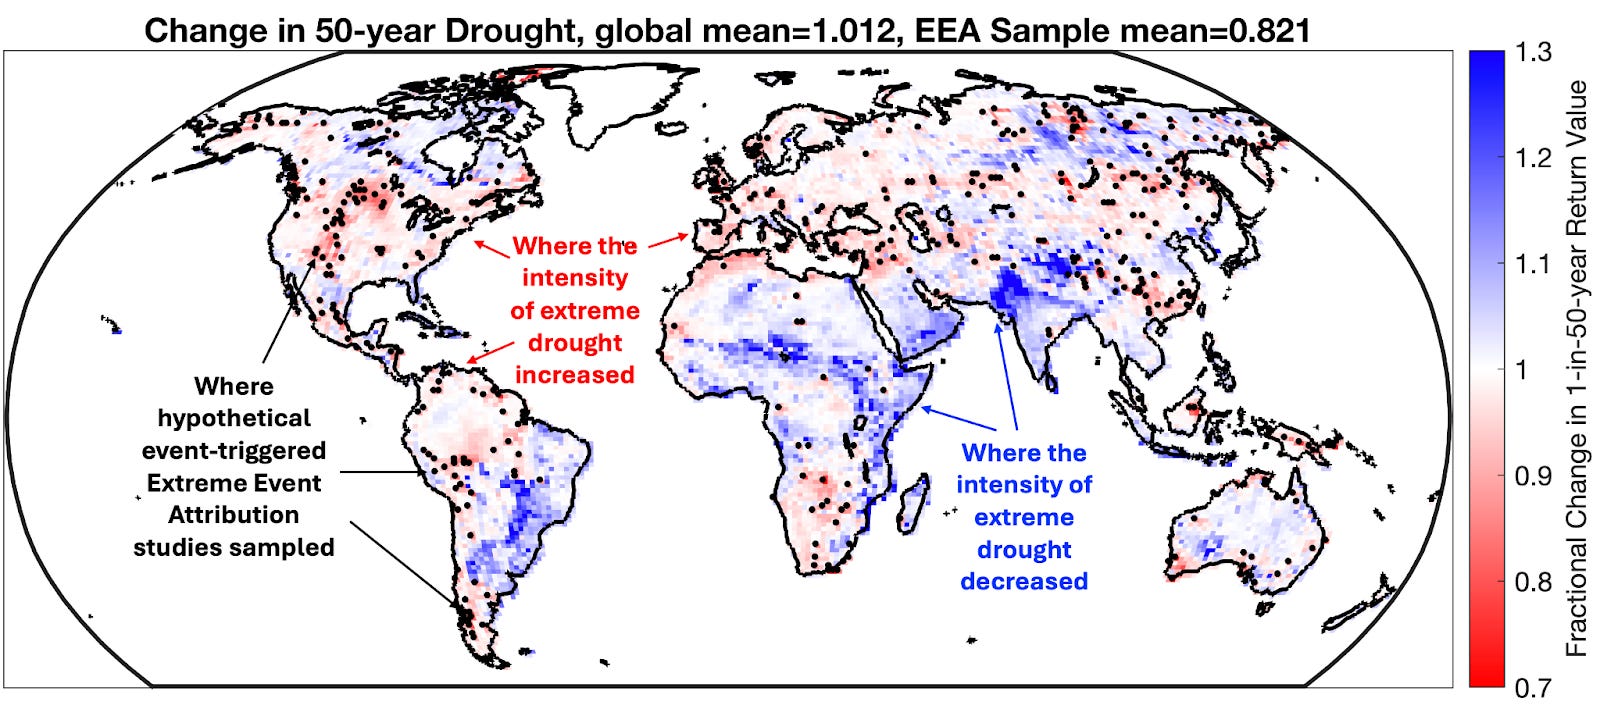
Now, here’s the kicker: The dots show locations where once-per-50-year droughts actually occurred in the 21st-century simulation and thus represent events that would plausibly trigger EEA studies.

What do you notice about where the dots are compared to where the red is? That’s right; the simulated EEA studies overwhelmingly sample areas where droughts are getting more intense and more frequent by the very nature that those are the types of droughts that are more likely to occur in the warming climate. The result is that the EEA sample is majorly biased: warming decreased the intensity of once-per-50-year droughts by about 1% overall, but it increased their intensity within the EEA sample by 18%!

Thus, if you just relied on the EEA sample, you would come away with an
incorrect impression not only on the magnitude of change in extreme droughts
but also on the sign of the direction of change!

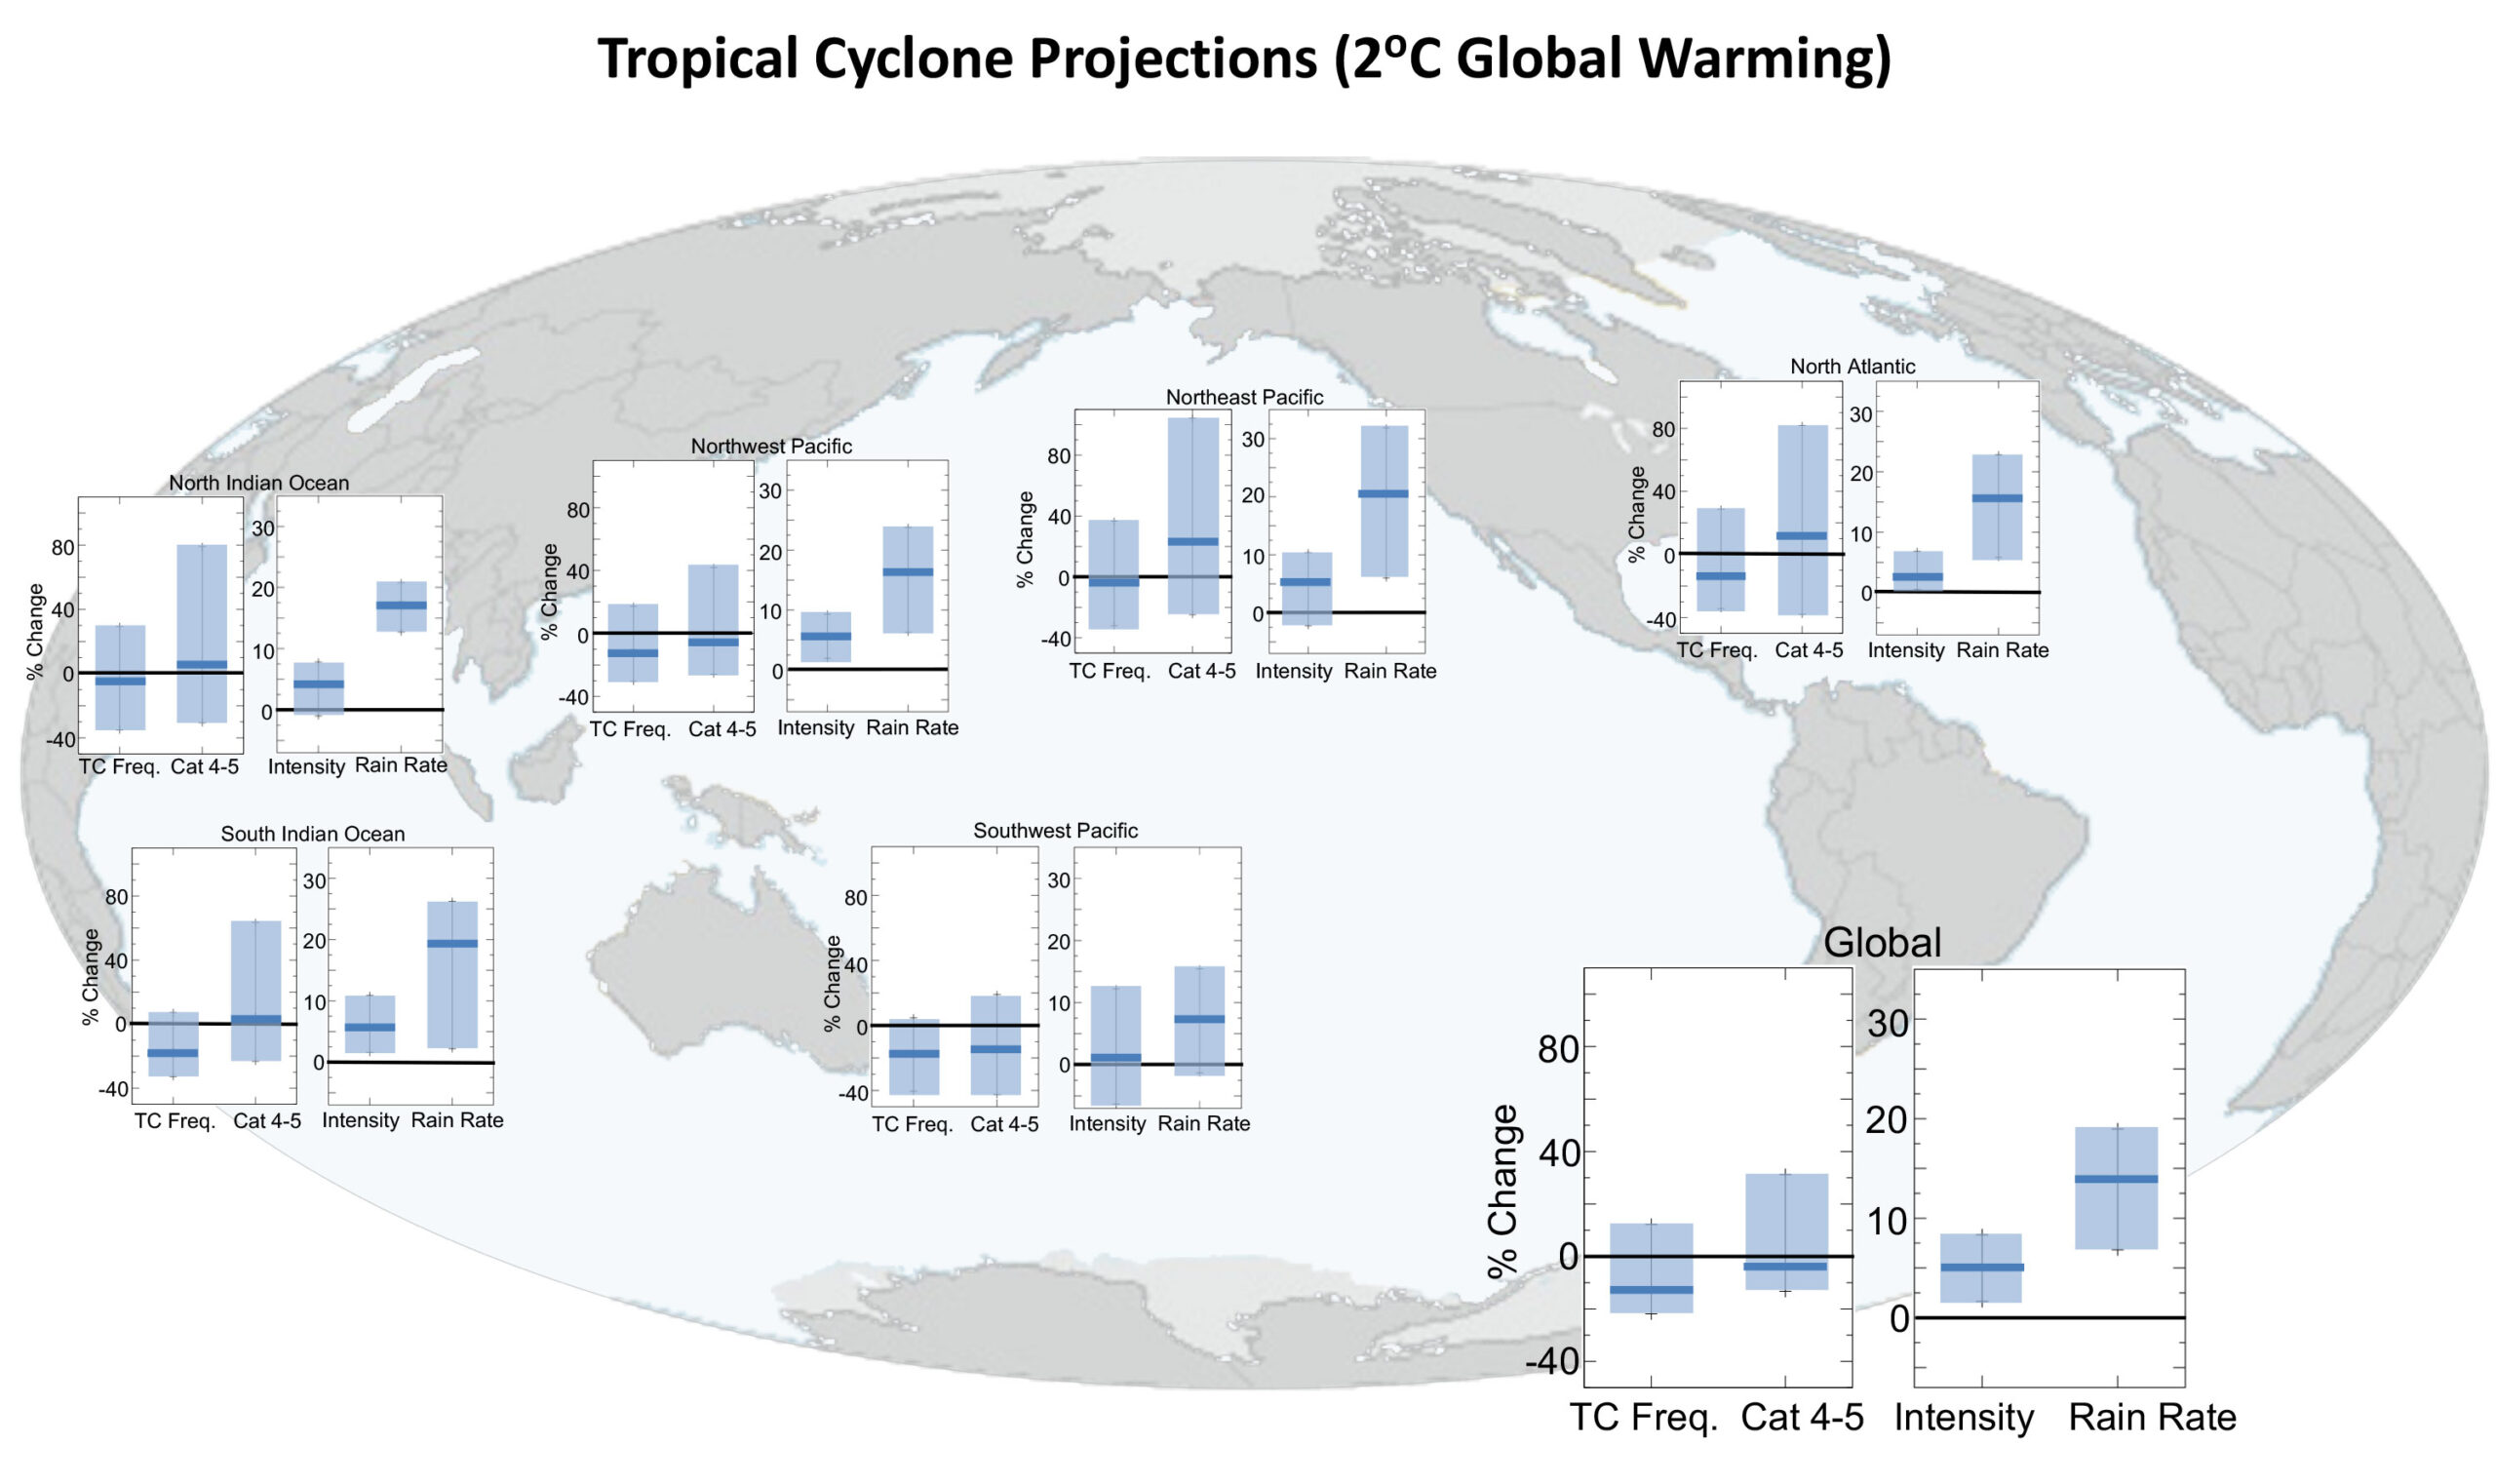
Choice Bias arises when researchers use prior knowledge to choose events for EEA studies that are more likely to have been made more severe by climate change. A clear example of Choice Bias pervading the Carbon Brief database is there have been 3.6 times more studies on extreme heat than there have been on extreme winter weather (205 vs. 57). Another example would be the dearth of EEA studies on extratropical cyclones (the kinds of low-pressure systems with cold and warm fronts that are responsible for most of the dramatic weather outside of the tropics). The IPCC states that the number of extratropical cyclones associated with intense surface wind speeds is expected to decrease strongly in the Northern Hemisphere with warming. Yet, it is relatively rare for EEA attribution studies to be done on these types of systems, which results in an exclusion of this good news from the EEA literature.
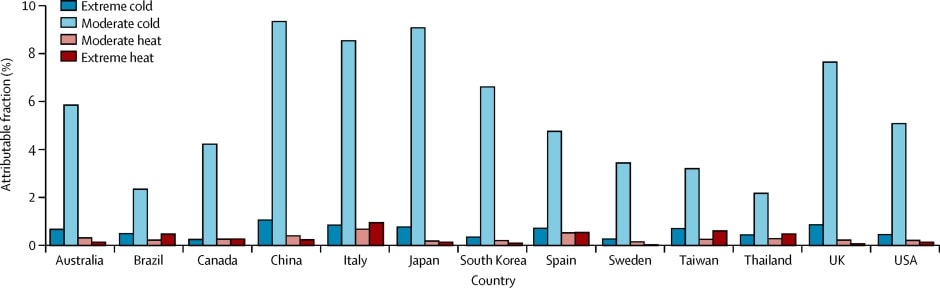
Publication Bias could be playing a role, too, where researchers are more likely to submit, and journals are likely to publish studies that report significant effects on salient events compared to studies that find null effects.
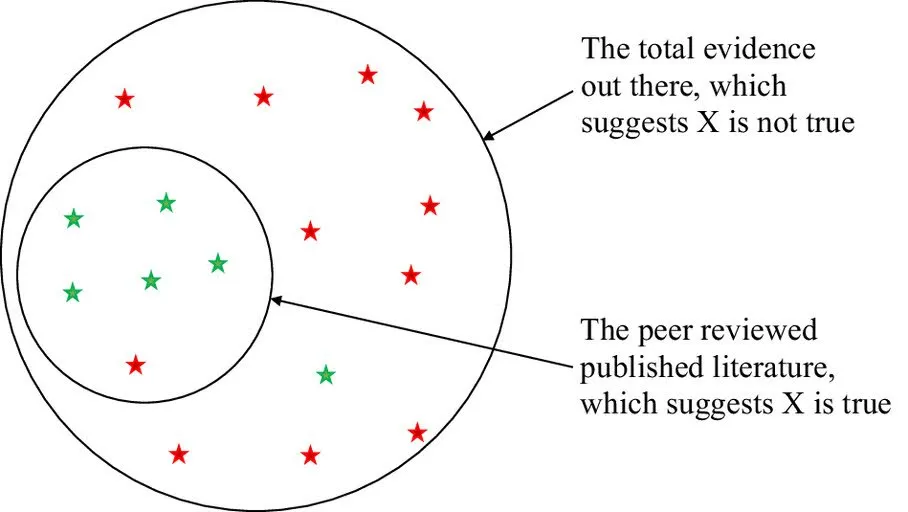
From Clark et al., 2023

Finally, the climate reporting media ecosystem is characterized by actors whose explicit mission is to raise awareness of the negative impacts of climate change, and thus, there will be a natural Media Coverage Bias with a tendency to selectively highlight EEA studies where climate change is found to be a larger driver than EEA studies that do not reach such a conclusion. These selection biases are apparent at the aggregate level, but there is also strong evidence of their presence in individual studies.
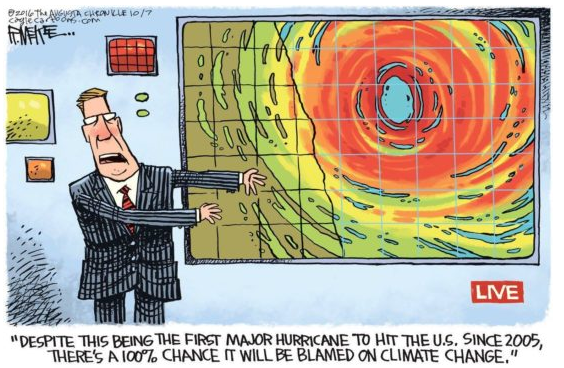
A more recent specific example suggestive of many of these dynamics is a study, Gilford et al. (2024), titled “Human-caused ocean warming has intensified recent hurricanes”. This study was conducted by three researchers at Climate Central, which summarizes the study’s findings with the following infographic:
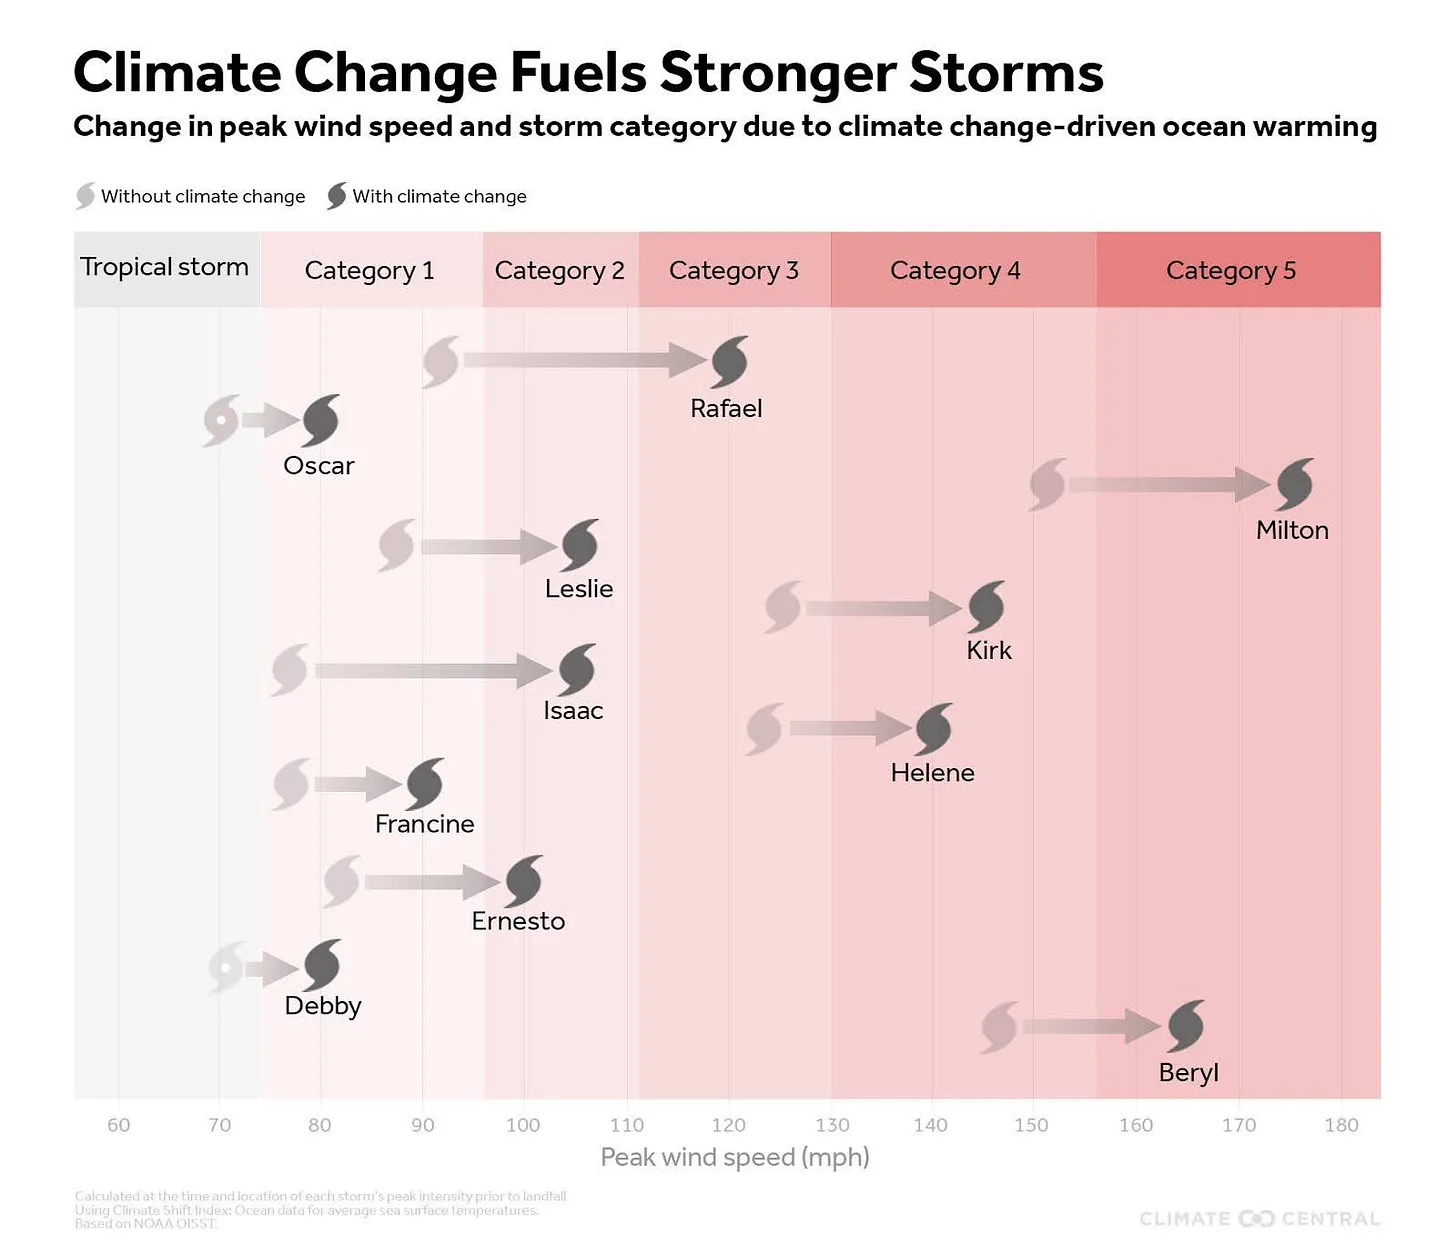
From Climate Central press release on Gilford et al. (2024).

Essentially, they claim that climate change is enhancing the intensity of all hurricanes and that the enhancement is quite large: Storms today are calculated to be an entire Category stronger than they would have been in a preindustrial climate.

This is a huge effect, and thus, if it were real, it is reasonable to expect to see clear long-term trends in metrics of tropical cyclone (hurricane) intensity like the accumulated number of major (Category 3+) hurricane days or the accumulated cyclone energy from all tropical cyclones (which is proportional to the square of hurricane windspeed accumulated over their lifetimes). However, any long-term trends in such metrics are subtle at best, both globally and over the North Atlantic.
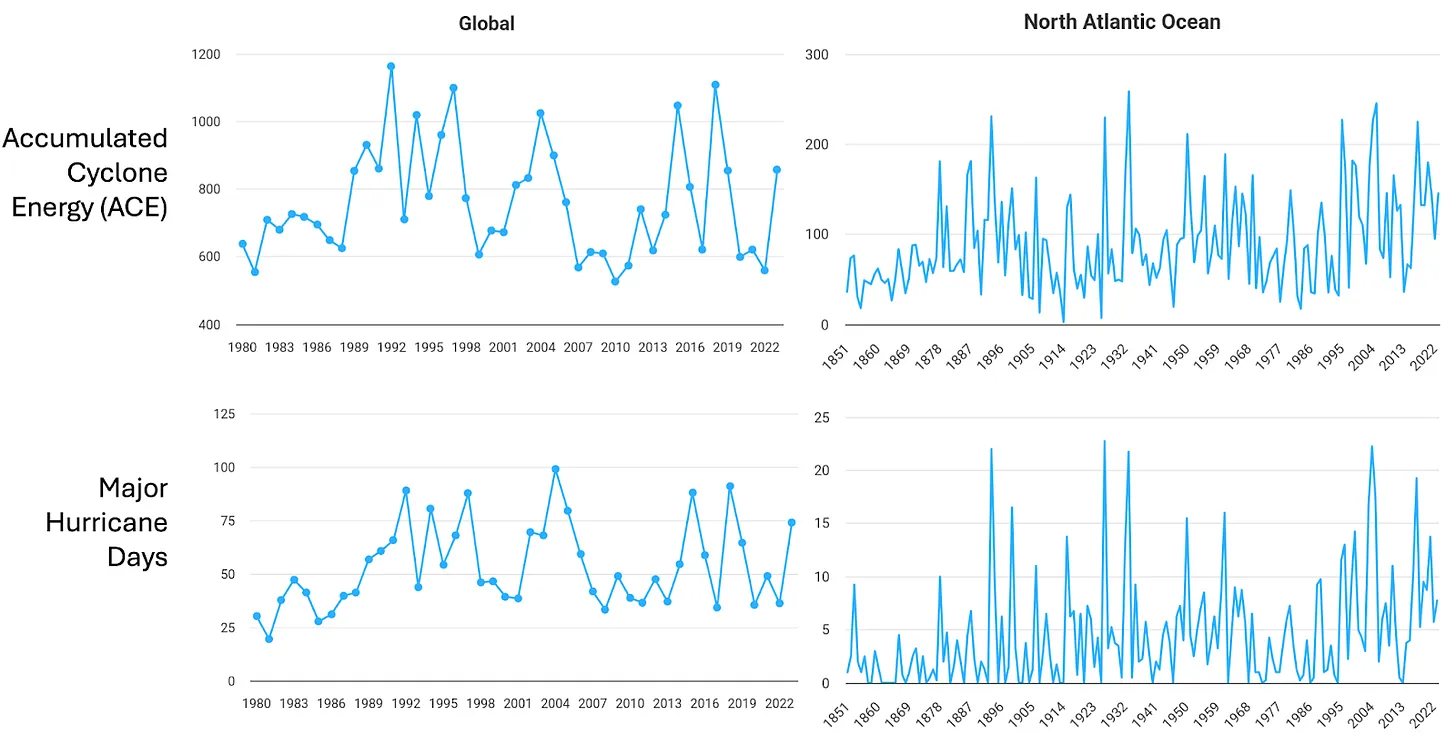
From Colorado State University Department of Atmospheric Science Tropical Meteorology Project.

So, this is a microcosm of the aforementioned apparent discrepancy between more broad quantifications of changes in extremes and their associated EEA counterparts, and again, I’d argue there are several selection biases at play affecting the production and dissemination of the EEA study.

Let’s start with Choice Bias on methodology. Human-caused warming changes the environment in some ways that work to enhance hurricanes and in other ways that diminish them. The main way that hurricanes are enhanced is via the increase in sea surface temperatures (which provides the fundamental fuel for hurricanes), and the main way that hurricanes are diminished is via changes in atmospheric wind shear and humidity.

The net result of these countervailing factors pulling in opposite directions is that we expect fewer hurricanes overall, but when hurricanes are able to form, they can be stronger than they would otherwise. These factors, though, are small relative to natural random variability, and thus, they are difficult to detect in observations.

However, the Climate Central researchers made the methodological choice
to largely exclude the influence of factors that diminish
hurricane development from the study.

Are these Choice Biases in event type and methodology an accident? There are many reasons to believe they are not.

The research paper itself spells out that the motivation of the study is to “connect the dots” between climate change and hurricanes because “landfalling hurricanes with high intensities—can act as ‘focusing events’ that draw public attention” and that “Increased attention during and in wake of storms creates opportunities for public and private discourse around climate and disaster preparedness.”
Then, there is the extensive media coverage of this study. It was picked up by 134 news outlets and ranked in the 99.95th percentile of research articles (across all journals) of similar age in terms of online attention. Further, it was immediately incorporated into seven Wikipedia articles (likely having high leverage on AI queries, which would make its findings indistinguishable from scientific “fact”). This is affected by the aforementioned Media Coverage Bias, but it is also undoubtedly directly influenced by the efforts of Climate Central, which is explicitly an advocacy organization whose self-described specialty is media placement and dissemination. 
The above sheds light on the reasons for certain choice biases in a particular study, but there is plenty of evidence that these selection biases are pervasive in the EEA field. After all, Dr. Myles Allen essentially founded the field with the motivation of answering the question, “Will it ever be possible to sue anyone for damaging the climate?”. This same motivation seems to animate many of the most high-profile scientists in the field today, like Allen’s protege, Dr. Friederike Otto (co-founder and leader of World Weather Attribution). She and her organization are frequently cited as bringing the necessary intellectual authority to credibly sue fossil fuel companies. She states the motivation of her work explicitly:

“Attributing extreme weather events to climate change, as I do
through my work as a climatologist, means we can hold
countries and companies to account for their inaction.”

Given the explicitly stated motivation of those in the EEA field, it is quite reasonable to suppose that there are major selection biases at play, and thus, it is not at all surprising that the collective output of the EEA field would look so different from more broad comprehensive assessments.


via Science Matters

https://ift.tt/gAoQmTM

January 28, 2025 at 01:40PM

The Case Against Net Zero – A Ninth Update

In October 2008, Parliament passed the Climate Change Act requiring the UK Government to ensure that by 2050 ‘the net UK carbon account’ was reduced to a level at least 80% lower than that of 1990; ‘carbon account’ refers to CO2 and ‘other targeted greenhouse gas emissions’. Only five MPs voted against it. Then in 2019, by secondary legislation and without serious debate, Parliament increased the 80% to 100%i, creating the Net Zero policy (i.e. any emissions must be offset by equivalent removals from the atmosphere).

Unfortunately, it’s a policy that’s unachievable, potentially disastrous and in any case pointless. And that’s true whether or not humanity’s greenhouse gas emissions are contributing to increased global temperatures.

1. It’s unachievable.

A modern, advanced economy depends on fossil fuels; something that’s unlikely to change for a long time.ii Examples fall into two categories: (i) vehicles and machines such as those used in agriculture, mining and quarrying, mineral processing, building, the transportation of heavy goods, commercial shipping, commercial aviation, the military and emergency services and (ii) products such as nitrogen fertilisers, cement and concrete, primary steel, plastics, insecticides, pharmaceuticals, anaesthetics, lubricants, solvents, paints, adhesives, insulation, tyres and asphalt. All the above require either the combustion of fossil fuels or are made from oil derivatives: easily deployable, commercially viable alternatives have yet to be developed.iii

Although wind is the most effective source of renewable electricity in the U.K. – because of its latitude, solar power contributes only a small percentage of the UK’s electricity – it has significant problems: (i) the substantial costs of subsidising, building, operating and maintaining the huge numbers of turbines needed for Net Zero – all exacerbated by high interest rates; (ii) the complex engineering and cost challenges of establishing a stable, reliable, comprehensive non-fossil fuel grid by 2030 as planned by the Government; (iii) the vast scale of what’s involved (a multitude of enormous wind turbines, immense amounts of space iv and large quantities of increasingly unavailable and expensive raw materials and components v); and (iv) the intermittency of renewable energy (see 2 below).vi This means that the UK may be unable to generate sufficient electricity by 2030 for current needs let alone for the mandated EVs and heat pumps and for the energy requirements of industry and of the huge new data centres being developed to support for example the government’s plans for the rapid growth of artificial intelligence (AI).vii

In any case, the UK doesn’t have enough skilled technical managers, electrical, heating and other engineers, electricians, plumbers, welders, mechanics and other skilled tradespeople required to do the multitude of tasks essential to achieve Net Zero – a problem worsened by the Government’s plans for massively increased house building.viii

2. It would be socially and economically disastrous.

The Government aims for 95% renewable electricity by 2030 but has not yet published a fully costed engineering plan for the provision of comprehensive grid-scale back-up when there’s little or no wind or sun; a problem that’s complicated by the likely retirement of elderly nuclear and fossil fuel power plants. The Government has indicated that back-up may be provided by new gas-fired power plants ix and possibly by ‘green’ hydrogen. But it has yet to publish any detail about its plans for either. The former is obviously not a ‘clean’ solution and it seems the Government’s answer is to fit the power plants with carbon capture and underground storage (CCS) systems. But both green hydrogen and CCS are very expensive, controversial and commercially unproven at scale.x This issue is desperately important: without full back-up, electricity blackouts would be inevitable – potentially ruining many businesses and causing dreadful problems for millions of people, including serious health consequences threatening everyone and in particular the poor and vulnerable.xi

Net Zero’s major problem however is its overall cost and the impact of that on the economy. Because there’s no comprehensive plan for the project’s delivery, little attention has been given to overall cost; but with several trillion pounds seeming likely to be a correct estimate it seems likely to be unaffordable.xii The borrowing and taxes required for costs at this scale would put a huge burden on millions of households and businesses and, particularly in view the economy’s many current problems, could jeopardise Britain’s international credit standing and threaten the country’s economic viability.

But Net Zero is already contributing to a serious economic problem: essentially because of the costs of renewables (e.g. subsidies and back-up to cope with intermittency), the UK has the highest industrial and amongst the highest domestic electricity prices in the developed world.xiii The additional costs referred to elsewhere in this essay – for example the costs of establishing a comprehensive non-fossil grid and of fitting CCS systems to gas-fired power plants used as back-up – can only make this worse. And high energy costs are incompatible with the government’s principal mission of increased economic growth. 

Net Zero would have two other dire consequences:

(i) As it essentially controls the supply of key materials (for example, lithium, cobalt, aluminium, processed graphite, nickel, copper and so-called rare earths) without which renewables cannot be manufactured, the UK would greatly increase its already damaging dependence on China, putting its energy and overall national security at most serious risk.xiv

(ii) The vast mining and mineral processing operations required for renewables are already causing appalling environmental damage and dreadful human suffering throughout the world, affecting in particular fragile, unspoilt ecosystems and many of the world’s poorest and most vulnerable people.xv The continued pursuit of Net Zero would make all this far worse.

3. In any case it’s pointless.

For two reasons:

(i) It’s absurd to regard the closure of greenhouse gas (GHG) emitting plants in the UK and their ‘export’ mainly to SE Asian countries (especially China), commonly with poor environmental regulation and often powered by coal-fired electricity – thereby increasing global emissions – as a positive step towards Net Zero. Yet efforts to ‘decarbonise’ the UK mean that’s what’s happening: it’s why our chemicals industry faces extinctionxvi and why, by closing our few remaining blast furnaces, we will soon be unable to produce commercially viable primary steel (see endnote 3).xvii

(ii) The USAxviii plus most major non-Western countries – together the source of over 80% of GHG emissions and home to about 85% of humanity – don’t regard emission reduction as a priority and, either exempt (by international agreement) from or ignoring any obligation to reduce their emissions, are focused instead on energy abundance and thus on economic and social development, poverty eradication and energy security.xix As a result, global emissions are increasing (by 62% since 1990) and are set to continue to increase for the foreseeable future. As the UK is the source of only 0.72% of global emissions any further emission reduction it makes (even to zero) would make no perceptible difference to the global position.xx

In other words, Net Zero means the UK is legally obliged to pursue an unachievable, potentially disastrous and pointless policy – a policy that could result in Britain’s economic destruction.

Robin GuenierJanuary 2025

Guenier is a retired, writer, speaker and business consultant. He has a degree in law from Oxford, is qualified as a barrister and for twenty years was chief executive of various high-tech companies, including the Central Computing and Telecommunications Agency reporting to the UK Cabinet Office. A Freeman of the City of London, he was Executive Director of Taskforce 2000, founder chair of the medical online research company MedixGlobal and a regular contributor to TV and radio.

End notes:

ihttp://www.legislation.gov.uk/ukpga/2008/27/part/1/crossheading/the-target-for-2050

ii See Vaclav Smil’s important book, How the World Really Works: https://time.com/6175734/reliance-on-fossil-fuels/

iii Regarding steel for example see the penultimate paragraph of this article and: https://www.construction-physics.com/p/the-blast-furnace-800-years-of-technology.

iv See Andrews & Jelley, “Energy Science”, 3rd ed., Oxford, page 16: http://tiny.cc/4jhezz

vhttp://tiny.cc/b9qtzz

vi For a view of wind power’s many problems, see this: https://watt-logic.com/2023/06/14/wind-farm-costs/ This is also relevant: https://davidturver.substack.com/p/debunking-cheap-renewables-myth

viihttps://www.theguardian.com/technology/2025/jan/14/keir-starmer-ai-labour-green-energy-promise

viii A detailed Government report: http://tiny.cc/bgg5001 See also pages 10 and 11 of the Royal Academy of Engineering report (Note 6 below). Also see: https://www.bbc.com/news/articles/c5yg1471rwpo

ix See this report by the Royal Academy of Engineering: https://nepc.raeng.org.uk/media/uoqclnri/electricity-decarbonisation-report.pdf (Go to section 2.4.3 on page 22.) This interesting report contains a lot of valuable information.

x This report on CCS is useful: https://www.iisd.org/articles/insight/unpacking-carbon-capture-storage-technology And this article is interesting: http://tiny.cc/psp7001 Re hydrogen see this: https://www.manhattancontrarian.com/blog/2024-2-14-when-you-crunch-the-numbers-green-hydrogen-is-a-non-starter.

xi This article shows how more renewables could result in blackouts: http://tiny.cc/lnhezz

xii The National Grid (now the National Energy System Operator (NESO)) has said net zero will cost £3 trillion: https://www.current-news.co.uk/reaching-net-zero-to-cost-3bn-says-national-grid-eso/. And in this presentation Michael Kelly, Emeritus Professor of Technology at Cambridge, shows how the cost would amount to several trillion pounds: https://www.youtube.com/watch?v=NkImqOxMqvU

xiii For current international price comparisons go to p. 22 here: http://tiny.cc/xan6001 Note that industrial electricity prices are well above those of international competition – and that’s not because of gas prices which are about average (p. 23).

xivhttps://www.dw.com/en/the-eus-risky-dependency-on-critical-chinese-metals/a-61462687 and https://www.politicshome.com/thehouse/article/dependency-china-critical-minerals-dangerous

xv See for example http://tiny.cc/3lhezz and http://tiny.cc/gtazzz. Arguably however the most compelling and harrowing evidence is found in Siddharth Kara’s book Cobalt Red – about the horrors of cobalt mining in the Congo: https://us.macmillan.com/books/9781250284297/cobaltred

xvihttp://tiny.cc/chg5001

xvii A current example: https://www.bbc.co.uk/news/articles/c70zxjldqnxo

xviii Note: Trump’s abandoning plans for renewables is not really such a huge change for the US as, despite his climate policies, the oil and gas industries flourished under Biden: http://tiny.cc/2ww1001

xix This essay shows how developing countries have taken control of climate negotiations: https://ipccreport.wordpress.com/wp-content/uploads/2020/07/the-west-vs-the-rest-2.1.1.pdf (Nothing that’s happened since 2020 changes the conclusion: for example see the ‘Dubai Stocktake’ agreed at COP28 in 2023 of which item 38 unambiguously confirms developing countries’ exemption from any emission reduction obligation.)

xx This comprehensive analysis, based on an EU Commission database, provides – re global greenhouse gas (GHG) and CO2 emissions – detailed information by country from 1990 to 2023: https://edgar.jrc.ec.europa.eu/report_2024?vis=ghgtot#emissions_table

via Climate Scepticism

https://ift.tt/Zg83ByX

January 28, 2025 at 12:43PM

Another Ocean Warming Scare: Bad Models, Bad Data, and a Clear Agenda

Abstract

Global mean sea surface temperature (GMSST) is a fundamental diagnostic of ongoing climate change, yet there is incomplete understanding of multi-decadal changes in warming rate and year-to-year variability. Exploiting satellite observations since 1985 and a statistical model incorporating drivers of variability and change, we identify an increasing rate of rise in GMSST. This accelerating ocean surface warming is physically linked to an upward trend in Earth’s energy imbalance (EEI). We quantify that GMSST has increased by 0.54 ± 0.07 K for each GJ m–2 of accumulated energy, equivalent to 0.17 ± 0.02 K decade‒1 (W m‒2)‒1. Using the statistical model to isolate the trend from interannual variability, the underlying rate of change of GMSST rises in proportion with Earth’s energy accumulation from 0.06 K decade–1 during 1985–89 to 0.27 K decade–1 for 2019–23. While variability associated with the El Niño Southern Oscillation triggered the exceptionally high GMSSTs of 2023 and early 2024, 44% (90% confidence interval: 35%–52%) of the +0.22 K difference in GMSST between the peak of the 2023/24 event and that of the 2015/16 event is unexplained unless the acceleration of the GMSST trend is accounted for. Applying indicative future scenarios of EEI based on recent trends, GMSST increases are likely to be faster than would be expected from linear extrapolation of the past four decades. Our results provide observational evidence that the GMSST increase inferred over the past 40 years will likely be exceeded within the next 20 years. Policy makers and wider society should be aware that the rate of global warming over recent decades is a poor guide to the faster change that is likely over the decades to come, underscoring the urgency of deep reductions in fossil-fuel burning.

https://iopscience.iop.org/article/10.1088/1748-9326/adaa8a

Of course the news stories were all teed up ready to publish the moment the embargo was lifted.

Ocean-surface warming four times faster now than late-1980s

Ocean temperature rise accelerating as greenhouse gas levels keep rising

The surface of our oceans is now warming four times faster than it was in the late 1980s

Another day, another climate “crisis” declared by scientists who seem more interested in pushing policy than in practicing rigorous, unbiased science. The latest entry in this parade of alarmism comes from Merchant et al., who claim to have proven that sea surface temperature (SST) is accelerating at an alarming rate due to Earth’s Energy Imbalance (EEI). Their solution? The usual—immediate and severe reductions in fossil fuel use. But before we surrender modern civilization to the dictates of climate activists, let’s take a closer look at this paper and see if its conclusions hold up.

Spoiler: They don’t.

The House of Cards Built on Uncertain Data

The foundation of Merchant et al.’s argument is that Earth’s oceans are warming faster than before, and this acceleration is due to a growing energy imbalance. The problem? The data they use to reach this conclusion is riddled with uncertainty.

They rely heavily on satellite observations to measure EEI, the supposed imbalance between incoming solar radiation and outgoing heat. However, they openly admit that the absolute accuracy of these measurements is not precise enough to detect imbalances as small as ~1 W/m² with confidence. In other words, they are trying to measure a trend that is smaller than the margin of error in the instruments they use. That alone should be enough to dismiss this study.

But it gets worse.

Because the data is unreliable, they supplement it with “reconstructed” EEI estimates before 2000 using a mix of proxy data and modeling. This means that nearly half their dataset is not even direct observation—it’s modeled guesswork. And yet, they use it to claim they can measure multi-decadal acceleration trends with certainty.

Acceleration? Or a Statistical Magic Trick?

If you go looking for acceleration, you’ll probably find it—especially if you design your statistical model to guarantee that outcome. That’s exactly what Merchant et al. have done.

They test three models to explain sea surface temperature trends:

  1. Linear warming model – Predicts a steady, slow warming trend.
  2. Quadratic model – Assumes an accelerating trend.
  3. EEI-driven model – Uses their highly uncertain EEI data to “explain” why warming is accelerating.

Unsurprisingly, they find that the model assuming acceleration fits best, which is exactly what they wanted to prove in the first place. This is not science—it’s circular reasoning disguised as research.

What they don’t do is consider alternative explanations for the changes in sea surface temperature. Natural ocean cycles like the Pacific Decadal Oscillation (PDO) and Atlantic Multidecadal Oscillation (AMO) can drive temperature fluctuations on multi-decadal timescales. These are well-documented, yet Merchant et al. ignore them entirely, preferring to attribute every fraction of a degree increase to human emissions.

Exaggerating Future Warming for Maximum Alarm

The authors then take their dubious acceleration trend and extrapolate it forward to claim that future ocean warming will far exceed previous estimates. They construct three scenarios:

  1. On-trend – EEI continues rising, leading to catastrophic warming.
  2. Moderate – Warming still accelerates but not as fast.
  3. Mitigated – Even with severe emissions cuts, warming will still accelerate.

This is nothing but a glorified version of the climate doomsday scenario playbook—start with a model that assumes acceleration, plug in arbitrary assumptions about future emissions, and produce worst-case predictions that just happen to align perfectly with the climate policy agenda.

Ignoring Uncomfortable Contradictions

The study claims that EEI has been rising since around 2010 and that this is driving SST acceleration. But even they acknowledge that anthropogenic aerosol reductions (i.e., cleaner air) could be responsible for part of the observed trend. If less pollution is allowing more sunlight to reach the ocean, wouldn’t that mean past warming was suppressed by pollution, rather than proving CO₂-driven warming is out of control?

And if that’s true, wouldn’t this mean that climate models have been overestimating the role of CO₂ all along? Merchant et al. conveniently ignore these contradictions because they don’t support their acceleration narrative.

The Real Purpose of This Study: Climate Policy, Not Science

The biggest red flag in this paper is the authors’ final conclusion:

“Policy makers and wider society should be aware that the rate of global warming over recent decades is a poor guide to the faster change that is likely over the decades to come, underscoring the urgency of deep reductions in fossil-fuel burning.”

Notice how they jump from a scientific claim to a policy demand without hesitation? This is the true goal of the paper: to manufacture an urgent climate crisis that justifies drastic intervention.

No mention of alternative explanations for the observed warming.
No discussion of uncertainties in their methods.
No consideration of the costs or consequences of their proposed policies.

Just a predetermined conclusion wrapped in the appearance of scientific rigor.

Final Verdict: Junk Science in Service of Activism

This paper is not an objective scientific analysis—it is an advocacy document masquerading as research. It relies on uncertain data, manipulates statistical models to reinforce a preferred narrative, and exaggerates future warming to scare policymakers into action.

The truth is, given the uncertainties involved, nothing we are seeing is cause for concern. The climate has always fluctuated, and minor changes in sea surface temperature are entirely within natural variability. The only thing accelerating here is the desperation of climate activists to keep their funding and political influence intact.

The next time you see a breathless headline about “accelerating ocean warming”, remember: bad models, biased assumptions, and agenda-driven science are the real drivers behind these claims—not reality.


Discover more from Watts Up With That?

Subscribe to get the latest posts sent to your email.

via Watts Up With That?

https://ift.tt/NfhuvWK

January 28, 2025 at 12:04PM