No USA Today, Associated Press, and Others, Record Cold and Snowfall in the United States Aren’t Caused by Climate Change

Lately, a series of mainstream news outlets, including USA Today, AP News, BBC Future, and Fast Company, have churned out articles claiming that January 2025’s record cold and heavy snowfall across the United States are to greater or lesser degrees due to climate change, or at least that such a connection can’t be ruled out. This is false. Their arguments hinge on the increasingly popular yet scientifically dubious idea that climate change is disrupting the polar vortex, causing frigid Arctic air to dip southward into mid-latitude regions like the United States. While this explanation is neatly packaged to fit the narrative that “everything bad is caused by climate change,” the science backing these claims is weak, unsubstantiated, and is riddled with contradictions.

The notion that extreme cold spells are a product of global warming flies in the face of both historical records and atmospheric science fundamentals. These stories rely on cherry-picked data and untested theories while ignoring decades of meteorological knowledge about natural climate variability. As outlined below, there is no solid evidence to support these claims. Instead, the mainstream media’s claims rely on flashy headlines and alarmist language, leaving out inconvenient facts that undermine their sensationalist conclusions.

Let’s start by summarizing the claims made in these articles:

  1. USA Today describes the recent Arctic blast as being caused by a disrupted polar vortex, which it links to melting Arctic ice supposedly induced by human-caused climate change.
  2. AP News echoes similar ideas, suggesting that rapid Arctic warming leads to instability in the jet stream, allowing cold air to “spill southward.”
  3. BBC Future goes further, calling this phenomenon “climate instability,” implying that climate change makes extreme cold more likely by destabilizing established weather patterns.
  4. Fast Company takes the same approach, arguing that “climate change is making the polar vortex worse,” a claim that is not only speculative but also directly contradicted by other climate studies.

A close examination of these claims, of the link between variations in the polar vortex and climate change, reveals glaring problems with the logic and science behind these claims.

The polar vortex is a long-established, well-documented feature of the upper atmosphere—known decades before politicized climate scientists and media mavens began talking about climate change. The polar vortex was first described in 1853, but the term became popular with the media in 2014 after a cold snap in North America. The polar vortex is a large-scale low-pressure system that forms in the stratosphere over the polar regions during the winter. Its strength and position are influenced by a variety of factors, including natural atmospheric variability like the North Atlantic Oscillation (NAO) and the El Niño-Southern Oscillation (ENSO).

Courtesy: National Science Foundation – National Science Foundation: Scientists Verify Predictive Model for Winter Weather, Public Domain.

When the polar vortex weakens, it can allow colder Arctic air to drift into mid-latitude regions, resulting in frigid weather and snowstorms. This weakening isn’t some newly minted phenomenon tied to climate change; it’s part of natural variability. Similar cold outbreaks were documented in the 1970s, long before CO2 levels became a focal point of global policy discussions. In fact, those cold outbreaks then led many climate scientists to start warning of a coming ice age. Obviously, that never happened.

There is, in fact, no consensus within the scientific community about a link between Arctic warming and polar vortex behavior. As Climate at a Glance discusses, empirical data shows no consistent trend in the frequency or intensity of polar vortex disruptions over the past several decades. This contradicts the claim that polar vortex weakening has become more common due to human-induced warming.

If we set aside the speculation for a moment and look at actual data, the picture becomes much clearer:

  1. Arctic Ice Trends: While Arctic ice has experienced periods of decline, recent measurements indicate that the Arctic is not in a “death spiral.” In fact, since 2012, Arctic sea ice extent has been relatively stable during winter months. The claim that melting Arctic ice is destabilizing the polar vortex simply doesn’t hold up to scrutiny when examined against actual sea ice trends, as pointed out at Watts Up With That, which cites government data.
  2. Cold Extremes in Context: Historical weather data reveals that extreme cold events in the United States are neither new nor increasing. Cold outbreaks similar to the current one have been documented regularly over the past two centuries, at least, including the brutally cold winters of the late 19th and mid-20th centuries. Documentary evidence from the 18th and 17th centuries show extreme cold spells were common even then. The recent cold spell is notable, but it is not unprecedented.
  3. Jet Stream Variability: Claims that the jet stream is becoming “wavier” or more unstable due to climate change are also unsupported by solid evidence. A 2021 study in the journal Geophysical Research Letters found no statistically significant increase in jet stream waviness or meandering in recent decades. As Climate at a Glance: The Polar Vortex shows jet stream’s behavior, like the polar vortex itself, is driven and sustained by natural atmospheric patterns.

These media articles also conveniently ignore the inconvenient fact that climate models—touted as the gold standard of climate science—struggle to accurately simulate the behavior of the polar vortex. If the models can’t reliably predict polar vortex behavior in a warming world, how can we credibly link this year’s cold snap to climate change? The reality is that most of these claims are based on post-hoc rationalizations rather than sound science.

Take, for example, the so-called “warm Arctic, cold continents” hypothesis often used to explain these events. This theory posits that warming in the Arctic destabilizes the polar vortex, leading to more cold air spilling southward. However, studies such as those by the American Meteorological Society, titled “Evidence Against a Physical Link Between Arctic Amplification and Mid-Latitude Weather“, have found that the connection between Arctic warming and mid-latitude cold outbreaks is tenuous at best. Simply put, the hypothesis lacks predictive power and is contradicted by many observational studies.

Additionally, another relevant study is the 2019 paper in Nature Climate Change, titled “Projected weakening of the stratospheric polar vortex in response to rising greenhouse gases“ by Amy Butler and Lorenzo Polvani, which shows that while some climate models suggest changes in polar vortex strength under warming conditions, the actual observed link between Arctic warming and mid-latitude weather is inconsistent.

In short, based on existing research and data, there is no clear cause and effect connection indicating climate change is causing a shift in the polar vortex, its frequency, its strength, its regularity, or pattern of impact.

It’s worth noting the sheer irony of claiming that record cold is caused by global warming. Multiple times in recent decades the mainstream media has warned of the “end of snow,” declaring that snow would become a thing of the past due to rising global temperatures. A notable example is a 2000 article in The Independent claiming that “children just aren’t going to know what snow is.” Also, articles published in the New York Times in 2014 and 2024 also warned of the snow’s end due to global warming. Yet here we are in 2025, witnessing some of the coldest and snowiest winters in recent memory, and the narrative has conveniently shifted to now blaming extreme cold and snow on global warming. This blaming of contradictory weather phenomena—no snow/record snow, weakening monsoons/strengthening monsoons, the Atlantic current speeding up/the Atlantic current slowing down, increasing drought/increasing rainfall—should raise red flags about the credibility of these claims.

Conclusion: The media is pushing a narrative at the expense of science

What we’re seeing here isn’t science; it is narrative-building. Recent years’ record cold and snowfall in the United States are not proof of climate change but rather evidence of natural variability at work—variability that has been part of Earth’s climate system for millennia. If anything, the rush to blame every cold snap on “global warming” aka climate change underscores the increasing desperation of a narrative that has lost its grounding in reality and credibility.

It’s time for journalists to stop treating speculation as fact and for readers to demand accountability in climate reporting. Climate change happens, but there is no evidence of a crisis. Also, interpretations of short-term weather events to promote ideas of catastrophic climate change, because they ignore data and long-standing meteorological knowledge, don’t inform but rather mislead, in the process eroding trust in science and journalism while unnecessarily alarming the public.

Anthony Watts

Anthony Watts is a senior fellow for environment and climate at The Heartland Institute. Watts has been in the weather business both in front of, and behind the camera as an on-air television meteorologist since 1978, and currently does daily radio forecasts. He has created weather graphics presentation systems for television, specialized weather instrumentation, as well as co-authored peer-reviewed papers on climate issues. He operates the most viewed website in the world on climate, the award-winning website wattsupwiththat.com.

Originally posted at ClimateREALISM


Discover more from Watts Up With That?

Subscribe to get the latest posts sent to your email.

via Watts Up With That?

https://ift.tt/3ms9iC8

January 26, 2025 at 08:06AM

Durham DCNN 2165 & 2166 – Long term, Incomplete, Inaccurate, Dubious Metrology, Relocated, Falsely Respected, Bogus Conclusions and Unreasonable Assumptions.

54.76803 -1.58610 Met Office CIMO Assessed CLASS 5 Originally Installed 1851 with Several Relocations. Current site from 30/9/1999. Digitally archived inaccurate temperature records from 1880 at various locations.

Durham weather station seems to be “revered” in established meteorological circles and extensive use is made of its data for all manner of quasi-meteorological purposes by political activist groups in which I include elements of the UK Met Office.

As I shall demonstrate in this review, Durham is, in reality, an exceptionally poor site of known “Junk” status that has produced known dubious data records and is known to have had various historic relocations with spliced together datasets and deliberate misrepresentation. Its alleged “long term” data is demonstrably NOT suitable for inclusion in the national historic temperature record – its current inclusion being a poor reflection on the standards of a largely tax payer funded Government agency.

Firstly the current site numbered DCNN 2166 has only been in operation since 30/9/1999. Prior to then was a different site numbered DCNN2165. The relevance of this renumbering is that it indicates a known significant relocation. From the Met Office themselves:

https://artefacts.ceda.ac.uk/badc_datadocs/ukmo-midas/ukmo_guide.html#2.1

“Over time certain instruments, or the whole enclosure, may be relocated some distance away from the original site. Where the distance moved is small, the observations obtained from the new site may have exactly the same climatological characteristics as previously and it makes sense to regard them as coming from the same source or station distinguished by certain identifiers. Where the distance moved is large, or, where the exposure at the new site is sufficiently different that a detectable impact on the measured climatology is judged likely, it is appropriate that observations from the new site are labelled by a different set of identifiers.” (my bold)

The most recent actual relocation distance shown by archived UK Grid Reference indicators (that are only available from very detailed research) was not particularly great, however, climatologically quite different as indicated below with the current screen to the north east of the red kite marker.

The digitalised archive data only indicates the site change in the readings by a melding together of station identifiers in the section below – note the progressive changes from DCNN 2165 to 2166.in column C {n.b. cells widened out for clarity}

Demonstrably the Met Office is aware of this relocation and its implications, however, no indication is given in the representation of the stations’ data to the general public – (and quite possibly other meteorologists and institutions).

There is no indication either from the above site nor the actual “view data” link that shows the most recent major relocation point as the original location. This, in itself, demonstrates the deliberate splicing together of at least two known distinctly different data sets as demonstrated at Stornoway and Southampton amongst many others. This is both a scientifically unacceptable practise and blatant misrepresentation.

The headline image of the current site shows a site subject to many external and unnatural affects being on a lawn in front of the large observatory building to the north together with its gravelled road access and bordered by large hedging and trees to east and west sides. This would normally be referred to as a “sun trap” (almost a walled garden) and clearly not representative of the wider environment. The Met Office acknowledges the site’s shortcomings by its Class 5 rating with known exceptionally high levels of representative inaccuracy.

The close up image of the site demonstrates the problems – if this were a private/amateur weather station, the Met office would dismiss its readings out of hand as being far too poorly sited for inclusion in their data files and not meeting their alleged “high standards”. Why they feel such poor sites of their own are in some way superior is proof of double standards operating.

What is even further damning evidence of the inappropriate nature of this 1999 onwards site is revealed from recent Google Earth Pro historic images. Firstly the site is subject to deep shading similar to the similarly revered but inadequate site at Oxford.

The image below from 30/5/2020 shows the screen moving into shade whilst the neighbouring homes activity indicate this is not a particularly late in the day image.

However, the changing nature of the whole area around the Observatory, is most graphically demonstrated by the 1945 black and white image – this was once a rural site but obviously no longer. N.B. there is no weather station at the marked location. Durham, although a small city has hugely increased in population, urban area and transport infrastructure even since 1945 and much more so than when this station was originally installed.

Archive records somewhat imprecisely indicate yet more previous locations for the temperature readings with suggestions that in earlier days these were taken from the observatory building’s roof which was by no means an uncommon practise in earlier days. This point is even acknowledged by the Met office themselves.

“It is unavoidable that some sites do not meet all these requirements, particularly where a station set up for one purpose gradually takes on a different role, for example an airport site originally established for aviation observing may become a key synoptic or climate station while suffering the effects of urbanisation. A few sites are in city centres and may be unsuitably located close to large obstacles or even on the roof of a building.” {my bold}

Almost absurdly, “peer reviewed” literature actually claims Durham is a good long term site on the grounds that “The Durham University Observatory record is of interest because of its length and the lack of change in its vicinity since it began in 1841.” Seemingly those reviewing “peers” were totally unaware of the relocations and alterations to the nature of the site.

All of the above only adds to almost unbelievable archived admissions such as :

The thermometers were of questionable calibration for a period of over Eleven Years but were still accepted and now are included in all the historic data. This is from an organisation that risibly claims accuracy to the one hundred thousandth of a degree celsius such as at Cavendish despite trained observers pointing out such faux accuracy really only indicates the “stupidity of the observer“. The records show multiple instances of missing, corrupted and inaccurate data not for the occasional day or two but for extended periods of months and, as above, even many years.

The ways in which such poor data is openly used is shown in this recent article authored by a notable meterologist.

https://www.inverse.com/science/too-hot-to-sleep

Here the author has direct comparisons made of data from somewhere (unspecified but of known climatological difference) around the Durham Observatory dating between 1911 and 1920 with 20th century readings from the current site only installed in 1999 and subject to significant Urban Heat Island warming. This following statement clearly fails to meet any form of scientific integrity. Initially regarding Oxford thence Durham

“Between 1911 and 1920, the warmest night of the year averaged 16.6 degrees Celsius at Oxford. The average over the last ten years was 18.8 degrees Celsius, a rise of more than 2°C.” Furthermore the author goes on to claim regarding the Oxford site (and by association Durham) ” the urban heat island effect is probably only about 0.2°C since record-keeping began.”….and then…..”The warmest night of the year in Durham has risen from an average of 14.6°C a century ago to 16.9°C in the most recent ten-year period, a 2°C rise – very similar to Oxford.”

No mention whatsoever is made of Durham’s known relocations, known thermometer calibration issues, known misrepresentation of the wider area by poor siting of up to 5°C, and an estimate given of UHI that flies in the face of all known and observable fact. For example, I live near Canterbury, a city of comparable size and style to Durham. I recently left the city centre with my car sensor showing 6°C, by the time I reached the outskirts after one mile, the temperature had dropped to 2°C at which it stayed for the next 5 miles to home. Such city to rural differentials are the norm not the exception in mine, and others I know, real world experience. Surely it is not credible to assume that only one tenth of the noted “average warmest night” increment at Durham is down to UHI with the remaining 1.8°C given as “evidence” of “Climate Change” when all the above noted and detrimental to accuracy effects are completely ignored.

The remarkable lack of association of Durham’s readings to the wider area has even been taken to quite bizarre lengths by a pseudo scientific organisation established not for the benefit of climate science research but rather to “assist in climate litigation”. World Weather Attribution primarily based at Imperial College, London concluded literally only days after the UK 2022 very short term hot weather event that:

“At three individual stations the 1-day maximum temperatures are as rare as 1 in 500 years in St James Park in London, about 1 in 1000 years in Durham and only expected on average once in 1500 years in today’s climate in Cranwell, Lincolnshire. “

That people claiming high levels of qualifications and appeal to authority in the “climate science” arena can make such preposterous claims from the limited period and highly inaccurate data from any of those sites frankly beggars belief. That our mainstream politicians make crucially important decisions based on such fantasy claims is exceptionally damaging to the UK economy and our lifestyles.

In conclusion Durham is not the valuable, high quality reliable site that many of the meteorology and “climate Science” fraternity would have us believe. It is, in reality, currently a junk status site of extremely dubious history as I feel I have proven above.

via Tallbloke’s Talkshop

https://ift.tt/j421tA0

January 26, 2025 at 07:22AM

“not supported by the scientific consensus”

Grok says :

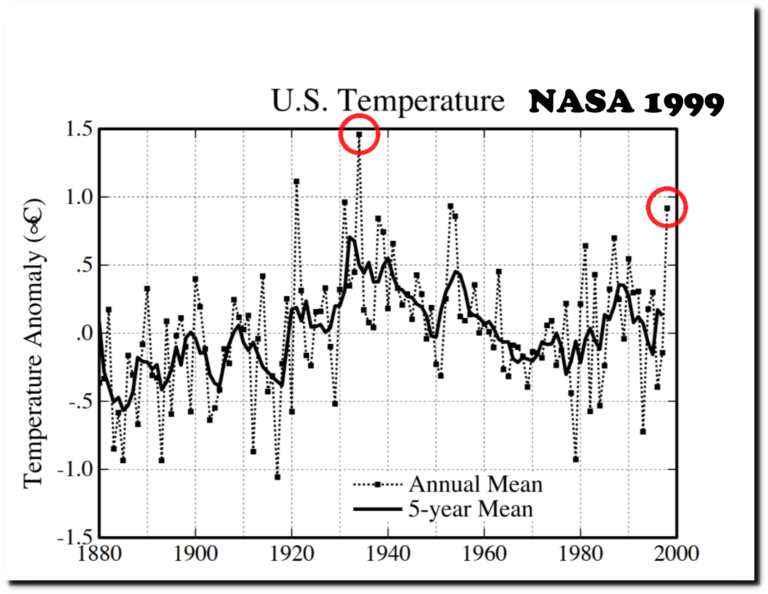
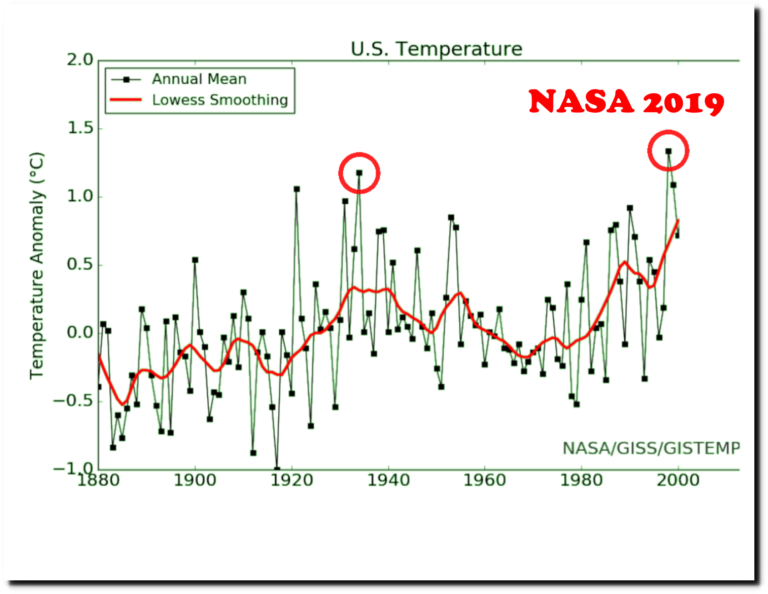
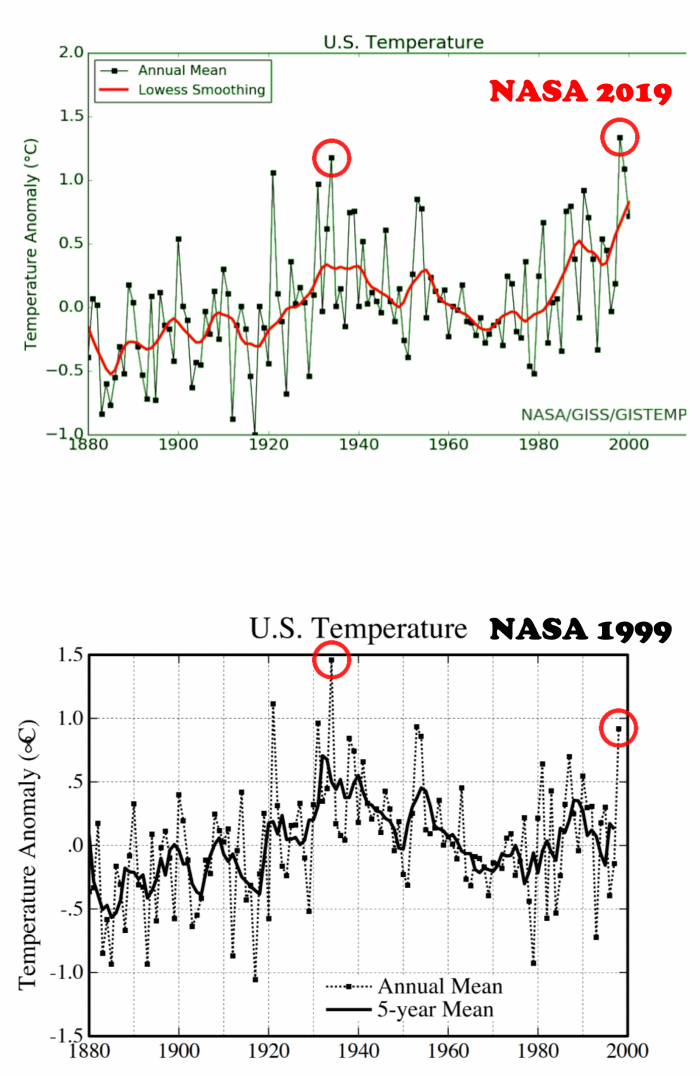
“there are claims on social media platforms like X, where some users argue that 1934 was the hottest year before alleged data tampering by NOAA and NASA, though these assertions are not supported by the scientific consensus or official government data. The summer of 2021 also tied with the Dust Bowl summer of 1936 for the warmest on record in the U.S., highlighting the variability and the impact of climate change on record temperatures”

Here is the official government data :

NASA 1999


NASA 2019

The average daily maximum temperature in the US during summer 2021 was 37th highest and 3F cooler than 1936. The percent of days above 90F during summer 1921 was 50th highest since 1895.

So far this month the percent of days in the US above freezing has been eighth lowest on record, and lowest since 1979

About Tony Heller

Just having fun

This entry was posted in Uncategorized. Bookmark the permalink.

via Real Climate Science

https://ift.tt/5Td42Xr

January 26, 2025 at 06:33AM

Increased wildfire activity may be a feature of past periods of abrupt climate change, study suggests


Temperature spikes are in the news these days. The lead author of the study said: “It probably went something like: Ocean currents slowed down or sped up rapidly, the northern hemisphere cooled or warmed rapidly, and then this caused abrupt shifts in tropical rainfall that led to increased drought and fire.” The SIS website says: ‘The problem confronting scientists is what triggered these episodes of abrupt climate change. The consensus opinion is that it is all down to ocean currents going into a switch mode. That may well be part of the answer – but what triggered the ocean currents to shift?’ The Talkshop suggests the planetary origin of the Dansgaard-Oeschger cycle – a triple conjunction of Jupiter, Saturn and Neptune every 1470 years – is involved.
– – –
A new study investigating ancient methane trapped in Antarctic ice suggests that global increases in wildfire activity likely occurred during periods of abrupt climate change throughout the last Ice Age, says ScienceDaily.

The study, just published in the journal Nature, reveals increased wildfire activity as a potential feature of these periods of abrupt climate change, which also saw significant shifts in tropical rainfall patterns and temperature fluctuations around the world.

“This study showed that the planet experienced these short, sudden episodes of burning, and they happened at the same time as these other big climate shifts,” said Edward Brook, a paleoclimatologist at Oregon State University and a co-author of the study. “This is something new in our data on past climate.”

The findings have implications for understanding modern abrupt climate change, said the study’s lead author, Ben Riddell-Young, who conducted the research as part of his doctoral studies in OSU’s College of Earth, Ocean, and Atmospheric Sciences.

“This research shows that we may not be properly considering how wildfire activity might change as the climate warms and rainfall patterns shift,” said Riddell-Young, who is now a postdoctoral scholar at the Cooperative Institute for Research in Environmental Sciences at the University of Colorado, Boulder.

Ice that built up in Antarctica over tens to hundreds of thousands of years contains ancient air bubbles. Scientists use samples of that ice, collected by drilling cores, to analyze the gasses preserved in these bubbles and build records of the Earth’s past climate.

Previous research has shown that levels of atmospheric methane, a greenhouse gas, spiked during abrupt climate change periods during the last Ice Age, which ended about 11,000 years ago.

These abrupt climate change events, known as Dansgaard-Oeschger and Heinrich events, were associated with rapid regional temperature changes and shifting rainfall patterns, as well as spikes in atmospheric methane. The goal of the study was to try to determine what caused those spikes.

“These spikes were notable because of how quickly the methane levels changed during these periods,” Riddell-Young said.
. . .
Riddell-Young used a system he designed to extract the air from ice samples and then used a mass spectrometer to measure the isotopic composition of the methane, which can indicate the sources of atmospheric methane.

The measured isotopic changes suggest that the spikes in methane were caused by methane emissions from an increase in wildfires globally, Riddell-Young said.

“These fire events were likely one of the cascading impacts resulting from what triggered the abrupt climate change event,” he said. “It probably went something like: Ocean currents slowed down or sped up rapidly, the northern hemisphere cooled or warmed rapidly, and then this caused abrupt shifts in tropical rainfall that lead to increased drought and fire.”

Past research has suggested that shifts in temperature and tropical rainfall were associated with these abrupt climate change periods, but the new study provides the first good evidence that fire was also a feature of these periods, Brook said.

Full article here.
– – –
Image: Antarctic ice core [credit: Discovering Antarctica]

via Tallbloke’s Talkshop

https://ift.tt/cVDqbyY

January 26, 2025 at 06:09AM