Month: June 2018

Insanity: global warming will cause all the trees in Europe to disappear

From the NORWEGIAN UNIVERSITY OF SCIENCE AND TECHNOLOGY and the “playing with climate models for doom outcomes is too stupid to be science” department.

The WUWT “artistic model” for this paper.

Envisioning a future where all the trees in Europe disappear

Using climate models to take a deeper look at the regional effects of global warming

Vegetation plays an important role in shaping local climate: just think of the cool shade provided by a forest or the grinding heat of the open desert.

But what happens when widespread changes, caused by or in response to global warming, take place across larger areas? Global climate models allow researchers to play out these kinds of thought experiments. The answers that result can serve as a warning or a guide to help policymakers make future land use decisions.

With this as a backdrop, a team of researchers from the Norwegian University of Science and Technology and Justus-Liebig University Giessen in Germany decided to use a regional climate model to see what would happen if land use in Europe changed radically. They looked what would happen with air temperature, precipitation, and temperature extremes if Europe were completely deforested to either bare land or just ground vegetation. They also considered what might happen if Europe’s cropland were converted to either evergreen or deciduous forests.

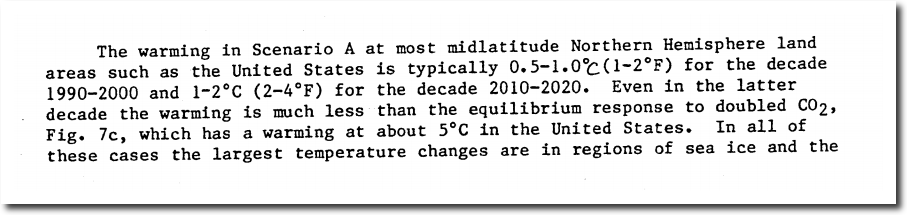
The researchers knew that climate change impacts tend to be underestimated at a regional level, “because the projected global mean temperature changes are dampened by averaging over the oceans, and are much smaller than the expected regional effects over most land areas,” the team wrote in their paper, recently published in Environmental Research Letters. “This applies to both mean and extreme effects, as changes in regional extremes can be greater than those in global mean temperature up to a factor of three.”

“We wanted to perform a quantitative analysis of how much land cover changes can affect local climate. Important transitions in the land use management sector are envisioned in near future, and we felt important to benchmark the temperature response to extreme land cover changes”said Francesco Cherubini, a professor in NTNU’s Industrial Ecology Programme, and first author of the study. “Decisions regarding land uses are frequently taken at a subnational level by regional authorities, and regional projections of temperature and precipitation effects of land cover changes can help to maximize possible synergies of climate mitigation and adaptation policies, from the local to the global scale.”

Future extreme land use changes are not as improbable as you might think. As the global population continues to grow, more land will come under pressure to produce food.

Alternatively, demand for crops for biofuels could also drive what kind of vegetation is cultivated and where.

One future vision of what the world might look like, called Shared Socio-economic Pathways, estimates that global forest areas could change from about – 500 million hectares up to + 1000 million hectares in 2100, with between 200 and 1500 million hectares of land needed to grow bioenergy crops. In fact, the higher end of this range could be realized under the most ambitious climate change mitigation targets.

Changes in land use can have a complicated effect on local and regional temperatures.

When the ground cover is altered, it changes how much water is retained by the soil or lost to evaporation. It can also affect how much sunlight the ground reflects, which scientists call albedo.

The researchers knew that other studies had shown contradictory effects, particularly from deforestation. Some showed that deforestation reduced air temperatures near the ground surface, and increased daily temperature extremes and number of hot days in the summer. Other studies found increases in the occurrence of hot dry summers.

But when the researchers ran their model to see what would happen if land was deforested, they found a slight annual cooling over the region overall, but big differences locally.

Their model showed that when forests were replaced by bare land, the temperatures cooled by just -0.06 ? regionally. The cooling was slightly greater (-0.13? regionally) if the researchers assumed that forests were replaced by herbaceous vegetation. In some locations, cooling can exceed average values of -1 C.

On their own, these regional changes may not seem like much. But when the researchers looked more closely at how these changes were distributed across the region, they found that there was a cooling in the northern and eastern part of the region, and a warming effect in western and central Europe. They also found that deforestation led to increased summer temperature extremes.

“Regional cooling from deforestation might look counter-intuitive, but it is the outcome of the interplay among many different physical processes. For example, trees tend to mask land surface and increase the amount of solar energy that is not reflected back to the space but it is kept in the biosphere to warm the climate,” said Bo Huang, a postdoc in the Industrial Ecology Programme who was one of the paper’s co-authors. “This particularly applies to areas affected by seasonal snow cover, because open land areas covered by snow are much more reflective than snow-covered forested land.”

The researchers found an annual average cooling across the whole of Europe, but with a clear latitudinal trend and seasonal variability. Despite the average cooling effects, they found that deforestation tends to increase local temperatures in summer, and increase the frequency of extreme hot events.

When the researchers ran their model to see what would happen if cropland was replaced by either evergreen or deciduous forests, they found a general warming in large areas of Europe, with a mean regional warming of 0.15 ? when the transition was to evergreen forests and 0.13 ? if the transition was to deciduous forests.

Much as in the deforestation thought experiment, the researchers found that the changes were stronger at a local scale, as much as 0.9 °C in some places. And the magnitude and significance of the warming gradually increased at high latitudes and in the eastern part of the region. Areas in western Europe actually showed a slight cooling.

Cherubini says that understanding how regional vegetation changes play out at more local levels is important as decision makers consider land management policies to mitigate or adapt to climate change.

“It is important to increase our knowledge of land-climate interactions, because many of our chances to achieve low-temperature stabilization targets are heavily dependent on how we manage our land resources,” Cherubini said. “We need more research to further validate and improve the resolution of regional climate change projections, since they are instrumental to the design and implement the best land management strategies in light of climate change mitigation or adaptation.”

###

Here’s the paper: http://iopscience.iop.org/article/10.1088/1748-9326/aac794/meta

via Watts Up With That?

https://ift.tt/2tsejCf

June 21, 2018 at 10:21AM

New Study: Sea Level Was 11-12.5 Meters Higher Than Now During The Mid-Holocene

In a new paper, data from 57 sites along 17 km of coastal Denmark reveal that sea levels were 11 to 12.5 meters higher than they are today between 7,600 and 4,600 years ago.

Image Source: Clemmensen et al., 2018

Most Holocene reconstructions do not indicate that sea levels were more than about 5 meters above present between about 9,000 to 4,000 years ago.

But a new study utilizing well-preserved beach facies along the coasts of northern Denmark indicates that sea levels were as much as 12.5 meters higher than they are today during the Mid-Holocene.

These extremely high sea level elevation values may be less common, but other research has revealed that sea levels were as much as 8 meters higher than today near East Antarctica (Hodgson et al., 2016)  during the Early Holocene.  Just 2,000 years ago, sea levels were still 12 meters higher than today along the coasts of King George Island (Antarctica) (Chu et al., 2017).  And research published in 2011 suggested sea levels near the Antarctic Peninsula were as much as 15.5 meters higher than today between 8,000 and 7,000 years ago (Watcham et al., 2011).

This new research using high-resolution sea level proxy evidence can be added to the list of 75 other recently published sea level papers indicating that global sea levels were on average about 1 to 5 meters higher than they are now (depending on location) just a few thousand years ago.


Clemmensen et al., 2018

A high-resolution sea-level proxy dated using quartz OSL

from the Holocene Skagen Odde spit system, Denmark

Conclusion:

“The raised spit deposits at Skagen Odde, northern Denmark, offer a unique possibility to study spit evolution over the past 7600 years. The deposits contain well-preserved beach facies including the transition from wave-formed foreshore to aeolian-influenced backshore sediments. After correction foroffset and isostatic spatial gradient, we have been able to use this boundary as a proxy for palaeo-sea level.”
“Measurements at 57 sample sites covering ~17 km along the northwestern coast of the spit indicate that this boundary first rises towards the northeast, then reaches a maximum relative sea level at about 12.5 m above present mean sea level [apmsl] before gradually decreasing toward the most recent part of the spit.”
“By pairing all boundary elevation measurements with an OSL age, the variation in elevation with age has been determined directly. The resulting curve reflects variation in relative sea level with time; we conclude that relative sea level initially rose between c. 7600 and c. 6250 years ago, reached a first peak value around 12.5 m apmsl [above present mean sea level] and a second peak value around 11 m apmsl c. 4600 years ago before it dropped to reach 2 m apmsl c. 2000 years ago.”

via NoTricksZone

https://ift.tt/2thqItn

June 21, 2018 at 10:17AM

“Hansen got it right”

The consensus of climate experts tell us NASA’s James Hansen was correct in 1988.

Climate scientists’ consensus: James Hansen ‘got it right’ in congressional global warming and human causation testimony 30 years ago this week.

Judgment on Hansen’s ’88 climate testimony: ‘He was right’ » Yale Climate Connections

In 1988, Hansen predicted Lower Manhattan would be underwater by 2018.

“The West Side Highway [which runs along the Hudson River] will be under water.”

Stormy weather – Global warming – Salon.com

The West Side Highway does not appear to be underwater this morning.

511NY | New York Traffic | Commuter Information | Road Conditions

Lower Manhattan sea level is slightly lower now than it was 20 years ago.

Sea Level Trends – NOAA Tides & Currents

Hansen predicted heat and drought for the Midwest.

24 Jun 1988, 1 – The Miami News at Newspapers.com

Since Hansen’s forecast for Midwest drought, the Midwest has had above normal precipitation almost every year.

Climate at a Glance | National Centers for Environmental Information (NCEI)

Maximum temperatures and the occurrence of heatwaves in the Midwest have plummeted to record lows.

Hansen predicted global warming would lower the water level in the Great Lakes.

24 Jun 1988, 4 – The Miami News at Newspapers.com

Great Lakes water levels have increased and are near record highs.

Great Lakes Dashboard – HTML5

Hansen predicted four degrees warming for the US by 2020.

86602726a_1.pdf

Before data tampering, the US has cooled over the last 90 years.

Hansen predicted the Arctic would be ice-free by 2018.

The Argus-Press – Google News Archive Search

Arctic sea ice volume is the highest in thirteen years.

Spreadsheet    Data

Hansen got every single one of his predictions exactly backwards, which is why Democrats and the left hail him as being a prophet.

via The Deplorable Climate Science Blog

https://ift.tt/2K6xo49

June 21, 2018 at 08:39AM

Unbelievable Climate Models

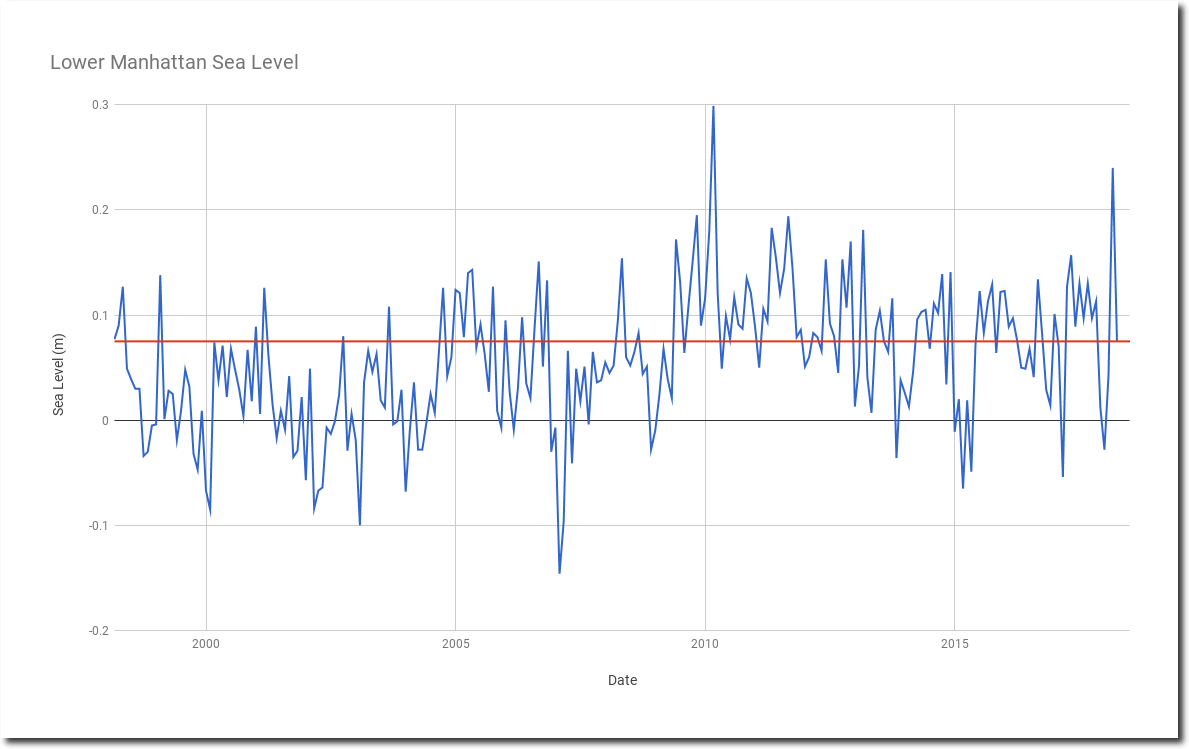
It is not just you thinking the world is not warming the way climate models predicted. The models are flawed, and their estimates of the climate’s future response to rising CO2 are way too hot. Yet these overcooked forecasts are the basis for policy makers to consider all kinds of climate impacts, from sea level rise to food production and outbreaks of Acne.

The models’ outputs are contradicted by the instrumental temperature records. So a choice must be made: Shall we rely on measurements of our past climate experience, or embrace the much warmer future envisioned by these models?

Ross McKitrick takes us through this fundamental issue in his Financial Post article All those warming-climate predictions suddenly have a big, new problem Excerpts below with my bolds, headers and images

Why ECS is Important

One of the most important numbers in the world goes by the catchy title of Equilibrium Climate Sensitivity, or ECS. It is a measure of how much the climate responds to greenhouse gases. More formally, it is defined as the increase, in degrees Celsius, of average temperatures around the world, after doubling the amount of carbon dioxide in the atmosphere and allowing the atmosphere and the oceans to adjust fully to the change. The reason it’s important is that it is the ultimate justification for governmental policies to fight climate change.

The United Nations Intergovernmental Panel on Climate Change (IPCC) says ECS is likely between 1.5 and 4.5 degrees Celsius, but it can’t be more precise than that. Which is too bad, because an enormous amount of public policy depends on its value. People who study the impacts of global warming have found that if ECS is low — say, less than two — then the impacts of global warming on the economy will be mostly small and, in many places, mildly beneficial. If it is very low, for instance around one, it means greenhouse gas emissions are simply not worth doing anything about. But if ECS is high — say, around four degrees or more — then climate change is probably a big problem. We may not be able to stop it, but we’d better get ready to adapt to it.

So, somebody, somewhere, ought to measure ECS. As it turns out, a lot of people have been trying, and what they have found has enormous policy implications.

The violins span 5–95% ranges; their widths indicate how PDF values vary with ECS. Black lines show medians, red lines span 17–83% ‘likely’ ranges. Published estimates based directly on observed warming are shown in blue. Unpublished estimates of mine based on warming attributable to greenhouse gases inferred by two recent detection and attribution studies are shown in green. CMIP5 models are shown in salmon. The observational ECS estimates have broadly similar medians and ‘likely’ ranges, all of which are far below the corresponding values for the CMIP5 models. Source: Nic Lewis at Climate Audit https://climateaudit.org/2015/04/13/pitfalls-in-climate-sensitivity-estimation-part-2/

Methods Matter

To understand why, we first need to delve into the methodology a bit. There are two ways scientists try to estimate ECS. The first is to use a climate model, double the modeled CO2 concentration from the pre-industrial level, and let it run until temperatures stabilize a few hundred years into the future. This approach, called the model-based method, depends for its accuracy on the validity of the climate model, and since models differ quite a bit from one another, it yields a wide range of possible answers. A well-known statistical distribution derived from modeling studies summarizes the uncertainties in this method. It shows that ECS is probably between two and 4.5 degrees, possibly as low as 1.5 but not lower, and possibly as high as nine degrees. This range of potential warming is very influential on economic analyses of the costs of climate change.***

The second method is to use long-term historical data on temperatures, solar activity, carbon-dioxide emissions and atmospheric chemistry to estimate ECS using a simple statistical model derived by applying the law of conservation of energy to the planetary atmosphere. This is called the Energy Balance method. It relies on some extrapolation to satisfy the definition of ECS but has the advantage of taking account of the available data showing how the actual atmosphere has behaved over the past 150 years.

The surprising thing is that the Energy Balance estimates are very low compared to model-based estimates. The accompanying chart compares the model-based range to ECS estimates from a dozen Energy Balance studies over the past decade. Clearly these two methods give differing answers, and the question of which one is more accurate is important.

Weak Defenses for Models Discrepancies

Climate modelers have put forward two explanations for the discrepancy. One is called the “emergent constraint” approach. The idea is that models yield a range of ECS values, and while we can’t measure ECS directly, the models also yield estimates of a lot of other things that we can measure (such as the reflectivity of cloud tops), so we could compare those other measures to the data, and when we do, sometimes the models with high ECS values also yield measures of secondary things that fit the data better than models with low ECS values.

This argument has been a bit of a tough sell, since the correlations involved are often weak, and it doesn’t explain why the Energy Balance results are so low.

The second approach is based on so-called “forcing efficacies,” which is the concept that climate forcings, such as greenhouse gases and aerosol pollutants, differ in their effectiveness over time and space, and if these variations are taken into account the Energy Balance sensitivity estimates may come out higher. This, too, has been a controversial suggestion.

Challenges to Oversensitive Models

A recent Energy Balance ECS estimate was just published in the Journal of Climate by Nicholas Lewis and Judith Curry. There are several features that make their study especially valuable. First, they rely on IPCC estimates of greenhouse gases, solar changes and other climate forcings, so they can’t be accused of putting a finger on the scale by their choice of data. Second, they take into account the efficacy issue and discuss it at length. They also take into account recent debates about how surface temperatures should or shouldn’t be measured, and how to deal with areas like the Arctic where data are sparse. Third, they compute their estimates over a variety of start and end dates to check that their ECS estimate is not dependent on the relative warming hiatus of the past two decades.

Their ECS estimate is 1.5 degrees, with a probability range between 1.05 and 2.45 degrees. If the study was a one-time outlier we might be able to ignore it. But it is part of a long list of studies from independent teams (as this interactive graphic shows), using a variety of methods that take account of critical challenges, all of which conclude that climate models exhibit too much sensitivity to greenhouse gases.

Change the Sensitivity, Change the Future

Policy-makers need to pay attention, because this debate directly impacts the carbon-tax discussion.

The Environmental Protection Agency uses social cost of carbon models that rely on the model-based ECS estimates. Last year, two colleagues and I published a study in which we took an earlier Lewis and Curry ECS estimate and plugged it into two of those models. The result was that the estimated economic damages of greenhouse gas emissions fell by between 40 and 80 per cent, and in the case of one model the damages had a 40 per cent probability of being negative for the next few decades — that is, they would be beneficial changes. The new Lewis and Curry ECS estimate is even lower than their old one, so if we re-did the same study we would find even lower social costs of carbon.

Conclusion

If ECS is as low as the Energy Balance literature suggests, it means that the climate models we have been using for decades run too hot and need to be revised. It also means that greenhouse gas emissions do not have as big an impact on the climate as has been claimed, and the case for costly policy measures to reduce carbon-dioxide emissions is much weaker than governments have told us. For a science that was supposedly “settled” back in the early 1990s, we sure have a lot left to learn.

Ross McKitrick is professor of economics at the University of Guelph and senior fellow at the Fraser Institute.

via Science Matters

https://ift.tt/2IbERNp

June 21, 2018 at 08:08AM