
Despite pronouncements from one polar bear specialist that “ice in Hudson Bay is in rapid retreat” a look back in time shows that there is more thick first year ice over the Bay this year for the week of the summer solstice than there was in 2004 – and much less open water than 1998.

Below, 2018, June 18 (the week of the summer solstice):
Compare the above to the same week coverage chart for 2004, below:
Ice coverage for some other recent years are shown below compared to 1998, the year the ice breakup pattern on Hudson Bay changed. Speed and melt sequences vary according to the amount of thick first year ice present, discussed previously here.
PS. If you’re wearing white today, flaunt it! Tell your friends and colleagues that you’re celebrating the success of polar bears despite such low summer sea ice since 2007 that 2/3 of them were predicted to disappear.
2005, June 20:
2006, June 19:
2010, June 21:
2011, June 20:
2015, June 15 (the year that Southern Hudson Bay polar bears suffered higher-than-usual loss of cubs but it wasn’t because of early breakup or late freeze-up):

2016, June 20:
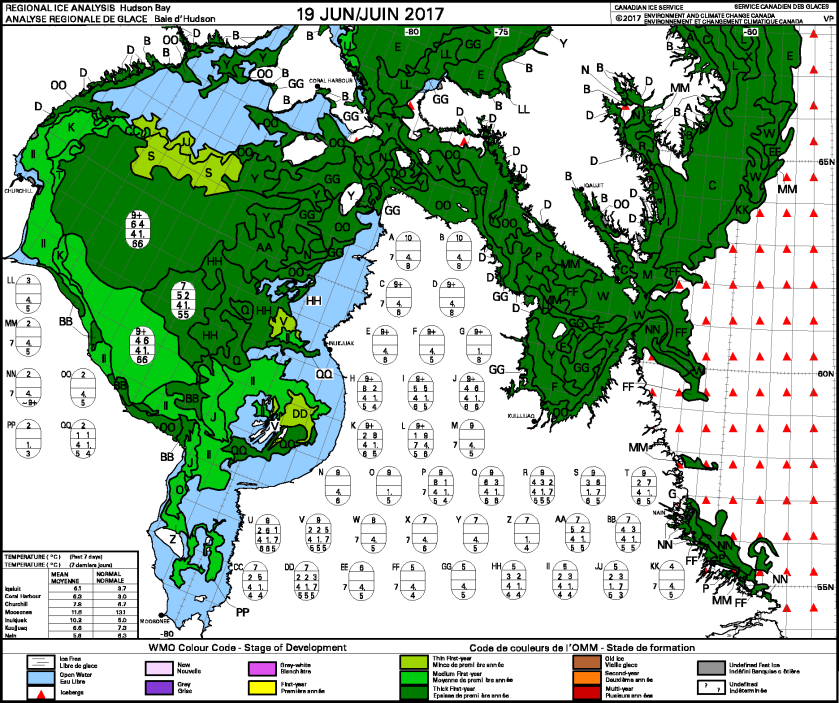
2017, June 19:
2018 again, including concentration:
2018, June 18 concentration:

2004, 21 June concentration, showing the thick first year ice was more concentrated around the edges in 2004 than it is this year but the amount of clear open water was marginally greater:
Compare to 1998, June 22
This was the year the ice-free season in Western Hudson Bay was extended by about 3 weeks (Castro de la Guardia et al. 2017): the black and white chart is a bit harder to read but the presence of open water in the NW sector and along the east coast around the summer solstice is clearly evident, showing the pattern of sea ice breakup we’ve seen since then. Before this time, breakup usually came about 2 weeks earlier (and freeze-up one week later), with some wide variations year to year.
Bottom line: Sea ice coverage during breakup on Hudson Bay is not getting progressively worse each year. In fact, the last year with a much earlier than usual breakup date was 2010 (2011 was relatively early as well but there hasn’t been another one since).
References
Castro de la Guardia, L., Myers, P.G., Derocher, A.E., Lunn, N.J., Terwisscha van Scheltinga, A.D. 2017. Sea ice cycle in western Hudson Bay, Canada, from a polar bear perspective. Marine Ecology Progress Series 564: 225–233. http://www.int-res.com/abstracts/meps/v564/p225-233/
via polarbearscience
June 21, 2018 at 03:55AM

