On June 13 Chris Mooney of the Washington Post wrote that Antarctica’s ice sheet was “melting at a rapidly increasing rate” and “pouring more than 200 billion tons of ice into the ocean annually” — all this according to “a team of 80 scientists”. The doomsday media response was immediate.
Mooney of course blamed CO2 for the speculated ice melt change, and renewed the calls for a cut in greenhouse gas emissions in order to save ourselves.
Adventurous conclusion
But the CO2 chain of logic here is extremely flimsy and even preposterous: An already hugely uncertain 200 billion tonne figure gets adventurously blamed on Co2 through a long, uncertain and highly complex chain of Physical processes.
“Rate increase” meaningless
Secondly, Mooney’s language sounds dramatic, but the reality isn’t at all. A worker with an annual salary of $100,000 who gets a raise of $100 this year compared to only $50 the year earlier saw “a rapidly increasing” pay raise. In reality his raise was meaningless.
Mooney and the media here are using trick language to purvey fake images.
Only 0.001% of the total mass
Though the (hugely uncertain) 200 billion tone ice melt figure may sound impressive, it would in fact be very tiny compared to the entire Antarctic total ice volume, which according to Dr. Don Easterbrook’s book “Evidence-Based Climate Science: Data Opposing CO2 Emissions as the Primary Source of Global Warming Evidence-Based Climate Science” is estimated at 26.5 million cubic kilometers.
Artefact of statistical torture
200 cubic kilometers of 26.5 million cubic kilometers is in reality only about an estimated paltry 0.001% of the total Antarctic ice mass. And (if it were true) would have only a minor effect on overall sea level rise.
The scientists themselves admit there’s much uncertainty involved and that the calculated 200 billion ton ice loss and that it depends in part on model assumptions. Read more here.
The 200 billion ton figure is indeed more an artefact of statistical torture and modelling. When it comes to complex Antarctic ice mass, you can make the paltry data that’s available say whatever you want.
One decade is not climate, but rather weather variability
What is more, the authors compared the last decade to the one before. Well, the changes seen in one decade compared to the one earlier is what we call weather changes, not climate change. Just because one decade is wetter than the other, its doesn’t mean the next will be wetter as well. Junk science.
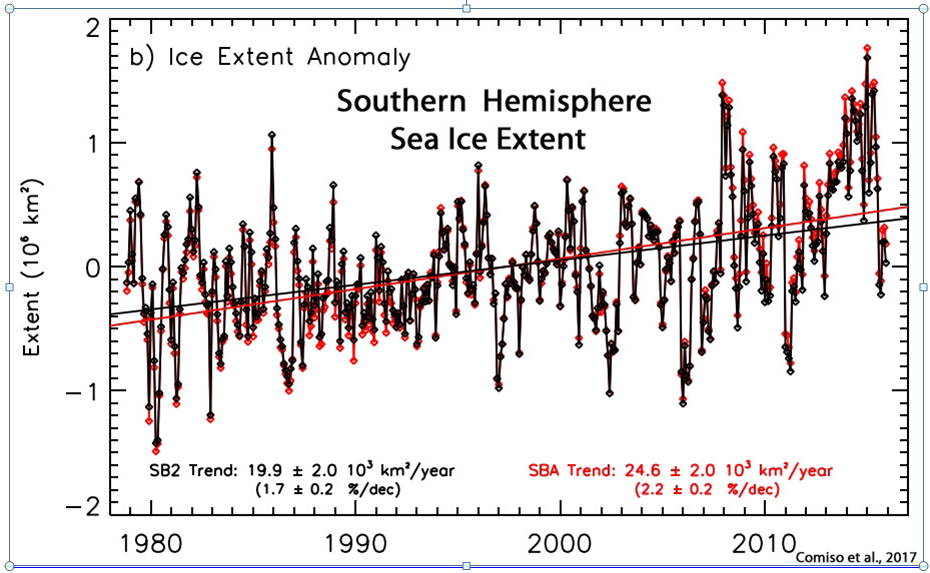
Reality: Antarctic ice area growing rapidly
The satellite imagery and data concerning Antarctic ice area, which go back almost 40 years, in fact show an increasing long-term trend, according to one recently published peer-reviewed study.

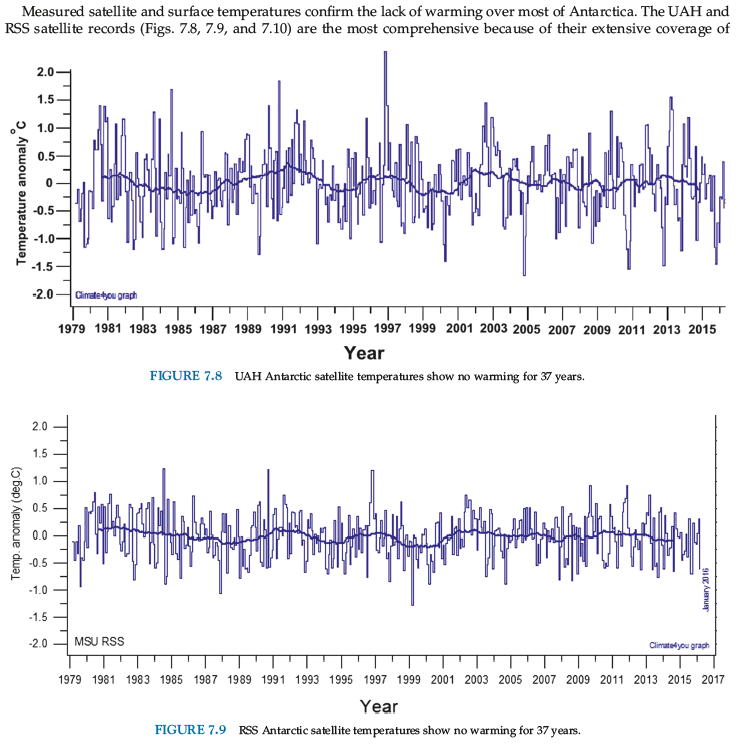
Antarctic cooling
And in order for Antarctica to lose ice through melting, the temperature there would necessarily need to rise. Yet the best satellite data we have on this show this is not the case at all.

Satellite data spanning four decades show no temperature increase. The RSS data in fact indicate modest cooling over the past decade where accelerated melting is being claimed. How can cooling cause more melting? Source: here.
Antarctic coastal surface stations show no warming
At Twitter, Japanese skeptic Kirye has been looking at NASA surface stations scattered over Antarctica, most of them near the coast, and found that many do not show any warming, e.g. Casey, Davis, Mawson, Syowa…
Other studies show ice growth!
Moreover NASA glaciologist Jay Zwally published a paper in 2015 showing ice sheet growth in eastern Antarctica had outweighed the losses in the western ice sheet, and so ice mass was growing and not shrinking.
And today Zwally is set to release a new study that will show that eastern Antarctic ice sheet continues to gain enough ice to offset the losses in the west. “Basically, we agree about West Antarctica,” Zwally told The Daily Caller. “East Antarctica is still gaining mass. That’s where we disagree.”
Zwally believes ice sheet growth is anywhere from 50 gigatons to 200 gigatons a year, the Daily Caller reports here.
Ocean cycles responsible for west Antarctic ice melt
Ice loss in the western Antarctic ice sheet is suspected of being driven by “warm ocean water”, i.e. natural oceanic cycles, and not warming that still has yet to occur over the Antarctic.
Prof. Don Easterbrook concluded in 2016 concerning the West Antarctic Ice Sheet, which everyone loves to worry about:
The West Antarctic Ice Sheet is NOT collapsing, the retreat of these small glaciers is NOT caused by global warming, and sea level is NOT going to rise 10 ft.”
via NoTricksZone
https://ift.tt/2K0EFWm
June 17, 2018 at 07:01AM