
The evidence that “global” warming has not been global in scale continues to accumulate. Two more new reconstructions from the Western Pacific (He et al., 2018) and subpolar North Atlantic (Orme et al., 2018) indicate that modern temperatures have continued to decline since the onset of the Little Ice Age.
These add to the nearly 300 graphs published in the scientific literature since 2017 showing that there is nothing unusual, unprecedented, or remarkable about the temperatures changes in the last 150 years.
“Together with the weakening upwelling condition observed from the same core, we believe that the temperature decreasing trend in the studied region since the end of the LIA [(the recent ~100 years)] is probably caused by changes in current strength instead of coastal upwelling. Less warm water from the south area was transported to the region, probably because of the changes in the weakening KC overturning the increasing global temperature signal in the YS and ECS regions since the end of the LIA (He et al., 2014). In fact, this decreasing SST trend was also observed in many UK’37-SST records among sites located in the mid-latitude western Pacific region since the end of the LIA (Figure 3, Kim et al., 2004; Li et al., 2009; Nakanishi et al., 2012b; Ruan et al., 2017; Wang et al., 2011). In addition, three ~400-year UK’37-SST records from sediment cores collected in the Mirs Bay, northeastern Hong Kong also show cooling trends in this period (Kong et al., 2015).” (He et al., 2018)

“The diatom-based reconstruction shows warmer reconstructed temperatures than the dinocyst-based reconstruction and the modern measured summer SST (June-August) of 10.9°C. … The overall long-term cooling trend in the diatom-based SST reconstruction for the last 6.1 ka fits with the widely established cooling in the subpolar North Atlantic since the Holocene Thermal Maximum, resulting from decreasing Northern Hemisphere summer insolation (e.g. Calvo et al., 2002; Marchal et al., 2002; Andersen et al., 2004a, 2004b; Andersson et al., 2010; Jiang et al., 2015; Sejrup et al., 2016). … The earliest warm period at ~6.1-4 ka BP had average reconstructed SSTs of 12-13.3°C, with the warmest temperatures in the record occurring at ~6.1-5.5 ka BP (c. 13°C). The cooler period ~4-2 ka BP had reconstructed SST that varied around 11.5°C, with minima at 3.2 and 2.4 ka BP interrupted by a short warming at 2.7 ka BP. In the most recent period after 2 ka BP the SSTs again increased peaking at 1.8 ka BP, yet SSTs did not attain values as high as those reconstructed for 6.1-4 ka BP. … In the diatom-based record the mean reconstructed temperature between 4 and 2 ka BP is 11.5°C compared with 12.5 and 12.1°C in the periods before 4 ka BP and after 2 ka BP respectively, showing a reconstructed cooling of 0.6-1°C. In the dinocyst-based record the mean reconstructed temperature between 4 and 2 ka BP is 10.3°C compared with 11.3 and 11.6°C in the periods before 4 ka BP and after 2 ka BP respectively, showing a cooling of 1-1.3°C.” (Orme et al., 2018)

Below are a few of the many other cooling-since-the-Little-Ice-Age reconstructions that have already been highlighted in 2018.
“The average RAN15-MAAT of 18.4°C over the most recent part of the record (<0.8 ka BP) [the last 800 years BP] overlaps with the range of MAATs, ca. 16.2°C to 18.7°C (av. 17.5°C) measured since 1952 at the nearest meteorological station (Yichang, located ca. 100 km away) and is very close to the av. MAAT of 18°C measured directly outside the cave by a temperature logger between 2004 and 2007 (Hu et al., 2008a). This agreement between reconstructed temperatures and instrumental measurements increases our confidence in the potential of the RAN15 proxy. RAN15-MAATs in HS4 vary from 16.5°C to 20.6°C (av. 19°C), during the last 9 ka BP, and broadly follow a long-term trend of declining temperatures in line with declining solar insolation at 30°N in July (Laskar et al., 2004). … Interestingly, the most recent 0.9 ka BP [900 years BP] is distinguished by greater variability with the highest (20.5°C) and lowest (16.5°C) RAN15-MAATs occurring consecutively at 0.6 ka BP [600 years BP] and 0.5 ka BP [500 years BP].” (Wang et al., 2018)

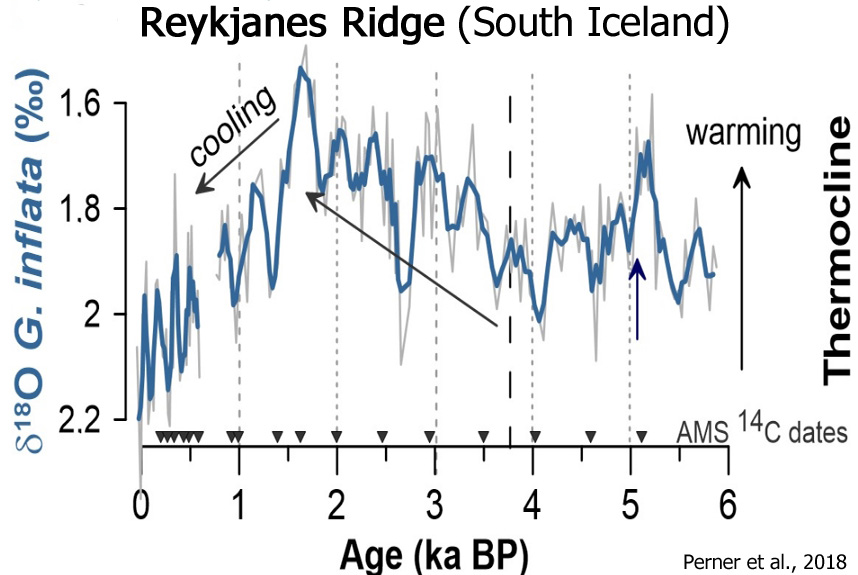
“From c. 1.5 ka BP onwards, we record a prominent subsurface cooling and continued occurrence of fresh and sea‐ice loaded surface waters at the study site.” (Perner et al., 2018)

“According to the present climate reconstruction, mid Holocene warming started only at 7,700 cal bp, with temperatures higher than now during the mid Holocene period. This warming was due to an increase in winter temperatures (1–5 °С higher than current), while summer temperatures remained relatively stable, with a July temperature<1 °С higher than now. … During the mid Holocene, two cold periods at 6,900–6,500 and at 5,300–5,000 cal bp were observed. Interestingly, during the cold periods, the temperatures exceeded the current ones by 0.5–1.5 °С. … The transition from the mid Holocene thermal maximum to the following period occurred without considerable climatic changes. The mean annual temperatures remained much higher than the current ones by 0.5–2.5 °С until 2,500 cal bp. Local maximum temperatures were observed at 4,800, 4,300, 3,500 and 2,900–2,700 cal bp. The present climatic reconstruction demonstrates a gradual cooling down to current levels at ca. 2,500 cal bp, and then followed by a new warming phase with up to 1–2 °С increase at approximately 1,500 cal bp.” (Nosova et al., 2018)

“The mean annual temperature recorded at the closest meteorological station [La Sarre: 1961–1990] is 0.8 °C, with August temperature averages of 15.0 °C (1961–1990) and 15.4 °C (1981–2010). … During zone Lch1 (8500–5800 cal year BP), the average reconstructed temperature was 16.9 °C, with a decrease from 19 °C (maximum) to 17 °C at the end of the zone. In zone Lch-2 (ca. 5700–3500 cal year BP), temperatures had an average of 16.8 °C, with a decrease from 17.8 °C around 5200 cal year BP to 16.2 °C at 3400 cal year BP. Zone Lch-3 (ca. 3500–1200 cal year BP) started with inferences for high temperatures (19.3–18.5 °C), followed by a decrease to 16.8 °C between ca. 3000 and 2500 cal year BP. An increase (18.3 and 19.6 °C) was inferred for the period between 1800 and 1500 cal year BP. The average chironomid inferred temperature during Zone 3 was 17.9 °C. In the last zone (Lch-4), the temperatures decreased from ca. 17.5 °C at the beginning of the zone to 14.8 °C at the end of the zone. The average during this zone was 16.5 °C. The temperature anomalies show that throughout the whole record, only six of the inferences were colder than the climate normal of 15.4 °C and three were colder than today, with the climate normal of 15 °C (Fig. 4b). The average anomaly from 15 °C (2.10 °C) and from 15.4 °C (1.70 °C) for the whole record showed that the temperature inferences were generally, and significantly, warmer than today.” (Bajolle et al., 2018)

“[A] general warm to cold climate trend from the mid-Holocene to the present, which can be divided into two different stages: a warmer stage between 6842 and 1297 cal yr BP and a colder stage from 1297 cal yr BP to the present.” (Song et al., 2018)

“Summer temperatures (MJT) at Xingyun Lake in the late glacial were low, increased during the early Holocene, were highest during the middle Holocene, and then decreased during the late Holocene. The range of inferred values [for the Holocene] was 21.0°- 26.5°C. The pollen inferred temperature derived from surface samples (21.2°C), is close to the modern instrumental July temperature in Kunming (22°C), supporting the reliability of reconstructions from down-core pollen assemblages.” (Wu et al., 2018)


Image Source: Zhang and Feng, 2018

Image Source: Wang et al., 2018
via NoTricksZone
November 22, 2018 at 10:49AM
