
“It seems as if the [New Mexico State University] alarmists are both unaware of the climate history of the region and are unable (unwilling?) to do a literature search, even though this is now trivial, using an internet connection and internet search.”
“Not a single climate forecast I’ve examined here had the slightest hint of cold, wet winters to come nor the record-setting snowfall and rainfall which has deluged most of the country the past year. Those claiming to be experts in climate, citing CO2 as a driver and computer models as worthwhile tools, ignored at their peril the twin roles of climate cycles and the power of the chaotic natural weather fluctuations.”
Las Cruces is home to New Mexico’s Land Grant school, New Mexico State University. While ostensibly home of The Educated, some climate pronouncements by faculty have proven to be terribly wrong.
Las Cruces, in southern New Mexico, is an hour’s drive from El Paso, Texas. Located both in the Mountain West and in the Chihuahuan Desert, Las Cruces’s cold-season precipitation patterns are governed by the related weather events El Nino Southern Oscillation and its 60-year-long big cousin, the Pacific Decadal Oscillation.
These readily known facts seemingly mean little to the faculty alarmists who proclaim the increasing amounts of carbon dioxide is leading to more droughts here. Mother Nature has played cruel tricks on their dire prognostications the past few years.
Particularly Poor Prognostications
On 16 August 2012, our USA Today affiliate, the Las Cruces Sun-News, carried the column: “Heat waves, droughts, and global warming: the connection,” by PhDs Donald Neidig, Thomas Schmugge and Mark Boslaugh who used the increasing number of high to low temperatures from the 1950s to 2012 as their figure of merit.
This cherry-picked period conveniently missed the most significant weather event of the 20th century, the Dust Bowl years. This decade, the 1930s, when atmospheric CO2 was 310 parts per million (ppm) or lower, had the most extreme maximum temperatures in US history.
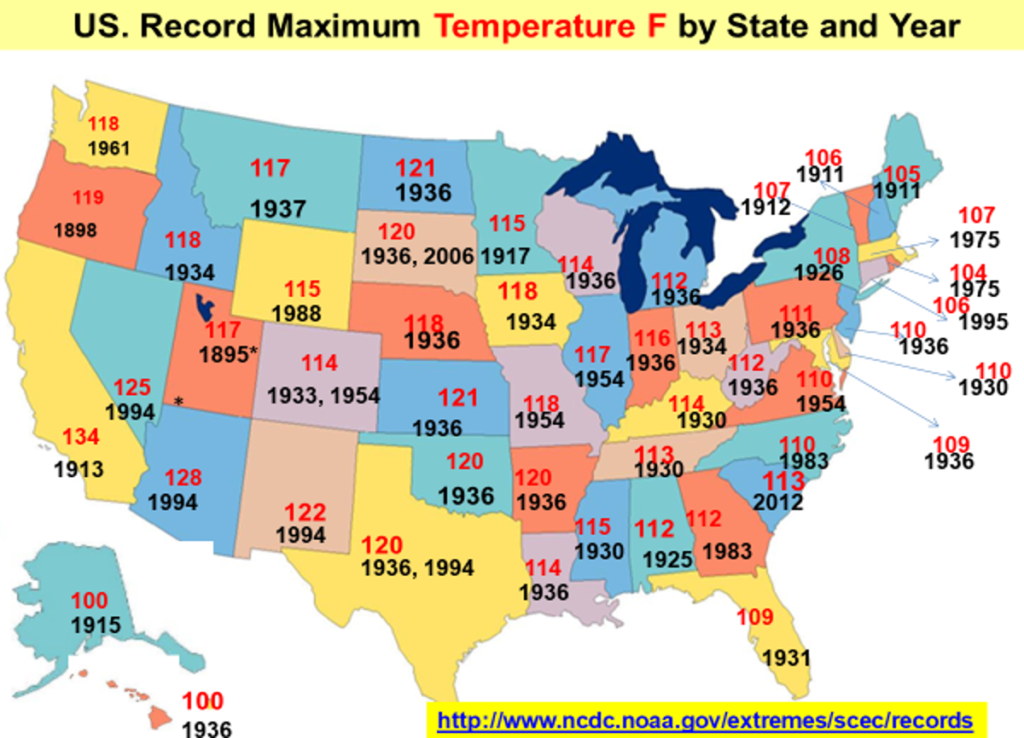
Figure 1. Extreme maximum temperature for each of the fifty states (plotted in red) and the year in which that extreme maximum was set (plotted in black). Twenty-eight of the fifty states’ extreme maxima were set in the 1930’s or before. The theory of CO2-fueled warming disagrees with the data.
19 June 2017 Las Cruces City Council Meeting: Council considered a motion rebuking
President Trump’s withdrawal from the Paris Climate Accord. I testified that
Henry’s Law from over 200 years ago explains the relationship between CO2 and
temperature, and that TEMPERATURE controls the release of CO2 from the oceans,
not the reverse. I showed graphics displaying Henry’s Law effects and
thousand-year Bond Cycles which explain much of climate change the last 3500,
even 10,000 years, also discussed.at the
web site for our local climate study group, the Cruces Atmospheric
Sciences Forum.
That Council Meeting had over a dozen individuals who
testified that increasing CO2 caused the drought extant since year 2000; among
those, New Mexico State Senator Jeff Steinborn and New Mexico State
Representative Nathan Small. I chatted with them after the meeting, explaining
100 years of data showed droughts decreasing as <CO2> was increasing. I
emailed them showing them my data sources and asked for their data sources,
neither replied.
The Senator and The University
Perhaps New Mexico’s most zealous Climate Alarmist is US Senator Tom Udall; his office is responsible for NMSU sponsoring a “climate education” series of lectures commencing in Spring 2018 and ongoing. I have attended several of these lectures and, far from being educational or based in sound science, the ones I’ve attended have been long on these themes: “CO2 is causing hotter and drier conditions,” “John Tyndall and Svante Arrhenius predicted climate doom in the 1800s,” “Climate Models are a value-added tool for climate forecasting and policy determination.”
The program is named NMSUCCESS, New Mexico State University
Climate Change Education Seminar Series; some of the lecture videos are on line
at https://nmsuccess1.wordpress.com/talk-videos/. I recommend you avail yourselves of this
opportunity to see and hear what is being presented and to validate for
yourselves whether my criticisms are correct.
The NMSU presentations used climate change diagnostics shorter
than the 60-year period characteristic of important climate cycles. Both the Atlantic Multidecadal Oscillation
(North American Temperatures) (AMO) and the Pacific Decadal Oscillation (western
North American Precipitation) (PDO) have 60-year periodicities. None of the lectures mentioned the term
“climate cycles,” or the ~1000-year
Bond Cycles, which show up prominently in ice core and
other proxy temperature time series for the Holocene, the present interglacial.
I never saw these words and acronyms mentioned in NMSU’s
“Climate Education” series: Holocene, Glacial period, Interglacial period,
millennial climate changes, Roman Warm Period, Little Ice Age, AMO, PDO, Modern
Warm Period.
Stunning. Education? More like propaganda.
When I asked a direct question about the millennial “Bond
Cycles,” the “expert” presenter either begged off, changed the subject, or
answered by not answering.
Data’s Different Story
Observations in the Mountain West have repeatedly
demonstrated the wild naturally occurring climate fluctuations within the
recent past which are brought about by rapid changes from El Nino to La Nina conditions
as ocean
temperatures change offshore western North America. In 1954 the droughts were so severe that New
Mexico’s largest water body, Elephant Butte Reservoir, went down to 0.1 percent
of capacity; that event was
measured on 6 August 1954.
According to data analyzed by the University of Arizona
Tree Ring Laboratory, New Mexico had the wettest period in the
past 2000 years in the late 20th Century.
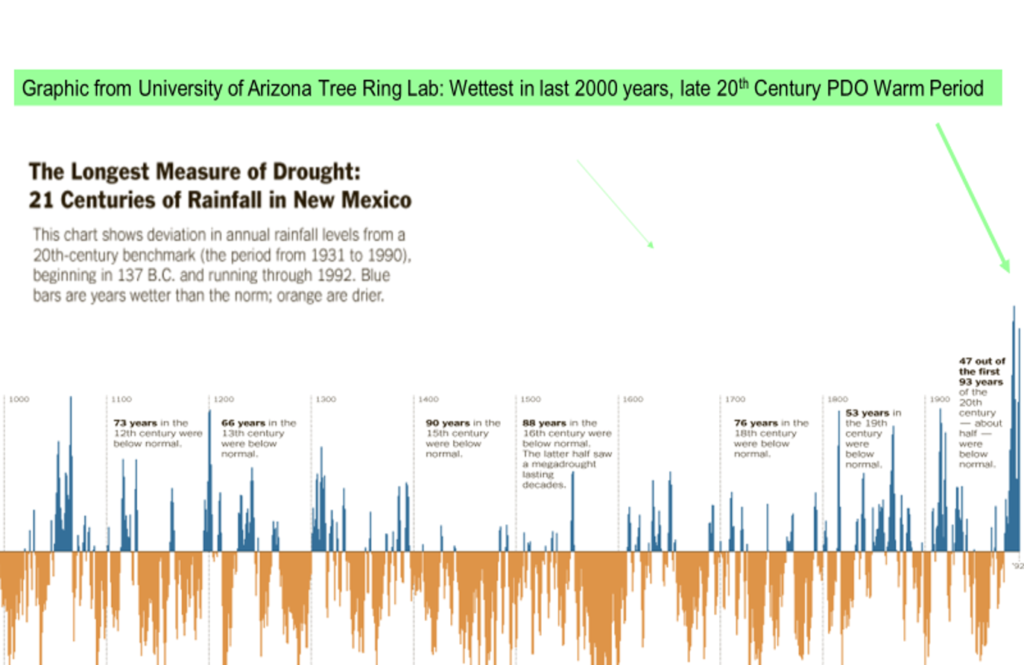
Figure 2. Plot of New Mexico rainfall and drought from the University of Arizona Tree Ring Laboratory; analyzed in terms of departures from the 20th Century mean from 1900 to 1993, the horizontal line, and published by the New York Times. Browns designate droughts and Blues indicate pluvials (wet periods). Notice these important features: frequent changes from drought to pluvial to drought, depth of the 1950s drought, punishing droughts in the Little Ice Age, late 20th century pluvial, wettest in 2000 years.
The late 20th
Century pluvial corresponds with PDO-warm (and wet) phase. Prominent weather
events during that period proved historic, examples include:
30 March 1982:
Space Shuttle Columbia lands at Northrup Strip, White Sands Missile Range. The primary landing site at Edwards AFB was flooded
because of the PDO-warm pluvial of the 1980s.
May1983: Interstate15 north of Salt Lake City flooded
because Great Salt Lake overflowed from heavy rain and snow runoff that winter
and spring.
June 1983: Emergency
construction was undertaken at Glen Canyon Dam’s spillway gates. The El Nino at
the peak of the PDO-warm cycle produced such prodigious amounts of snow and
rain in the Colorado River basin that the resulting high water nearly overtopped
the spillways.
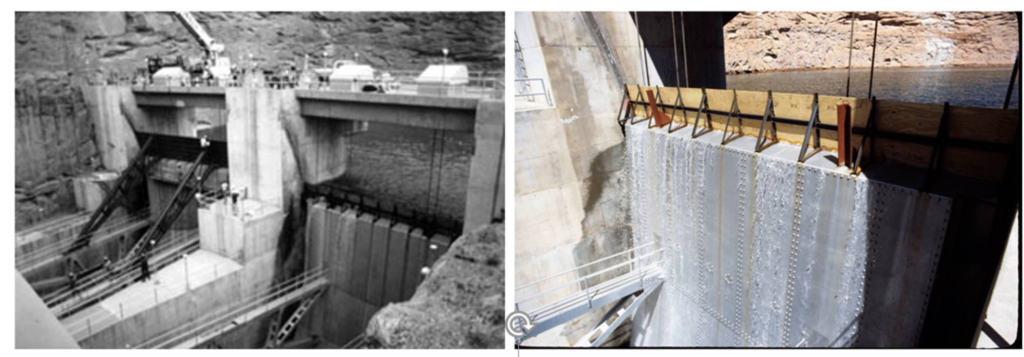
Figure 3. 1983 was the peak of the PDO-warm phase of the late 20th century and resulted in extremely wet conditions in the US mountain West. The resulting peak runoff of 1983 severely affected the entire Colorado River Dam system. These images show how close the Glen Canyon Dam came to be being catastrophically affected. Water got so high at Glen Canyon Dam that a plywood flashboard was improvised to prevent overtopping the spillway gates. Left; Right
These events are reflected in the long-term precipitation
records here, presented below.
There are over a century’s worth of rainfall records for
the area available from Jornada
Range, a multi-agency research station about 20 miles
north-northeast of Las Cruces. The data show that as the concentration of CO2
has increased in the past century, rainfall has been increasing!
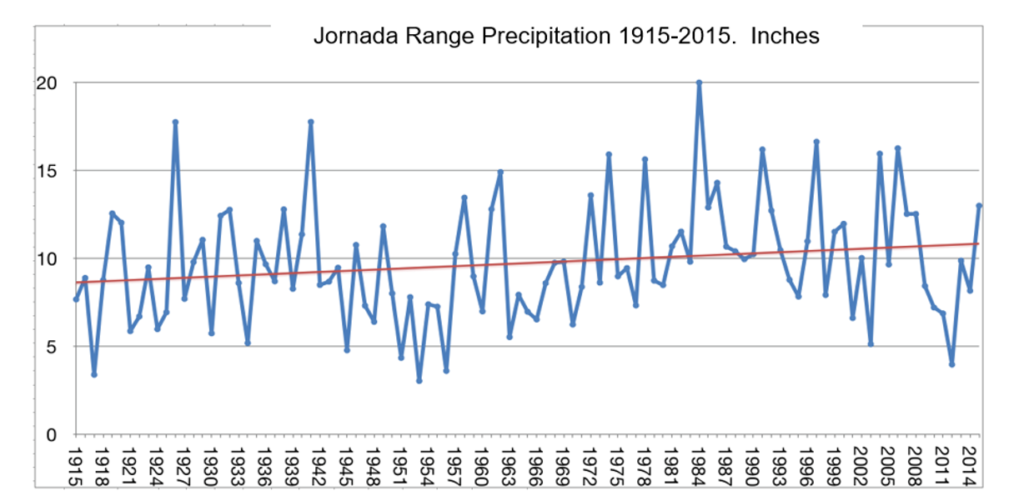
Figure 4. Plot of rainfall since 1914 at Jornada Range, New Mexico. Strong indications of the effect of the Pacific Decadal Oscillation’s 60-year period are shown with the minima in 1954 and 2012 and the sharp peak in 1984. Significant precipitation increases are indicated by the red trend line. Source here. Plot courtesy of Bernie McCune
When the PDO returned to its cold phase about 2000, the return
of more frequent La Nina droughts started to bring out these cries:
“It’s all our fault!
More CO2 brings more drought!”
It seems as if the alarmists are both unaware of the
climate history of the region and are unable (unwilling?) to do a literature
search, even though this is now trivial, using an internet connection and
internet search.
The Garfin Files
The 25 April 2018 presentation by University of Arizona climate
expert Gregg Garfin, Coordinating Lead Author for the Southwest Chapter of the
National Climate Assessment, carried the title, “A look ahead for the
Southwest, Hotter and More Arid.” The
title is emblematic of the alarmist doctrine.
Garfin has been the subject of several posts of mine,
including his effective use of
color for propaganda purposes, a 4-part
analysis of his lecture, and a
presentation which contains numerous newspaper references
to the global climate anomaly of the Dust Bowl Years
It’s amazing to me that during his lecture, Garfin
presented a “peer-reviewed” paper which said increased forest fires in the west
were from “climate change during the period 1984-2015.” There was a minimum of
forest fire activity in 1983 and 1984 because of the excessive rain and
snowfall at the peak of this pluvial. There was a slight increase in fire
activity in the years after 1983, but by choosing a start date of 1984, the
“peer-reviewed article” was merely cherry picking a peak in the pluvial and
minimum of fire activity as the start date for their period. That this abuse occurs in the “peer-reviewed
literature” is a failure of the peer-review process and a disgrace to Science.
My 16
June 2018 presentation to the Cruces Atmospheric Sciences Forum uses
Garfin’s own graphics to analyze and criticize that lecture.
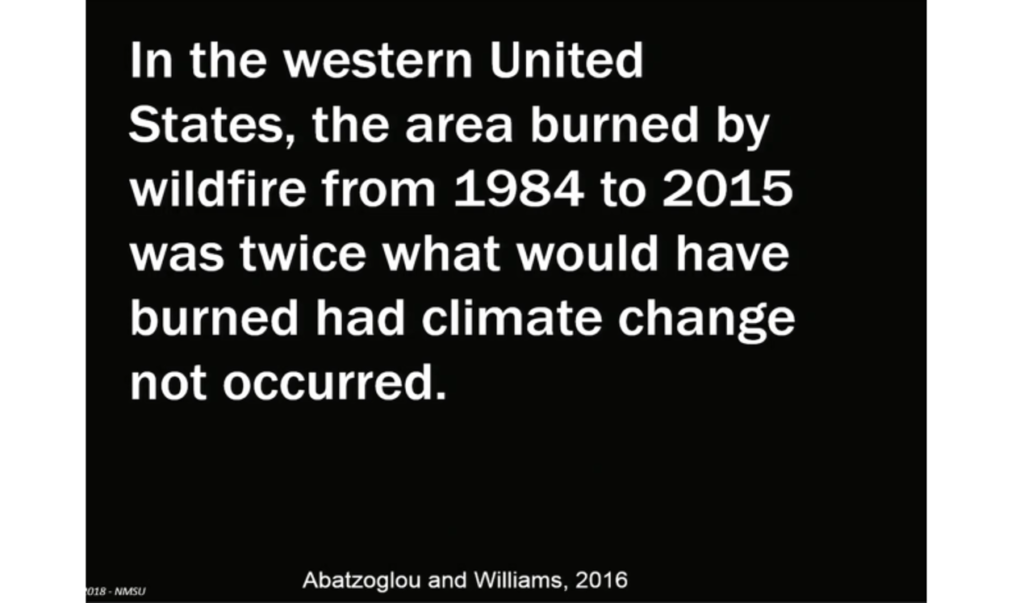
Figure 5. Gregg Garfin’s graphic speaks of “climate change.” In 1983 the El Nino at the peak of the Pacific Decadal Oscillation -warm period resulted in so much rain and snow that the spillways at Glen Canyon Dam came perilously close to being overtopped. That same year there was a distinct minimum of fires in the west. So, to claim that a subsequent increase in fires from the distinct minimum of fires during the peak of the late 20th century pluvial was caused by what Garfin says is human-caused, CO2-fueled “climate change” reveals an attempt to deceive, not an attempt to educate.
The Hayhoe Show
Another alarmist presentation was by Texas Tech’s Katharine
Hayhoe; an
introduction to the errors in her 6 Feb 2019 presentation is on the
CASF web site. Her presentations deliberately mislead the young, the innocent,
and the ignorant by proclaiming that present temperatures are hottest in the
past 6,000 years, all caused by our use of fossil fuels.
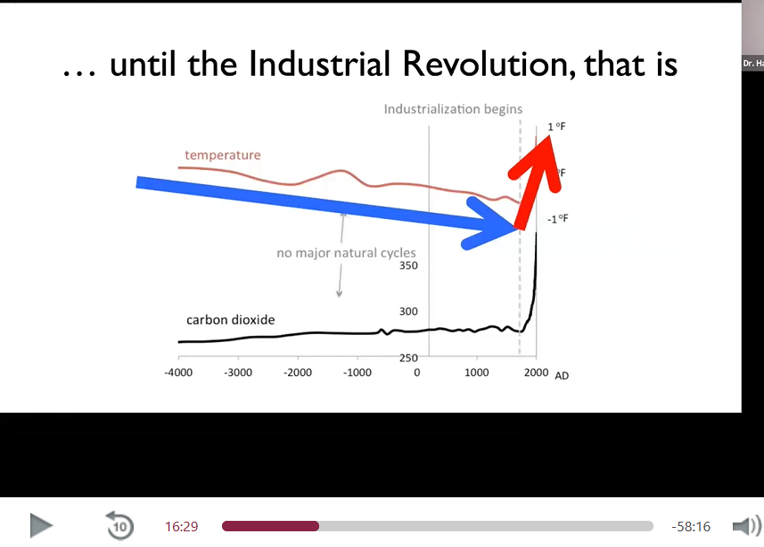
Figure 6. Screen capture from Katharine Hayhoe’s 6 Feb 2019 presentation at NMSU delivered over the internet. Here she displays a graphic of CO2 and temperature, no source or reference, for the past 6,000 years. Note these two important errors: 1) She shows “no major natural cycles” for this period. 2) She shows present temperatures are warmest of the past 6,000 years.
I presented my analysis of Hayhoe at our 16 Feb 2019 meeting of the Cruces Atmospheric Sciences Forum. Besides ignoring the inconvenient thousand-year cycles, another of her deliberate distortions is that computer forecasts are a worthwhile, valid, and undisputable resource to determine future conditions. Examples of her forecasts from her presentation at NMSU are shown below. The Hayhoe graphics are screen captures from the above link; each gives the time of the segment.
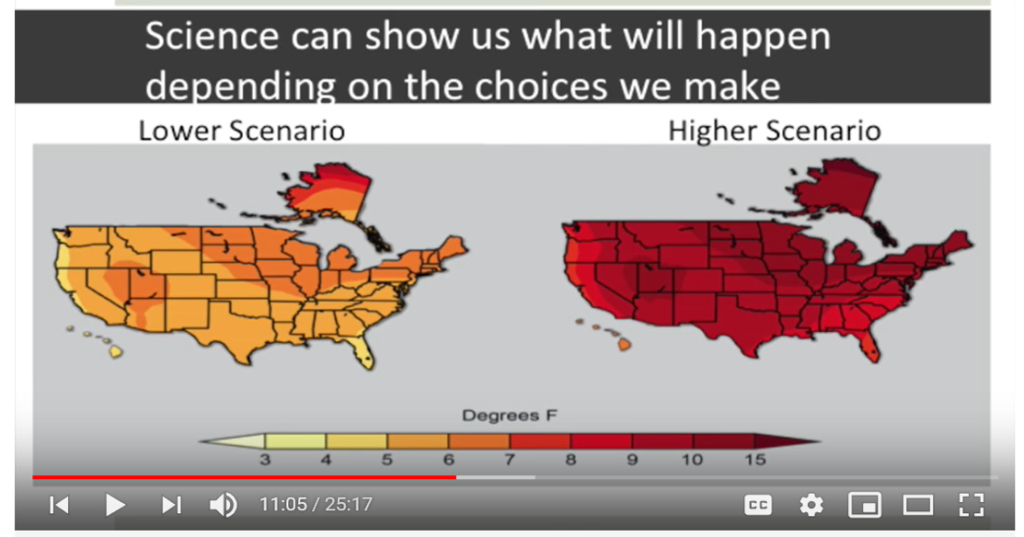
Figure 7. Hayhoe’s forecast for the United States showing dramatic surface warming of 5F to 10F. She says this is “what will happen.”
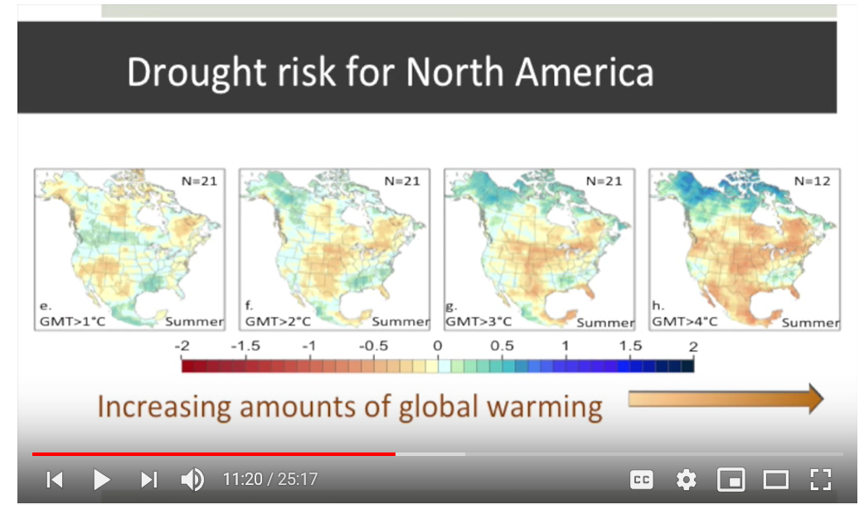
Figure 8. Hayhoe made an error in the color bar; it is pasted backwards. She shows warming means drying, with 3C or 5.5F warming in New Mexico leading to more drought, as the graphic title, Drought Risk for North America, states.
That adding CO2 will cause 5F or 10F warming without causing a dramatic increase in rainfall in the southwest USA simply cannot occur. Such surface warming increases during the North American Monsoon would cause prodigious increases in rainfall, turning desert to jungle, as now seen in southern Mexico. Hayhoe makes not the slightest hint that her computer-generated forecasts are well out of the mainstream of balloon-based or satellite-derived observations.
Those Pesky Bond Cycles
Perhaps one of the most important pieces of evidence which
punches a huge hole in Carbon Dioxide Climate Theory is the answer to the
question pertaining to the increase in surface temperatures since the wide
deployment of liquid-in-glass thermometers in the 1800s.
The question is, “Has this (warming) happened before?”
The answer involves the concept of proxies, in this case, a
proxy for temperature. Proxies for
temperature exist when we can find, for instance, deposits of materials from a
temperature-dependent process which has existed in nature over long periods of
time. One of the most useful proxies is
the temperature dependence of the oxygen isotope ratio, the O16/O18 ratio, in
water vapor. The vapor evaporated from
warm ocean water, became cloud liquid water, was transported poleward, changed
phase to solid crystal, and fell as snow, repeatedly, over centuries, as has
happened in the Greenland Ice Sheet.
Penn State University professor Richard Alley published on
the Younger
Dryas as viewed from Central Greenland in 2000. These data
have subsequently been analyzed by Dr Don Easterbrook, and Easterbrook’s work
shows the temperature of the entire Holocene, the temperatures since the
Wisconsin Ice Sheet melted away beginning 15,000 years ago.
Dr
Easterbrook’s plots distinctly show the Minoan, Roman and Medieval
warm periods. The Minoan, Roman and Medieval warm periods occurred when CO2 was
280 Parts Per Million, yet these warm periods were warmer than the Modern Warm
Period which now (2019) has ~415 PPM CO2.
Both ice core and tree ring proxies show the answer to the
question posed above, “Has this happened before?” is ‘Yes, about
thirteen times in the past 10,000 years, the Holocene.’
A textbook example of the use of multiple proxies for
determining temperature history of the Northern Hemisphere was done by Ljungqvist
et al, subsequently analyzed and used in Roy Spencer’s blog:
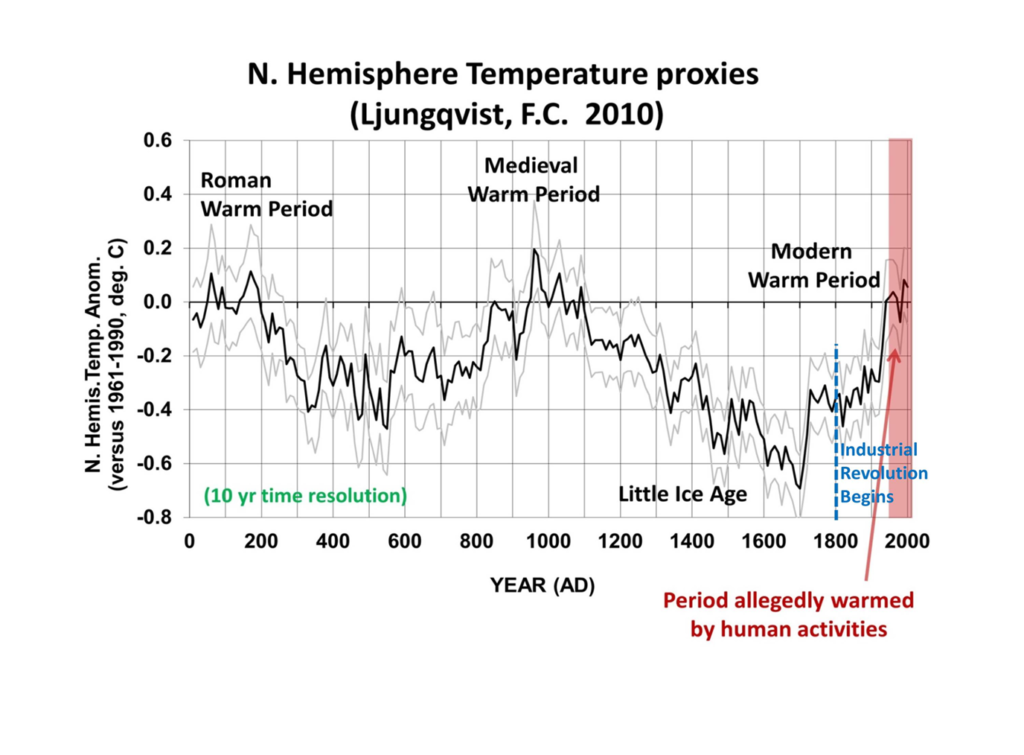
Figure 9. Two thousand years of multi-proxy temperatures for the Northern Hemisphere analyzed by Ljungqvist, et al, with annotations by Dr Roy Spencer . The Roman, Medieval, and Modern warm periods are displayed with a ten-year time resolution. The minimum of temperature about 550AD is sometimes called the Dark Ages because crops frequently failed, and many babies perished. The depth of the Little Ice Age is about 1690AD and is the coldest of the ~10,000 year-long Holocene.
The thousand-year periodicity of these cold and warm cycles
was determined by analysis
of deep-sea mud cores from the Atlantic published in SCIENCE in 1997 by Gerard Bond et al. The likely persistent
Solar
Influence as the cause of these climate changes was described by
Bond in 2001 in SCIENCE; therefore,
many of us refer to these naturally-occurring cycles as “Bond Cycles.”
Mother Nature Has Her Say
This year, 2019, Mother Nature has played a cruel joke on
these “Hotter and Drier” alarmist proclamations.
From the headlines:
USA Today, 9
March 2019: “Wetter than ever: Winter 2018-19 was USA’s
soggiest in recorded history.”
Washington
Post
9 May 2019:” The United States just had its wettest 12 months on record…” (now pay-walled)
Farmington
Daily Times, 11 May 2019: “Mother’s Day weekend storm adds
to New Mexico’s already impressive snowpack.”
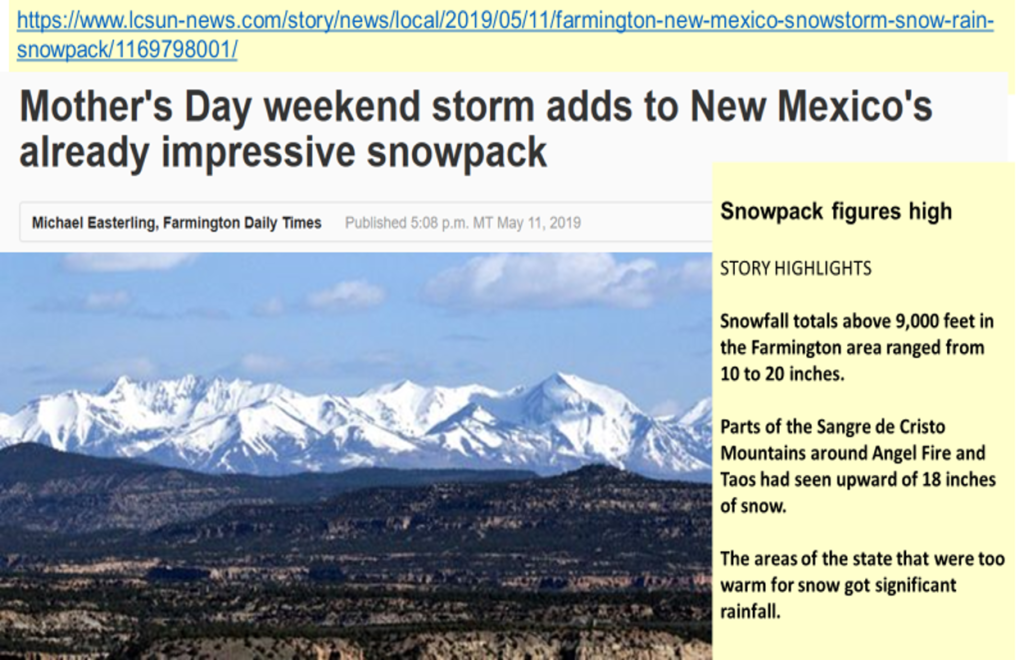
Figure 10. USA Today is among the loudest climate alarmist voices, but their Farmington New Mexico Daily Times joins the mother ship in blurting out the truth: despite increasing atmospheric CO2, now ~415 Parts Per Million, mountain snowfall was prodigious.
Despite repeated forecasts of hotter, drier conditions for
New Mexico and especially the southern part of the state, Mother Nature has
shown that she’s in charge of the weather and climate. Not a single source cited here (nor the
others in the “climate education” lectures) mentioned even the remotest
possibility that the increasing rainfall trends shown by the University of
Arizona Tree Ring Laboratory displayed in Figure 2, or the rain gage data for
Jornada Range shown in Figure 4 might temper their ‘Climate Doom Through Drought’
prognostications.
On 10 June 2019 a final disturbance in the cool-season
weather caused an extremely wet Monday in the Chihuahuan Desert here. Rainfall
was seemingly all day long and when the totals were analyzed, it was the tenth
rainiest day in over a century of record-keeping. Excerpts from the Sun-News
story follow below:
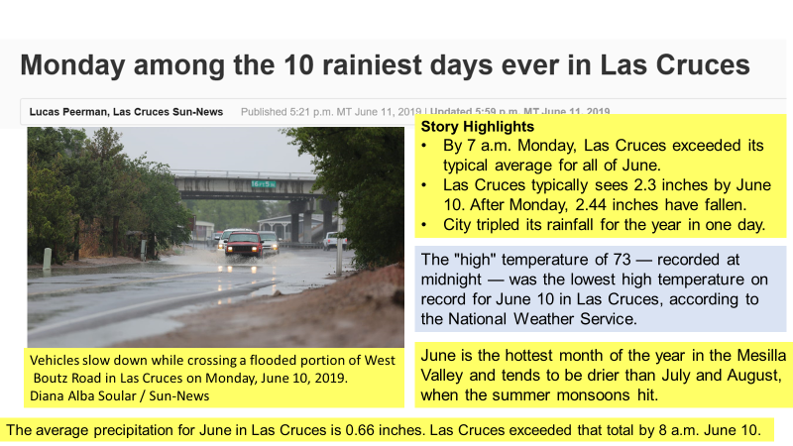
Figure 11. Composite graphic of highlights from the Las Cruces Sun-News story of 11 June 2019, https://www.lcsun-news.com/story/news/local/2019/06/11/monday-among-10-rainiest-days-ever-las-cruces/1426001001/ The real story is in the dates in the bottom of the graphic. While not proof, seven of the wettest ten days are in the period since 1950. If increasing CO2 is causing drying, then we would expect seven of the wettest to be BEFORE 1950. Chalk this story and its data up as Another Failure of Carbon Dioxide theory.
The ten rainiest days measured at New Mexico State
University are prominent in the 11 Jun 2019 story in the Las Cruces Sun News,
“Monday among the 10 Rainiest days in Las Cruces.” Each of the ten rainiest dates
is listed. Seven of the ten rainiest days have occurred since 1950, the period
when the Intergovernmental Panel on Climate Change says the adverse effects of
increasing CO2 are dominant.
The data clearly suggest that more CO2 in the air does not
reflect more drought here. The century-long increases in precipitation appear
to reflect the beneficial effects as the cold and drought of the Little Ice Age
recede into the past. History reveals that the Spanish
Mission at Abo, near Mountainair, NM, was established in
1620, but had to be abandoned in the punishing Little Ice Age drought of the
late 1600s.
The Story at “The Butte”
I mentioned Elephant Butte Reservoir was the largest body
of water in New Mexico; its impounded waters are shared among Texas, New
Mexico, and Mexico. Water is released from the reservoir beginning in the
spring, to flow down the Rio Grande to water users. Below is a plot of the water levels in
Elephant Butte Lake as of 11 July 2019.
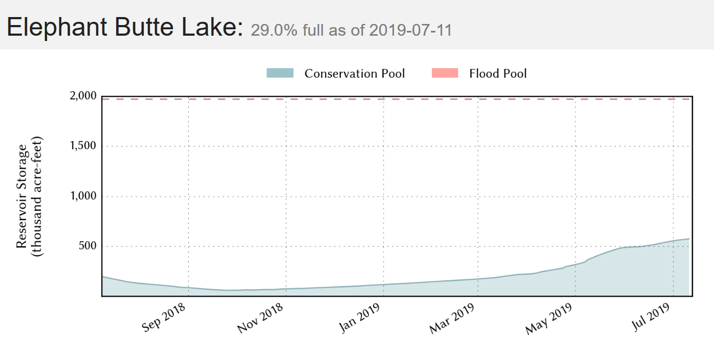
Figure 12. Plot of water levels at Elephant Butte Reservoir; the change of slope in late May reflects the beginning of releases of impounded waters for use by downriver customers. As of 11 July 2019, water levels were still rising, quite an unusual event for summertime.
Water levels were still rising from the spring melt as of
11 July 2019, an astounding turn-around from the previous year. Visitors to the Elephant Butte Web
site
may see the entire time history of “The
Butte’s” capacity levels by clicking the Historical tab. The 11 July 2019 example is shown below.
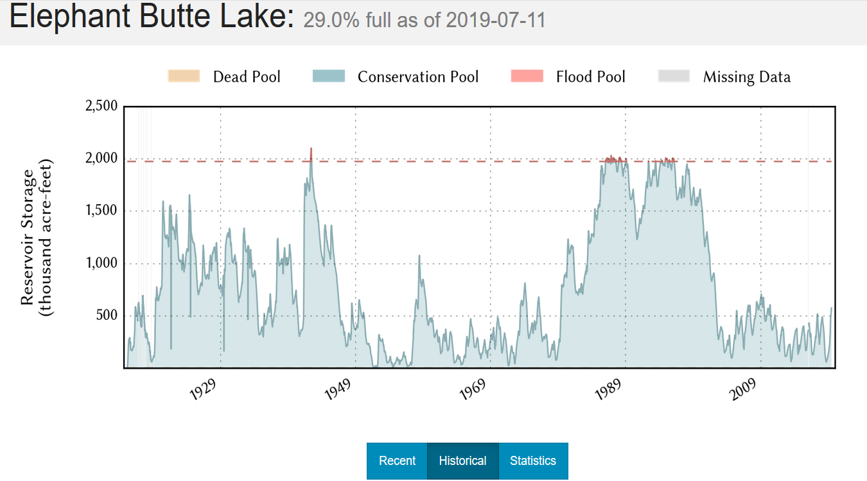
Figure 13. Historical data for Elephant Butte Reservoir has been compiled every day since 21 March 1915, even before the dam was completed in 1916.The prominent pluvial of the late 20th Century is visible in the data, but so are the droughts of the 1950s, and the return to low lake levels in the droughts of the 2010s. The ~60-year periodicity of the Pacific Decadal Oscillation is marked by the low lake levels of the 1950s, late 20th Century pluvial, and the return to low levels ca 2012.
And, in Conclusion…
Making weather and climate forecasts involves solving the equations of atmospheric motion. For over 200 years we have been able to write the equations down, but since they contain nonlinear terms, we can’t solve them, even with modern computers.
Numerical Weather Predictions are significantly better than when I began as an operational forecaster in the 1960s. Today, possibilities of severe weather and arctic air outbreaks are now foreseen almost a week in advance. Nonetheless, there are time limits and numerical forecasts eventually break down because of our inability to solve the nonlinear terms.
The Climate Prediction Center issued the Winter
2018-2019 Outlook on 18 October 2018 which featured warmer
weather and drier for many areas of the northern CONUS, with only a small area
from along the southern and middle Atlantic states wetter than average. I
encourage you to visit the site. The twin realities, “Wetter than ever: Winter
2018-19 was USA’s soggiest in recorded history,” and the coldest on record as
plotted here, point out that at present, climate forecasting, even a season ahead, is
beyond the state of the art.
Why is this so?
Weather and climate have always changed in a chaotic
manner. This is one reason why we write down observations and keep weather
records of all kinds. This chaotic characteristic is so fascinating to us that
it is commonly the lead item in the news. Mother Nature deals us these chaotic
changes in weather and climate with no need to claim human or supernatural
influence.
It is just the way things are, and in a career analyzing
and forecasting the weather for operational missions in Asia (Thailand,
Vietnam), Oceania (Guam) Europe (Germany, in the Cold War) and the USA (Montana,
Arizona, New Mexico), I have perhaps a deeper appreciation than many of the
limits of predictability of the future state of the atmosphere.
Not a single climate forecast I’ve examined here had the slightest hint of cold, wet winters to come nor the record-setting snowfall and rainfall which has deluged most of the country the past year. Those claiming to be experts in climate, citing CO2 as a driver and computer models as worthwhile tools, ignored at their peril the twin roles of climate cycles and the power of the chaotic natural weather fluctuations.
——————
Robert
W. Endlich, resident of Las Cruces, New Mexico, served as a Weather
Officer in the U. S. Air Force for 21 Years. From 1984 until 1993 he provided toxic
corridor and laser propagation support to the High Energy Laser Systems Test
Facility at White Sands Missile Range. He has worked as software instructor and
software test engineer at New Mexico State University and published in the
technical literature.
He
was elected to Chi Epsilon Pi, the national Meteorology Honor Society, while a
basic meteorology student at Texas A&M University. He has a bachelor’s
degree in geology from Rutgers University and a master’s in meteorology from
the Pennsylvania State University.
The post Incredibly Poor Climate Forecasts Made for Las Cruces and New Mexico appeared first on Master Resource.
via Master Resource
July 24, 2019 at 01:15AM

Reblogged this on Climate- Science.
LikeLike