
In the last few years, hundreds of peer-reviewed scientific papers have been published linking changes in solar activity to Earth’s climate (2016, 2017, 2018). The evidence for a robust Sun-Climate connection continues to accumulate in 2019.
When it comes to the Sun’s influence on climate, one conclusion is certain: there is no widespread scientific agreement as to how and to what extent solar activity and its related parameters (i.e., galactic cosmic rays, geomagnetic activity, solar wind flux) impact changes in the Earth’s temperature and precipitation.
The disagreement is so chasmic and the mechanisms are so poorly understood that scientists’ estimates of the influence of direct solar irradiance forcing between the 17th century and today can range between a negligible +0.1 W m-2 to a very robust +6 W m-2 (Egorova et al., 2018; Mazzarella and Scafetta, 2018).
“There is no consensus on the amplitude of the historical solar forcing. The estimated magnitude of the total solar irradiance difference between Maunder minimum and present time ranges from 0.1 to 6 W/m2 making uncertain the simulation of the past and future climate.” (Egorova et al., 2018)
“According to the IPCC (2013), solar forcing is extremely small and cannot induce the estimated 1.0–1.5 °C since the LIA. However, thesolar radiative forcing is quite uncertain because from 1700 to 2000 the proposed historical total solar irradiance reconstructions vary greatly from a minimum of 0.5 W/m2 to a maximum of about 6 W/m2 (cf..: Hoyt and Schatten 1993; Wang et al. 2005; Shapiro et al. 2011). Moreover, it is believed that the sun can influence the climate also via a magnetically induced cosmic ray flux modulation (e.g.: Kirkby 2007) or via heliospheric oscillation related to planetary resonances (e.g.: Scafetta 2013, 2014b; Scafetta et al. 2016, and others). Since solar and climate records correlate quite significantly throughout the Holocene (cf: Kerr 2001; Steinhilber et al. 2012; Scafetta 2012, 20104b), the results shown herein may be quite realistic, although the exact physical mechanisms linking astronomical forcings to climate change are still poorly understood.” (Mazzarella and Scafetta, 2018)
Thus far in 2019, 55 scientific papers have been located that link solar forcing to climate changes. This is an incomplete compilation and it is likely to swell to about ~100 papers by year’s end or upon further review.
Such a large volume of research devoted to finding connections between the Sun’s variability and its effect on the Earth’s climate system would seem to contradict the conclusion that there is widespread consensus that the Sun’s climate impact is negligible.
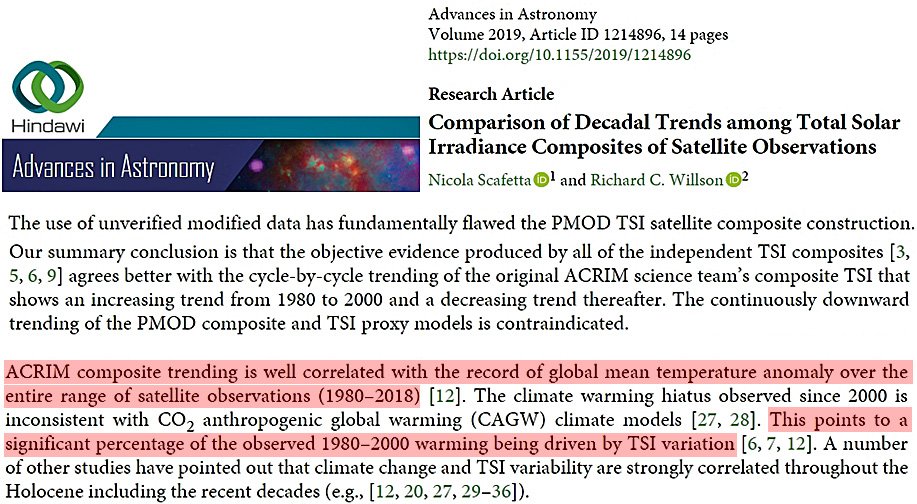
Scafetta and Willson, 2019 The consistent downward trending of the PMOD TSI composite is negatively correlated with the global mean temperature anomaly during 1980–2000. This has been viewed with favor by those supporting the CO2 anthropogenic global warming (CAGW) hypothesis since it would minimize TSI variation as a competitive climate change driver to CO2, the featured driver of the hypothesis during the period (cf.: [IPCC, 2013, Lockwood and Fröhlich, 2008]). .. Our summary conclusion is that the objective evidence produced by all of the independent TSI composites [3,5, 6, 9] agrees better with the cycle-by-cycle trending of the original ACRIM science team’s composite TSI that shows an increasing trend from 1980 to 2000 and a decreasing trend thereafter. The continuously downward trending of the PMOD composite and TSI proxy models is contraindicated. … PMOD’s modifications of the published ACRIM and ERB TSI records are questionable because they are based on conforming satellite observational data to proxy model predictions. … ACRIM shows a 0.46 W/m2 increase between 1986 and 1996 followed by a decrease of 0.30 W/m2 between 1996 and 2009. PMOD shows a continuous, increasing downward trend with a 1986 to 1996 decrease of 0.05 W/m2 followed by a decrease of 0.14 W/m2 between 1996 and 2009. The RMIB composite agrees qualitatively with the ACRIM trend by increasing between the 1986 and 1996 minima and decreasing slightly between 1996 and 2009. … ACRIM composite trending is well correlated with the record of global mean temperature anomaly over the entire range of satellite observations (1980–2018) [Scafetta. 2009]. The climate warming hiatus observed since 2000 is inconsistent with CO2 anthropogenic global warming (CAGW) climate models [Scafetta, 2013, Scafetta, 2017]. This points to a significant percentage of the observed 1980–2000 warming being driven by TSI variation [Scafetta, 2009, Willson, 2014, Scafetta. 2009]. A number of other studies have pointed out that climate change and TSI variability are strongly correlated throughout the Holocene including the recent decades (e.g., Scafetta, 2009, Scafetta and Willson, 2014, Scafetta, 2013, Kerr, 2001, Bond et al., 2001, Kirkby, 2007, Shaviv, 2008, Shapiro et al., 2011, Soon and Legates, 2013, Steinhilber et al., 2012, Soon et al., 2014). .. The global surface temperature of the Earth increased from 1970 to 2000 and remained nearly stable from 2000 and 2018. This pattern is not reproduced by CO2 AGW climate models but correlates with a TSI evolution with the trending characteristics of the ACRIM TSI composite as explained in Scafetta [6,12, 27] and Willson [7].
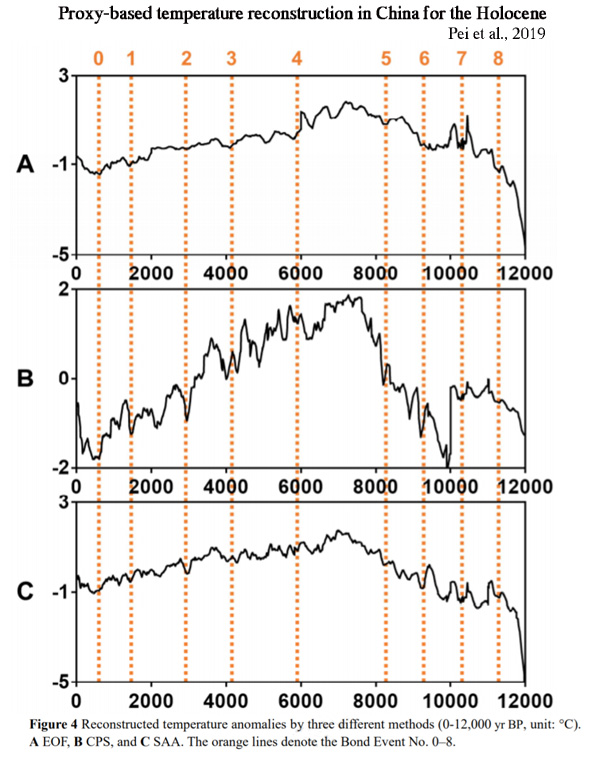
Pei et al., 2019 During the period of 0–10,000 yr BP, China’s temperature has closely followed the solar forcing. The correlation is as high as 0.800 (p < 0.01) for the EOF-based reconstruction. … Similar to the North Atlantic SST, AO also plays an important role in China’s temperature (Zuo et al., 2015). NAO and AO are both suggested to influence the climate in East Asia by modifying the strength and location of the 200 hPa jet stream (Yang et al., 2004). The AO record of Darby et al. (2012) is based on sea-ice drift, which has a high resolution of 10–100 years and shows a close connection with solar activities.
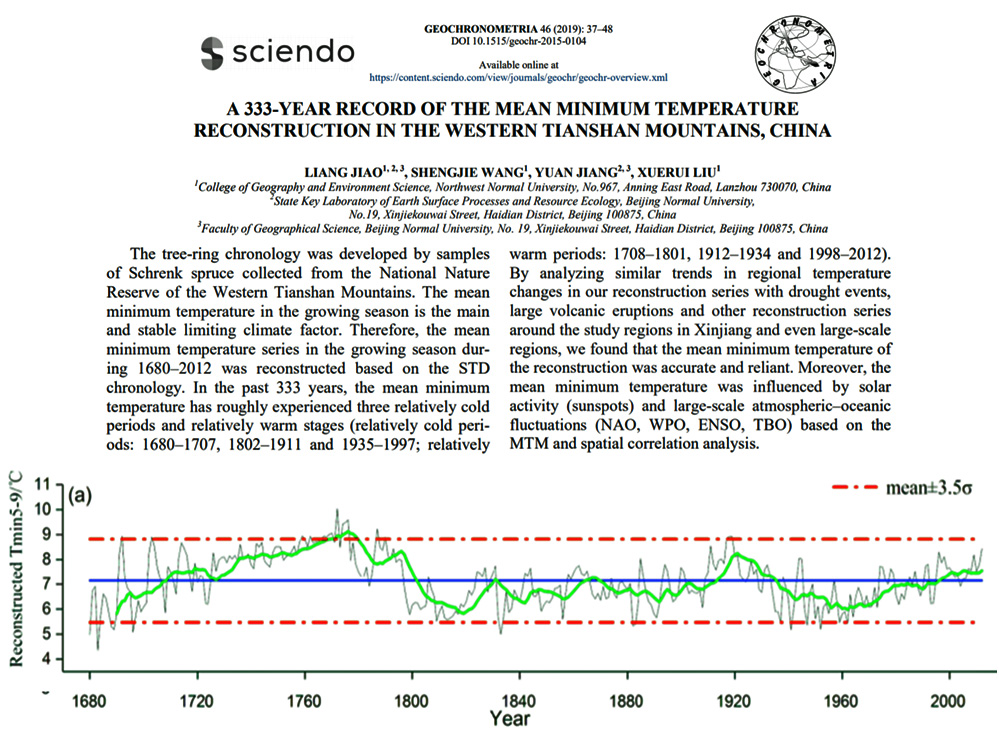
Jiao et al., 2019 Regional climate change is affected by large-scale climate-forcing factors, such as solar activity and atmospheric–oceanic variability (Fang et al., 2010; Linderholm et al., 2015; Rydval et al., 2017). On the one hand, based on the MTM analysis results, the temperature changes in the study area are mainly influenced by the solar activity via the mean minimum temperature within approximately 11-year periods (Li et al., 2006; Wang et al., 2015). The tree-ring chronology was developed by samples of Schrenk spruce collected from the National Nature Reserve of the Western Tianshan Mountains. The mean minimum temperature in the growing season is the main and stable limiting climate factor. Therefore, the mean minimum temperature series in the growing season during 1680–2012 was reconstructed based on the STD chronology. In the past 333 years, the mean minimum temperature has roughly experienced three relatively cold periods and relatively warm stages (relatively cold periods: 1680–1707, 1802–1911 and 1935–1997; relatively warm periods: 1708–1801, 1912–1934 and 1998–2012). By analyzing similar trends in regional temperature changes in our reconstruction series with drought events, large volcanic eruptions and other reconstruction series around the study regions in Xinjiang and even large-scale regions, we found that the mean minimum temperature of the reconstruction was accurate and reliant. Moreover, the mean minimum temperature was influenced by solar activity (sunspots) and large-scale atmospheric–oceanic fluctuations (NAO, WPO, ENSO, TBO) based on the MTM and spatial correlation analysis.
Zharkova et al., 2019 Recently discovered long-term oscillations of the solar background magnetic field associated with double dynamo waves generated in inner and outer layers of the Sun indicate that the solar activity is heading in the next three decades (2019–2055) to a Modern grand minimum similar to Maunder one. On the other hand, a reconstruction of solar total irradiance suggests that since the Maunder minimum there is an increase in the cycle-averaged total solar irradiance (TSI) by a value of about 1–1.5 Wm−2 closely correlated with an increase of the baseline (average) terrestrial temperature. … These oscillations of the baseline solar magnetic field are found associated with a long-term solar inertial motion about the barycenter of the solar system and closely linked to an increase of solar irradiance and terrestrial temperature in the past two centuries. This trend is anticipated to continue in the next six centuries that can lead to a further natural increase of the terrestrial temperature by more than 2.5 °C by 2600.
Deke et al., 2019 The results provide robust evidence for synchronous ~500-yr cyclical changes in monsoon climate, human activity and prehistoric cultural development in the East Asian Monsoon (EAM) region during the Holocene. Six prosperous phases of Neolithic and Bronze Age cultures correspond approximately to warm-humid phases caused by a strengthened EASM, except for the first expansion of the Hongshan culture, which corresponds to the phase of strongest EASM in the middle Holocene. We suggest that humans responded to climatic fluctuations with different social strategies, leading to the rise and fall of early complex societies in the region.
(press release) The climate theory casting new light on the history of Chinese civilisation … Researchers say that when 500-year-long sun cycles brought warmth, communities flourished, but when the Earth cooled, ancient societies collapsed. … Scientists say they have found evidence beneath a lake in northeastern China that ties climate change and 500-year sun cycles to ups and downs in the 8,000 years of Chinese civilisation. According to the study by a team at the Institute of Geology and Geophysics in Beijing published in the science journal Nature Communications this month, whenever the climate warmed, Chinese civilisation prospered and when it cooled, it declined.
Jin et al., 2019 We show that a strong 11-year solar cycle can excite a resonant response of the intrinsic leading mode of the AWM [Asian winter monsoon] variability, resulting in a significant signal of decadal variation. The leading mode, characterized by a warm Arctic and cold Siberia, responds to the maximum solar irradiance with a peculiar 3 to 4-year delay. We propose a new mechanism to explain this delayed response, in which the 11-year solar cycle affects the AWM via modulating Arctic sea ice variation during the preceding summer. At the peak of the accumulative solar irradiance (i.e., 4 years after the maximum solar irradiance), the Arctic sea ice concentration reaches a minimum over the Barents–Kara Sea region accompanied by an Arctic sea surface warming, which then persists into the following winter, causing Arctic high-pressure extend to the Ural mountain region, which enhances Siberian High and causes a bitter winter over the northern Asia.
Horikawa et al., 2019 The Mg/Ca-derived SST record clearly represented five warmer periods at 6200–6000, 4900–4500, 4200–3800, 2600–2100, and 900–400 cal. year BP, almost consistent with previously published diatom records. These warmer events also corresponded to the periods in which warm molluscan assemblages increased at the northern end of the TWC, suggesting that periods of higher SST can be seen as reflecting the increased volume transport of the TWC. We interpreted the results of a model study showing that higher solar irradiance provoked positive Arctic Oscillation (AO)-like spatial patterns and the negative phase of the Pacific Decadal Oscillation (PDO) to mean that increased (reduced) TWC volume transport on the multi-centennial to millennial time scales was caused by high (low) solar insolation via a potential link between AO and PDO.
Kossobokov et al., 2019 On the Diversity of Long-Term Temperature Responses to Varying Levels of Solar Activity at Ten European Observatories … In the present paper, we propose a short but in-depth overview of a very specific topic, i.e., the statistical testing of hypotheses related to solar influence on regional temperature regimes at the time scale of several decades. … These new observations lead us to conclude that the climate in different regions presents different responses to variations in solar activity. Moreover, the distributions of the lower, middle, and higher quartiles of the temperature and pressure indices in solar cycles with high versus low activity are significantly different, providing further robust statistical confirmation to this conclusion (confidence level higher to much higher than 99% using the Kuiper test).
Wu et al., 2019 On the centennial to millennial time scale, the results of wavelet analysis and band‐pass filtering show that the occurrence and development of El Niño have also promoted a weaker EAWM after ~6.0 ka cal. BP, which is inversely correlated with the variation of the ca. 500‐year cycle originated from changes in solar output. These results imply that the climate transition in the mid‐Holocene is caused by the change of variations in solar activity and amplified by ocean circulation El Niño‐Southern Oscillation to influence the East Asian Monsoon system, especially the EAWM, and finally change the vegetation in Great Khingan Mountain Range.
(press release) Lead scientist Dr Wu Jing, from the Key Laboratory of Cenozoic Geology and Environment at the Institute of Geology and Geophysics, part of the Chinese Academy of Sciences, said the study had found no evidence of human influence on northern China’s warming winters. … The study found that winds from Arctic Siberia have been growing weaker, the conifer tree line has been retreating north, and there has been a steady rise in biodiversity in a general warming trend that continues today. It appears to have little to do with the increase in greenhouse gases which began with the industrial revolution, according to the researchers. As a result of the research findings, Wu said she was now more worried about cooling than warming.
Wang et al., 2019 Here we present the first high-resolution stable isotope (δ13C and δ18O) speleothem record from northern Laos spanning the Common Era (∼50 BCE to 1880 CE). The δ13C record reveals substantial centennialscale fluctuations primarily driven by local water balance. Notably, the driest period at our site occurred from ∼1280 to 1430 CE, during the time of the Angkor droughts, supporting previous findings that this megadrought likely impacted much of Mainland Southeast Asia. In contrast, variations in stalagmite δ18O reflect changes in rainfall upstream from our study site. Interestingly, the δ18O record exhibits a positive correlation with solar activity that persists after 1200 CE, contrary to the findings in previous studies. Solar-forced climate model simulations reveal that these δ18O variations may be driven by solar-forced changes in upstream rainout over the tropical Indian Ocean, which modify the δ18O of moisture transported to our study site without necessarily affecting local rainfall amount. We conclude that future rainfall changes in Mainland Southeast Asia are likely to be superimposed on multi-decadal to centennial-scale variations in background climate driven primarily by internal climate variability, whereas solar forcing may impact upstream rainout over the Indian Ocean.
Misios et al., 2019 The Pacific Walker Circulation (PWC) fluctuates on interannual and multidecadal timescales under the influence of internal variability and external forcings. Here, we provide observational evidence that the 11-y solar cycle (SC) affects the PWC on decadal timescales. We observe a robust reduction of east–west sea-level pressure gradients over the Indo-Pacific Ocean during solar maxima and the following 1–2 y. This reduction is associated with westerly wind anomalies at the surface and throughout the equatorial troposphere in the western/central Pacific paired with an eastward shift of convective precipitation that brings more rainfall to the central Pacific. We show that this is initiated by a thermodynamical response of the global hydrological cycle to surface warming, further amplified by atmosphere–ocean coupling, leading to larger positive ocean temperature anomalies in the equatorial Pacific than expected from simple radiative forcing considerations. The observed solar modulation of the PWC is supported by a set of coupled ocean–atmosphere climate model simulations forced only by SC irradiance variations. We highlight the importance of a muted hydrology mechanism that acts to weaken the PWC. Demonstration of this mechanism acting on the 11-y SC timescale adds confidence in model predictions that the same mechanism also weakens the PWC under increasing greenhouse gas forcing.
Bhargawa and Singh, 2019 Since the Sun is the main source of energy for our planet therefore even a slight change in its output energy can make a huge difference in the climatic conditions of the terrestrial environment. The rate of energy coming from the Sun (solar irradiance) might affect our climate directly by changing the rate of solar heating of the Earth and the atmosphere and indirectly by changing the cloud forming processes. … In our investigation, we have observed that the impact of solar irradiance on the global surface temperature level in next decade will increase by ∼4.7% while the global mean sea level will increase about 0.67%. In the meantime, we have noticed about 5.3% decrement in the global sea-ice extent for the next decade. In case of the global precipitation anomaly we have not observed any particular trend just because of the variable climatic conditions. We also have studied the effect of CO2 as anthropogenic forcing where we have observed that the global temperature in the next decade will increase by 2.7%; mean sea level will increase by 6.4%. Increasing abundance in CO2 will be responsible for about 0.43% decrease in the sea-ice extent while there will not be any change in the precipitation pattern.
Zaffar et al., 2019 This study shows that every value of El Nino-southern oscillation (ENSO) Cycles and Sunspot Cycles are strongly correlated to preceding values in both the self-similar and self-affine cases. Unit root test is applied to the tail parameter and the strength of long range-correlation of El Nino-southern oscillation (ENSO) and Sunspot Cycles confirms stationary behavior of the parameters. The variation of earth climatic has a strong influence in Sunspots Cycles and El Nino-southern oscillation (ENSO) Cycles. Sunspots and El Nino-southern oscillation (ENSO) have strong correlation with each other (Asma et al. 2018). The El Nino-southern oscillation (ENSO) cycles influence on the variation of the parameter of local climate which depends on the changes in solar activity.
Maliniemi et al., 2019 Here we study how December to February climate is affected by two solar‐related drivers, geomagnetic activity (proxy of particle precipitation) and sunspot activity (proxy of solar UV) during 1948‐2017. … Geomagnetic activity produces a strengthening of the polar vortex and a negative poleward SLP gradient between mid‐ and high latitudes, resembling a positive NAO‐type circulation pattern during December to February. Solar UV produces a positive U anomaly in the low‐latitude stratosphere during December, which moves poleward and downward during the winter resulting a negative poleward SLP gradient between mid‐ and high latitudes during February. We find the lagged sunspot activity responses in SLP to form zonal pressure patterns (wave‐train structure) resembling the Eurasian pattern. Geomagnetic activity responses remain essentially the same when we introduce the lag with respect to sunspot activity supporting its independency as a driving mechanism. Our results suggest that solar wind related particle precipitation and (lagged) solar UV mechanism provide independent, significant circulation signals in the North Atlantic winter.
Sun et al., 2019 The results show that the hydroclimate was generally humid during 7.57–4.65 cal ka BP, and that subsequently it became relatively dry during 4.65–1.37 cal ka BP. Our results also reveal that the centennial scale variability of the lake level during the Holocene is forced by changes in solar activity and oceanic–atmospheric feedback.
Feng et al., 2019 The wavelet and Redfit analyses of δ18O showed 97, 61, and 35 a signals in the 8.0–7.0 ka BP period, which were similar to the Gleissberg solar and the AMOC cycles. Among these, the 61 a cycle was the most significant. Combined with paleoclimatic geological records, the sea level rose after 8.0 ka BP due to the large-scale melting of ice sheets in the high latitudes of the Northern Hemisphere. The intensity of solar activity has gradually become the main driving mechanism of climate change in the Northern Hemisphere. In addition, the meridional overturning circulation anomaly of seawater in high latitudes and the movement of ITCZ between the Northern and Southern Hemispheres in low latitudes will amplify the impact of solar activity on the climate system, thereby triggering anomalies in the Northern Hemisphere monsoon circulation such as the ‘7.2 ka event’.
Han et al., 2019 The wavelet and RQA analyses of dust activity records from both the TB and Greenland areas indicate similar system changes and a possible control of solar activity on dust activity in both areas. … Steepening of the latitudinal temperature gradient caused by the combined effects of the longterm decrease/ increase in Arctic summer/mid-latitude winter insolation and a change in solar activity is suggested as an important factor driving the transition of the environmental system at ~4.4 kyr BP with full establishment of an unstable new system after 3.5 kyr BP that is characterized by dust storms outbreak in central Asia. Increased low level wind intensity and a delayed seasonal jet transition, resulting from intensification and a southward shift of the westerly jet during cold periods, were key in keeping central Asia in conditions favoring an increase in dust activity.
Ding et al., 2019 [T]he climate of 8.3~4.2 ka BP is moderately warm and humid, 4.2~2.3 ka BP is dry and cold, the climate has warmed since 2.3 ka BP, and the significant climate cycle of 238 a indicates that solar activity has an important impact on regional climate since the Holocene. Using the benthic foraminifera δ 18 O, Mg/Ca value, magnetic susceptibility, Al/Ti, Ba/Ti, etc., the 3-4, 7.2, and 6.2 ka three-time cooling events were identified in the Middle Holocene , with a range of 200 a. The cycle is most pronounced, presumably related to solar activity.
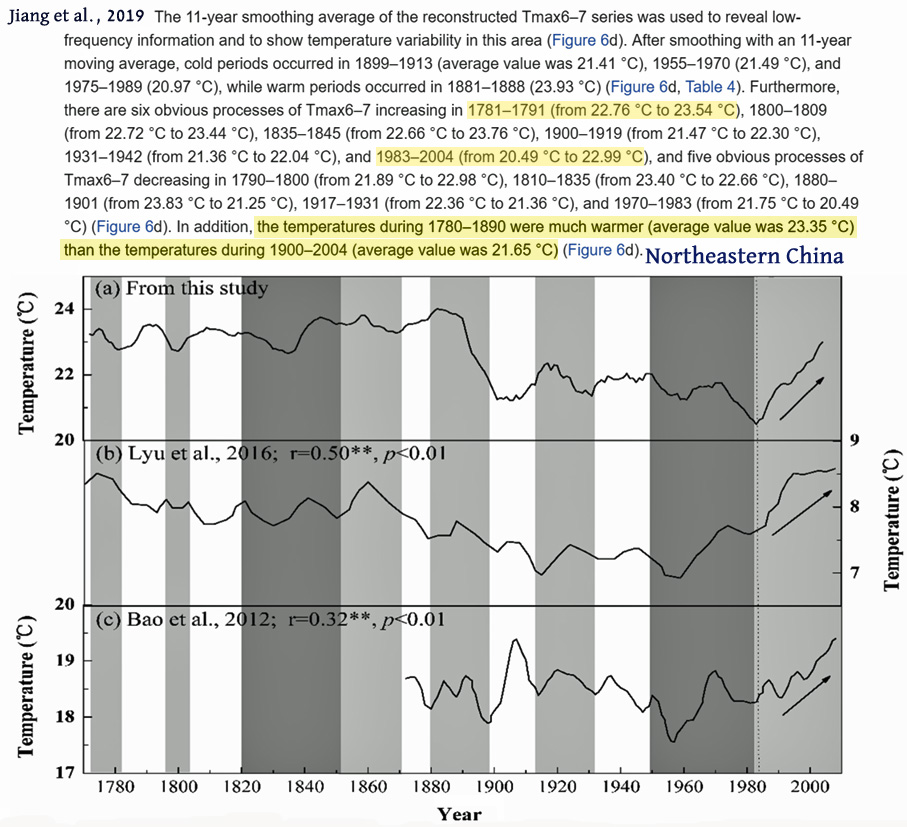
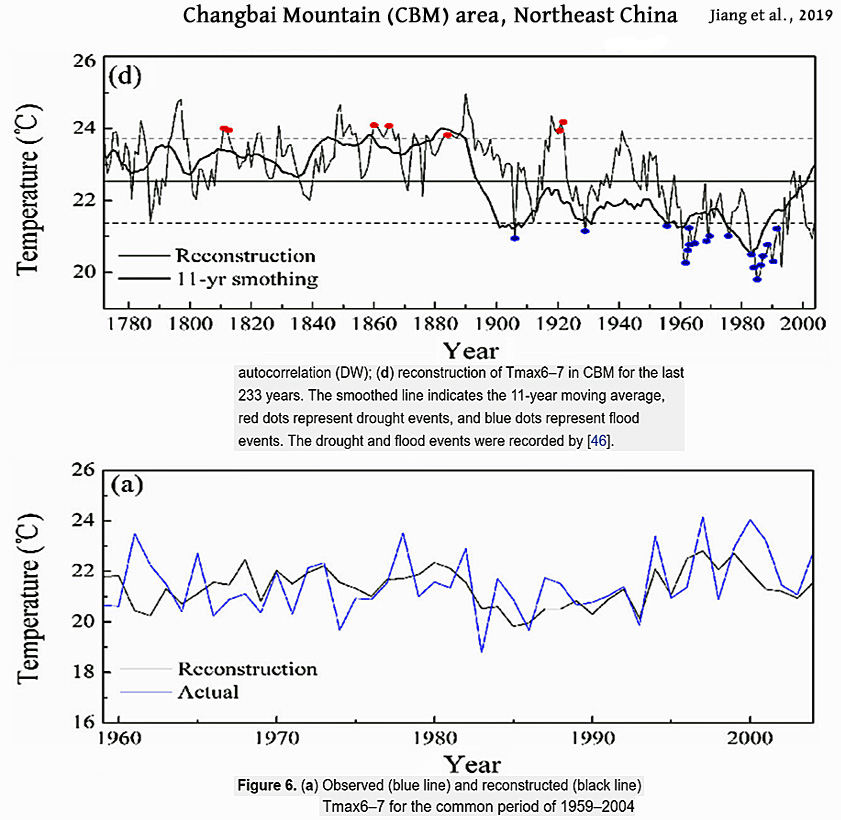
Jiang et al., 2019 In this study, ring-width chronology of Picea jezoensis var. microsperma from the Changbai Mountain (CBM) area, Northeast China, was constructed. … The reconstructed temperature series corresponded to the historical disaster records of extreme climatic events (e.g., drought and flood disasters) in this area. … It is widely believed that the climate will get colder in periods of less solar activity (e.g., the “Little Ice Age” during AD 1450 and 1850), while in a period of intense solar activity, the climate will become warmer (e.g., the warm period of the Middle Ages during AD 1000 and 1400). … [M]ulti-taper method spectral analysis indicated the existence of significant periodicities in the reconstructed series. The significant spatial correlations between the reconstructed temperature series and the El Niño–Southern Oscillation (ENSO), solar activity, and Pacific Decadal Oscillation (PDO) suggested that the temperature in the CBM area indicated both local-regional climate signals and global-scale climate changes. … The 11-year smoothing average of the reconstructed Tmax6–7 series was used to reveal low-frequency information and to show temperature variability in this area. After smoothing with an 11-year moving average, cold periods occurred in 1899–1913 (average value was 21.41 °C), 1955–1970 (21.49 °C), and 1975–1989 (20.97 °C), while warm periods occurred in 1881–1888 (23.93 °C). Furthermore, there are six obvious processes of Tmax6–7 increasing in 1781–1791 (from 22.76 °C to 23.54 °C), 1800–1809 (from 22.72 °C to 23.44 °C), 1835–1845 (from 22.66 °C to 23.76 °C), 1900–1919 (from 21.47 °C to 22.30 °C), 1931–1942 (from 21.36 °C to 22.04 °C), and 1983–2004 (from 20.49 °C to 22.99 °C), and five obvious processes of Tmax6–7 decreasing in 1790–1800 (from 21.89 °C to 22.98 °C), 1810–1835 (from 23.40 °C to 22.66 °C), 1880–1901 (from 23.83 °C to 21.25 °C), 1917–1931 (from 22.36 °C to 21.36 °C), and 1970–1983 (from 21.75 °C to 20.49 °C). In addition, the temperatures during 1780–1890 were much warmer (average value was 23.35 °C) than the temperatures during 1900–2004 (average value was 21.65 °C).
Moreno et al., 2019 Spectral and wavelet transform coherence analyses were used to detect solar footprints on foraminiferal and climate-related time series. A main significant quasi-periodicity was identified within the range of the secular Gleissberg cycle of solar activity modulating the annual NAO and regional spring-summer (simulated) temperatures after AD 1700. This stronger solar-climate coupling may be related to the known upward secular trend in the total solar irradiance after the Maunder Minimum.
Zhao et al., 2019 TSI provides nearly 99.96% of the energy driving Earth climate and its 0.15% variation has a great influence (Kren 2015). Moreover, not only does TSI vary by about 0.01%, caused by the several-minutes-long continuous change from the solar convection zone to the photosphere, it also varies by about 0.3% over 300 years (Eddy 1976). Besides TSI, solar wind is another solar activity, which consists of three types based on the different velocity, extremely high-velocity (v≥725 km/s), high-velocity (450≤v<725 km/s) and low-velocity (v<450 km/s) wind. While TSI is an important observable factor in solar activity variation, a lot of weather and climate models attempt to attribute it as a physically important factor when trying to understand whether and how the Sun has an impact on the Earth’s weather and climate (Scafetta 2010; Coddington et al. 2016). Beyond the widely known quasi 11-year and century periods, Mendoza (2005) concluded that the TSI fluctuations on the 5 min range are due to solar oscillations (Fröhlich et al. 1997; Wolff and Hickey 1987), while few days to weeks are dominated by sunspots (Chapman 1987), and faculae can enhance the total flux by 0.08% (Hudson et al. 1982). Apart from the intrinsic longand short-term variations of TSI, the changes of the Earth’s orbital parameter and albedo cause the variations of the solar electromagnetic radiation that arrives at the Earth (Mendoza 2005). The radiation, especially in the UV bands influenced by the short but strong solar activity (e.g., flare, coronal mass ejection), affects the temperature variation that plays a key role in climate change (Smith et al. 1990).
Li et al., 2019 The result obtained by analyzing that quasiperiodicity shows that the main periods of tree ring width and the sunspot number in the same period are basically consistent, and tree ring width has other cycles. This shows that sunspot activity is an important factor affecting tree ring growth, and tree ring width is influenced by other external environments. … The influence of solar activity on climate has attracted much attention as early as the seventeenth century. Solar activity is an important controlling factor of the earth’s climate. It plays a leading role in the earth’s climate change [1]. Many research studies [2–4] have shown that solar activity is closely related to natural environment changes such as temperature and various dust storms, floods, and droughts.
Zherebtsov et al., 2019 We address the solar activity effect on the changes in the temperature of the atmosphere and of the World Ocean. … We revealed the regions, where long-term SST changes are determined mainly by SA [solar activity] variations. … Comparing variations in climate and solar activity reveals great similarity in their behavior on large time scales. In particular, there are reasonable grounds to believe that the periods of cooling and warming (at least, in the previous millennium) were precisely related to the solar activity variations. Over recent 1000 years, climate has undergone the changes that corresponded to the solar activity variations: warming was recorded in the 12–13th centuries, when solar activity was high (“Medieval Climatic Optimum”), and two temperature drops in the Little Ice Age (in the 16–17th centuries) corresponded to long periods of low solar activity (Dalton and Maunder Minima) (Fig. 1). After the Maunder Minimum, solar activity increase has been widely observed. So, the world climate has become warmer during the bulk of this period. … Earlier, the authors (Kirichenko et al., 2014) analyzed the long-term variations in the SST spatial distribution and in geomagnetic activity. As a result, we found a relation between the SST changes and the geomagnetic activity variations. The SST response to geomagnetic effects was established to feature a significant spatial time irregularity and has a regional character. … Based on the complex analysis of the hydro-meteorological observational data and the authors’ model for the solar activity effect on the climate system, we obtained new evidence for the SA [solar activity] effect on the weather-climate characteristics in the troposphere and in the ocean, including the surface air temperature and the ocean surface temperature. … We calculated the temperature vertical profile variations within the troposphere during heliogeophysical disturbances. The troposphere temperature response to individual heliogeophysical disturbances is shown to be accompanied by the temperature field regular change. In the regions of the temperature maximal response to heliogeophysical disturbances in the middle and in the lower troposphere, one observes a significant (up to 15°) temperature increase. … We found the regions, in which long-term variations in the ocean surface temperature are mainly determined by geomagnetic activity variations. Along with this, the wind stress direction variations were revealed to affect the manifestation of the solar-geomagnetic effect on the ocean surface temperature. They lead to a “hiatus” in the relation between the ocean surface temperature and solar activity due to the change in the ocean thermodynamic state because of the vertical mixing increase.
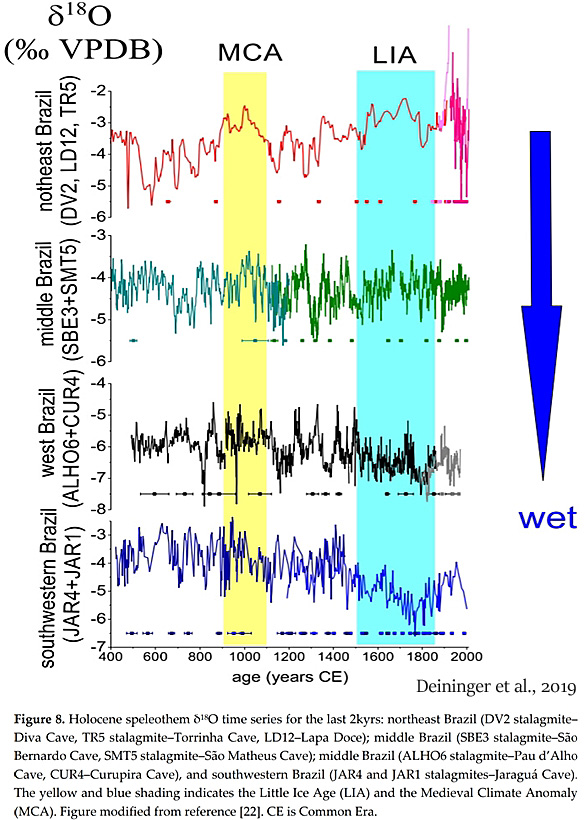
Deininger et al., 2019 A centennial periodicity of the SAMS [South American Monsoon System] (around 210 years) was reported from different sites and is associated with the de Vriess–Suess solar cycle, exhibiting depleted δ18O during periods of high solar irradiance. It is proposed that this relationship is due to several feedbacks involving amplification of solar forcing by coupled air-sea dynamics, cloud formation and stratospheric warming due to enhanced UV absorption through increased stratospheric ozone concentration. … The proposed mechanism driving the Botuverá δ18O record in southeast Brazil is intensification of the SAMS [South American Monsoon System], as driven by increasing austral summertime insolation, suggesting a progressive increase in precipitation amount throughout the Holocene.The main climate features over the last two millennia in South America were forced by NH warm and cold periods during the Medieval Climate Anomaly (MCA) and the Little Ice Age (LIA), respectively. … During the CWP [current warm period], the convective conditions over South America appear to be similar to the MCA [Medieval Climate Anomaly], with warming in the NH leading to a northward positioning of ITCZ and a progressive weakening of the SAMS.
Ball et al., 2019 The solar cycle (SC) stratospheric ozone response is thought to influence surface weather and climate. To understand the chain of processes and ensure climate models adequately represent them, it is important to detect and quantify an accurate SC ozone response from observations. Chemistry climate models (CCMs) and observations display a range of upper stratosphere (1–10 hPa) zonally averaged spatial responses; this and the recommended dataset for comparison remains disputed. Recent data‐merging advancements have led to more robust observational data. Using these data, we show that the observed SC [solar cycle] signal exhibits an upper stratosphere U‐shaped spatial structure with lobes emanating from the tropics (5–10 hPa) to high altitudes at mid‐latitudes (1–3 hPa). We confirm this using two independent CCMs in specified dynamics mode and an idealised timeslice experiment. We recommend the BASICv2 ozone composite to best represent historical upper stratospheric solar variability, and that those based on SBUV alone should not be used.
Kusch et al., 2019 The Holocene climate history of the high-Arctic has largely been driven by the decline in summer insolation (Berger & Loutre 1991; Kaufman et al. 2004) amplified by oceanic and atmospheric feedbacks, most importantly an increased meridional heat and moisture transfer, as well as volcanic forcing (Briner et al. 2016; Kobashi et al. 2017; Lecavalier et al. 2017). Mean summer insolation at 80°N was approximately 50 W m-2 higher during the Early Holocene (Greenlandian) insolation maximum compared to today and resulted in the Early to Middle Holocene thermal maximum (HTM) causing retreat and disappearance of the northern ice sheets except for the Greenland Ice Sheet (Berger & Loutre 1991; Ullman et al. 2015). … Most records, including ice-cores and sedimentary archives, document the HTM between approximately 9 and 5 cal. ka BP with average temperature anomalies of 2.5 to 3.0 °C [higher than today] (Briner et al. 2016) in agreement with climate models (e.g. Renssen et al. 2012).
Ansor et al., 2019 The amount of solar radiation absorbed and reflected determine the rising or declining in Earth’s climate. Generally, Earth’s system absorbs 71% of total incoming solar radiation and 29% is reflected back. When atoms and molecules absorb energy, the matter become excited and moves quickly and randomly and leads to increase in the matter’s temperature. If more energy is absorbed, more particles increase in temperature and eventually Earth’s atmosphere and surface start to warm up. The origin of this result goes back to Sun’s temperature, where, the hotter the Sun is, more solar energy is produced leads to high incoming energy absorbed by Earth. Meanwhile, the temperature of the Sun is based on the presence of sunspots; less sunspot number, [the] hotter the Sun will be. … Overall, this article reviews some evidences from previous studies and we present solar activity data throughout 2017 during solar minimum to prove the possibility of solar radiation emitted by solar flares and coronal mass ejections in changing Earth’s climate pattern. By gathering the data records, we believe climate change is contributed by the variability of solar activity, in which, solar minimum results in high solar radiation produced and received by the Earth. Hence, less amount of energy absorbed results in low of the Earth’s temperature.
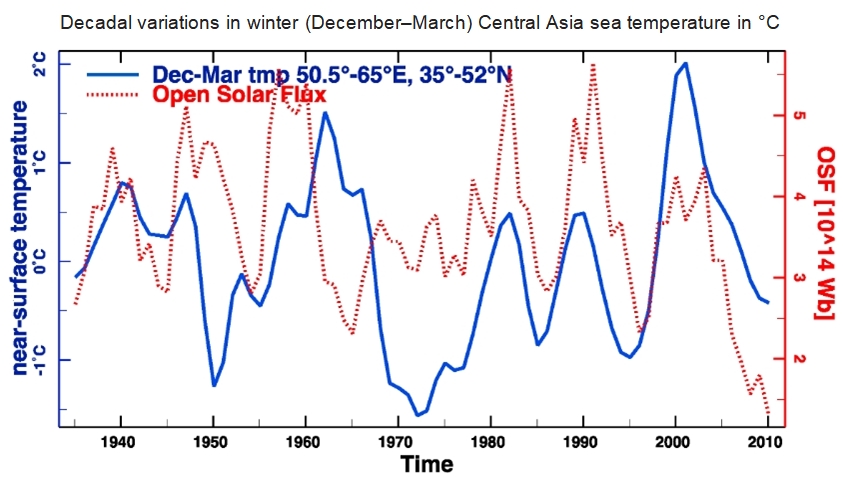
Yan et al., 2019 We contend that solar activity and the westerlies were the dominant influences on ACA [arid central Asia] hydroclimatic variations during the period of record [the last 160 years]: (1) solar activity dominates regional temperature variations, precipitation/evaporation, and the advance/retreat of glaciers; (2) stronger westerly intensity (corresponding to higher westerly index and higher North Atlantic Oscillation (NAO) index) brings more water vapor from the west to ACA [arid central Asia], and vice versa; and (3) the southerly migration of the westerly jet stream, which is closely related to lower TSI and temperatures, could favor more water vapor transported to ACA areas, and vice versa.
Nitka and Burnecki, 2019 In this paper we analyze the relationship between the sunspot numbers and the average monthly precipitation measured at meteorological stations in the US. The results indicate that there is a significant correlation between the solar activity and the monthly average precipitation data for selected months and time delays.
Huang et al., 2019 [T]hese events are synchronous with periods of weak solar activity, and the spectral analysis demonstrates that the EASM and solar activity share some general cyclicity patterns. We therefore suggest that solar activity is a fundamental driving force for the spatial synchronisation of the EASM [East Asian Summer Monsoon] on centennial timescales across the monsoon region. … The sun-monsoon link can be explained by a direct solar influence on the land–sea thermal contrast that controls the monsoonal precipitation (Liu et al., 2009; Xu et al., 2015). When the land–sea thermal contrast reduces, the subsequent gradual southward migration of the Intertropical Convergence Zone (ITCZ) may lead to reduced transportation of water vapor from the ocean to the continents, thereby causing less rainfall in monsoonal Asia (Dykoski et al., 2005; Fleitmann et al., 2003; Li et al., 2017b). In general, weak solar activity triggers decreased land–sea thermal contrast, and thereafter would result in reductions in the EASM intensity. Alternately, solar output could influence the variability of the EASM indirectly, perhaps amplified by the North Atlantic teleconnection (Wang et al., 2005, 2016).
Liu et al., 2019 Notably, an overall in‐phase relationship is observed between the hydroclimatic variations and change in solar activity, and the results of spectral analysis suggest the presence of the Eddy (~1080 yr), de Vries (~205 yr) and Gleissberg (~88‐102 yrs) cycles. This indicates a linkage between solar activity and hydroclimatic changes in ACA [arid Central Asia] on centennial‐ to multi‐decadal scales during the Holocene. We suggest that the influence of solar activity on hydroclimatic changes in ACA [arid Central Asia] occurs via its effects on North Atlantic sea surface temperature (SST), North Atlantic Oscillation (NAO), northern high‐latitude regional temperatures, and via direct heating. The relationship suggests that solar activity may play an important role in determining future hydroclimatic changes in ACA [arid Central Asia].
Banerji et al., 2019 The present study demonstrates vacillating climate with strengthened ISM [Indian Summer Monsoon] during Roman Warm Period and Medieval Warm Period (2000−950 cal yr BP) as a result of increased solar irradiance interrupted by reduced ISM during Dark Ages of Cold Period (∼1500 cal yr BP). The plausible occurrence of volcanic eruption before the onset of Little Ice Age (500−200 cal yr BP) resulted the southward migration of ITCZ leading to enhanced western disturbances in the study area thereby causing cool and wet climate. The study also emphasis the increased El Nino events with gradual decline in the ISM since LIA. Further, the study underscores a climate warming during last two centuries which corroborated well with the instrumental records. Thus, the present study has implication towards understanding the significant role of volcanic activity and solar variability in controlling the millennia scale climate oscillations with additional feedback mechanisms.
Cho et al., 2019 [T]he EASM [East Asian Summer Monsoon] was weak during the LIA, and the amount of precipitation was lower than in other periods. ENSO is strongly related to sea surface temperature (SST) in the Pacific Ocean (Schwing et al., 2002; Marchitto et al., 2010). This SST is also affected by solar activity. Marchitto et al. (2010) showed that proxy-based SST records based on Mg/Ca ratio correlated with the generation of cosmogenic nuclides 14C and 10Be. Therefore low solar activity is correlated with El Niño-like conditions (Marchitto et al., 2010). Japan has a complicated climate system, but it is one that is closely related to solar insolation. The climate of Japan over the last 1000 years has undergone significant variation. The LIA was in place for about 650 years from 1300–1950 CE (Matthews and Briffa, 2005). Before the LIA, the Medieval Solar Maximum occurred from 1100 CE–1250 (Jirikowic and Damon, 1994). During the LIA, El Niño was strong, and typhoons during El Niño years tended to recurve to the northeast (Wang and Chan, 2002), which may increase the likelihood of typhoons making landfall in Japan (Elsner and Liu, 2003).
Le Mouël et al, 2019 We first apply singular spectrum analysis (SSA) to the international sunspot number (ISSN; 1849‐2015) and the count of polar faculae (PF; 1906‐2006). The SSA method finds 22, 11 and 5.5‐year components as the first eigenvectors of these solar activity proxies. We next apply SSA to the ten Madden‐Julian oscillation (MJO; 1978‐2016) indices. The first, most intense component SSA finds in all MJO indices has either a period of 5.5 or 11 years. The longer‐term modulation of amplitude is on the order of one third of the total variation. The 5.5‐year SSA component 1 of most MJO indices moreover follows the decreasing amplitude of solar cycles. We then apply SSA to climate indices PDO, ENSO, WPO, AAO, AMO, TSA, WHWP, and Brazil and Sahel rainfalls. We find that the first SSA eigenvectors are all combinations of rather pure 11, 5.5 and 3.6‐year pseudo‐cycles. The 5.5‐year component is frequently observed and is particularly important and sharp in the series in which it appears. All these periods have long been attributed to solar activity, and this by itself argues for the existence of a strong link between solar activity and climate. The mechanisms of coupling must be complex and probably non‐linear but they remain to be fully understood (UV radiation, solar wind and galactic cosmic rays being the most promising candidates). We propose as a first step a Kuramoto model of non‐linear coupling that generates phase variations compatible with the observed ones.
Fang et al., 2019 An astronomically forced cooling event during the Middle Ordovician … Onset and termination of a cooling event in the Middle Ordovician were dated. Obliquity forcing dominated this cooling event. 1.2 Myr obliquity modulation cycles controlled the third-order eustatic sequences. Onset and termination of cooling event were controlled by astronomical forcing.
Jia and Liu, 2019 Here, we present well-dated Xray fluorescence scanning records retrieved from a varved sediment core from Lake Kusai. These records show the decadal- to-centennial-scale paleoclimatic variability of the northern Qinghai-Tibetan Plateau over the last 2000 yr. Ca is mainly related to the precipitation of authigenic carbonates and is a proxy for temperature changes. The Ca record of Lake Kusai is well-correlated with the variations and periodicities of solar activity. Therefore, solar output can be suggested as being the predominant forcing mechanism of decadal- to centennial-scale temperature fluctuations over the last 2000 yr.
Jin et al., 2019 For the four-member ensemble averaged solar-only forcing experiment, the summer mean precipitation over northern EA is significantly correlated with the solar forcing (r 5 0.414, n 5 68, p, 0.05) on a decadal time scale during the strong cycle epoch, whereas there is no statistical link between the EASM and solar activity during the weak cycle epoch (r 5 0.002, n 5 24). A strong, 11-yr solar cycle is also shown to excite an anomalous sea surface temperature (SST) pattern that resembles a cool Pacific decadal oscillation (PDO) phase, which has a significant 11-yr periodicity. The associated anomalous North Pacific anticyclone dominates the entire extratropical North Pacific and enhances the southerly monsoon over EA, which results in abundant rainfall over northern EA. We argue that the 11-yr solar cycle affects the EASM decadal variation through excitation of a coupled decadal mode in the Asia–North Pacific region.
Liu et al., 2019 The regional May–July PDSI (PDSI5−7) from the CW-DHM was reconstructed from 1825 to 2013 AD. The ensemble empirical mode decomposition method (EEMD) and multi-taper method (MTM) spectral analyses revealed that the cycles in the reconstructed PDSI5−7 were close to those of the ENSO and solar activity. This suggests that both the ENSO and solar activity have strong influence on the PDSI5−7 [drought] variation in the CW-DHM region. In addition, EEMD also revealed that the Pacific decadal oscillation and the Atlantic multi-decadal oscillation influenced the drought variation in this region. The PDSI5−7 reconstruction showed a long-term declining (dry) trend during the period of the 1950s–2010s. This drying trend was also detected in the PDSI data of other parts of China after the 1950s. We believe that these phenomena may be related to a large extent with the weakening of the East Asian summer monsoon.
Gao et a., 2019 At the centennial scale, the penguin population recorded in core RNL decreased from ~1120–860 yr BP, reached a peak from ~860–630 yr BP, remained at a low level from ~630–320 yr BP, and then increased with large fluctuations during the past ~400 years. These changes are all in-phase with the trend of solar irradiance. At the decadal scale, penguin population minima correspond to solar minima from ~490–400 yr BP (Spörer minimum), ~290–220 yr BP (Maunder minimum), and from ~160–120 yr BP (Dalton minimum; whereas population maxima correspond to solar maxima from ~1030–980 yr BP, ~350–290 yr BP, ~210–160 yr BP, ~120–70 yr BP. The population recorded in core RL exhibited the same changes as in RNL during the last 480 years. The reconstructed krill abundance also corresponds to these trends when data are available. This correspondence demonstrates a food-chain mechanism that is related to solar activity and light availability at the ocean surface, which influence the intensity of photosynthesis and phytoplankton productivity, and thus the abundance of krill and apex predators such as penguins. Our findings highlight the fact that despite the various climatic impacts on penguin populations, their effects on the base of the food chain are usually the direct drive. … In summary, changes in solar irradiance control the energy input to the ecosystem, which influences the phytoplankton biomass in the penguin foraging area; in turn, this leads to changes in krill abundance and thus penguin food availability, which has a significant impact on the development of the penguin population.
Goslin et al., 2019 Here we present a reconstruction of westerly storminess in western Denmark between 4840 and 2300 yrs. cal. B·P. Past-storminess is retrieved from an organic-rich sedimentary succession by combining markers of aeolian sand influx, μ-XRF geochemistry and plant macrofossils. Particular focus is paid to the c. 4840–4350 yrs. cal. B·P. period for which our record is characterized by a pluri-annual resolution. We evidence concurrent pluri-decadal shifts in storminess and humidity regime at our site that we interpret as relocations of the mean westerly storm-track over the North-Atlantic. The signal is dominated by ≈ 90, ≈ 50–80 and ≈ 35-yr periods, evoking possible links with solar activity, the North-Atlantic Oscillation (NAO), the Atlantic Multidecadal oscillation (AMO) and the Atlantic Meridional Overturning Circulation (AMOC) modes of variability, respectively. The ≈ 35-yr periodicity found in our record is especially strong and stationary, suggesting that storminess could have been closely linked with the AMOC over the study period.
Prikryl et al., 2019 Rapid intensification of tropical storms tends to follow arrivals of high-speed solar wind. Convective bursts have been linked to rapid intensification of tropical cyclones. Cases of tropical cyclone intensification closely correlated with the solar wind structure are found to be preceded by atmospheric gravity waves generated by the solar wind magnetosphere-ionosphere-atmosphere coupling process.
Constantine et al., 2019 The records indicate that climate deteriorations around 6400 cal yr BP and 4000 cal yr BP caused rapid vegetation changes in the study area, which were presumably attributable to low sunspot activity and strong El Niño–like conditions, respectively. These two cooling events were likely modulated by different climate mechanisms, as El Niño–Southern Oscillation activity began to strengthen around 5000 cal yr BP. These events may have had a substantial impact on ancient societies in the study area. Combining our results with archaeological findings indicated that climate deterioration led to drastic declines in local populations around 6400 cal yr BP, 4400 cal yr BP, and 4000 cal yr BP. Because of its high population, coastal East Asia (e.g., eastern China, Japan, and Korea) is particularly vulnerable to potential cooling events in the future.
Lucas, 2019 A solar minimum period begins when sunspot activity decreases. Solar cycles can last for periods ranging from as short as seven to eleven years, or as long as 400 years (Popova, et al. 2017). The solar minimum is caused when the sun’s magnetic field weakens, causing a decrease in solar material, called the solar wind. The sun’s magnetic field, known as a magnetic shield, “deflects low-energy cosmic rays” from reaching the Earth (Tomassetti et al. 2017). When solar activity is high, at a solar peak, solar wind is low, with less cosmic radiation reaching the Earth. During the sun’s solar minimum, the magnetic field protecting the Earth is weakened and Earth receives more cosmic radiation. The result for civilizations on Earth is unpredictable swings in the climate appearing “simultaneously with other markers of social change” (Nelson & Khalifa, 2010). … There is climatologic evidence of solar cycle peak and trough in global temperatures as noted in climatic studies of solar isotopes (Usoskin 2008). During solar maximums we would expect to see evidence of the rise of civilizations when the climate is warmer, and evidence of civilization collapse during solar minimums as the climate turns colder and geologic instability follows.
Laurenz et al., 2019 Results show that February precipitation in Central and Western Europe yields the strongest solar response with coefficients reaching up to +0.61. Rainfall in June–July is equally co-driven by solar activity changes, whereby the solar-influenced zone of rainfall shifts from the British Isles towards Eastern Europe during the course of summer. … The literature review demonstrates that most multidecadal studies from Central Europe encountered a negative correlation between solar activity and rainfall, probably because short time lags of a few years are negligible on timescales beyond the 11 year solar Schwabe cycle. Flood frequency typically increases during times of low solar activity associated with NAO- conditions and -more frequent blocking.
Miyake et al., 2019 New quasi-annual beryllium-10 measurements were made with the Dome Fuji ice core from Antarctica over the period in which the 994 cosmic ray event would be expected. We observed an approximately 50% increase in beryllium-10 concentrations, which is consistent with the beryllium-10 increases observed in the Greenland ice cores. This lends support to a solar origin of the 994 event.
Kushnir and Stein, 2019 Medieval Climate in the Eastern Mediterranean: Instability and Evidence of Solar Forcing … The Nile summer flood levels were particularly low during the 10th and 11th centuries, as is also recorded in a large number of historical chronicles that described a large cluster of droughts that led to dire human strife associated with famine, pestilence and conflict. During that time droughts and cold spells also affected the northeastern Middle East, in Persia and Mesopotamia. Seeking an explanation for the pronounced aridity and human consequences across the entire EM, we note that the 10th–11th century events coincide with the medieval Oort Grand Solar Minimum, which came at the height of an interval of relatively high solar irradiance. Bringing together other tropical and Northern Hemisphere paleoclimatic evidence, we argue for the role of long-term variations in solar irradiance in shaping the early MCA in the EM and highlight their relevance to the present and near-term future.
Audu and Okeke, 2019 Sunspot number, aa index, galactic cosmic rays (GCRs), rainfall and maximum temperature data were used in this study. The time period under investigation in this study spanned for 63 years (1950–2012). Spearman’s rank correlation technique was employed in analyzing the data. Results reveal that sunspot number and aa index varied in the opposite direction with GCRs based on the 11-year solar cycle. This inverse relationship was confirmed from the correlation analysis. This depicts that solar and geomagnetic activities modulate cosmic rays penetrating into the Earth’s atmosphere. … [T]he variations of cloud covers with rainfall and temperature show that changes in cloud covers are associated with changes in rainfall and temperature. This study has given useful information on the possible links by which solar activity could influence climate change. … According to Kitaba et al. [22], geomagnetic activity influenced the global climate through the modulation of cosmic rays flux. Palamara [19], found out that solar-modulated geomagnetic activity is an important forcing mechanism for the recent climate change. … The pathway proposed for solar—climate interaction in this study is: solar activity/geomagnetic activity → GCRs → cloud cover → climatic parameters.
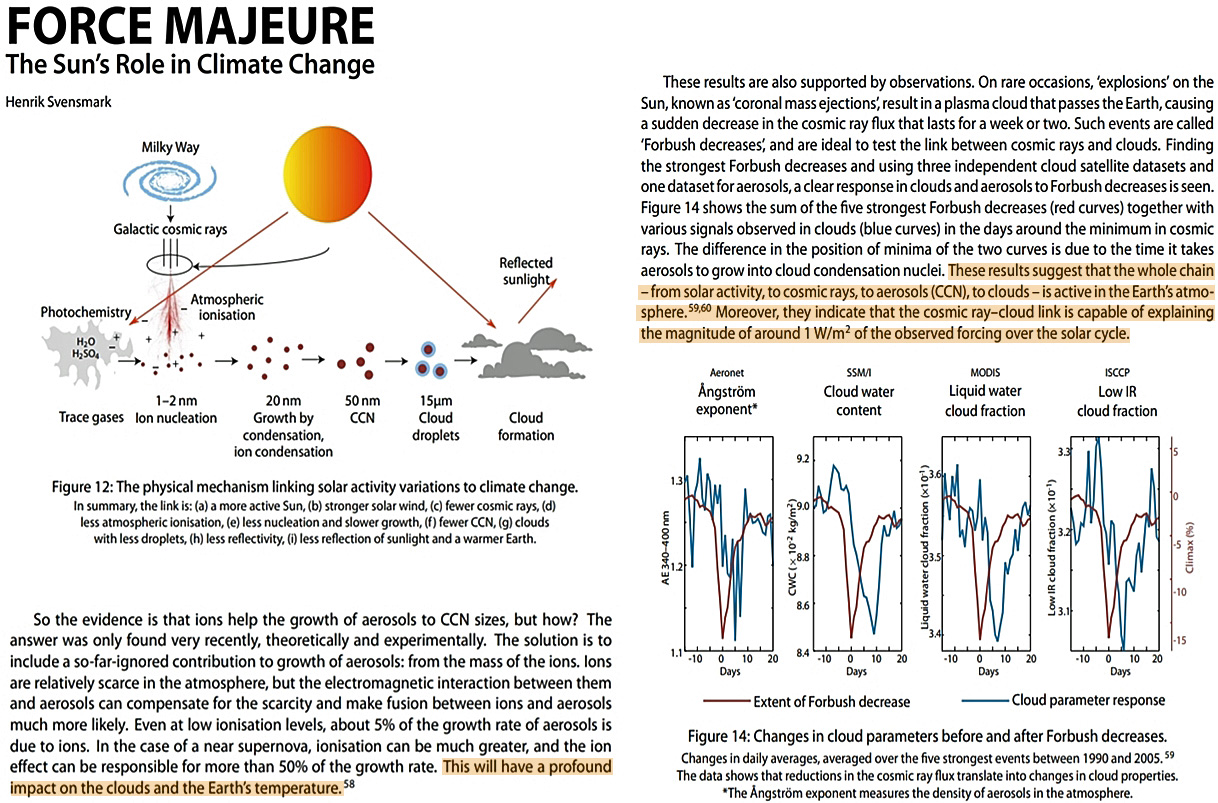
Svensmark, 2019 These results are also supported by observations. On rare occasions, ‘explosions’ on the Sun, known as ‘coronal mass ejections’, result in a plasma cloud that passes the Earth, causing a sudden decrease in the cosmic ray flux that lasts for a week or two. Such events are called ‘Forbush decreases’, and are ideal to test the link between cosmic rays and clouds. Finding the strongest Forbush decreases and using three independent cloud satellite datasets and one dataset for aerosols, a clear response in clouds and aerosols to Forbush decreases is seen. Figure 14 shows the sum of the five strongest Forbush decreases (red curves) together with various signals observed in clouds (blue curves) in the days around the minimum in cosmic rays. The difference in the position of minima of the two curves is due to the time it takes aerosols to grow into cloud condensation nuclei. These results suggest that the whole chain – from solar activity, to cosmic rays, to aerosols (CCN), to clouds – is active in the Earth’s atmosphere. Moreover, they indicate that the cosmic ray–cloud link is capable of explaining the magnitude of around 1 W/m2 of the observed forcing over the solar cycle.
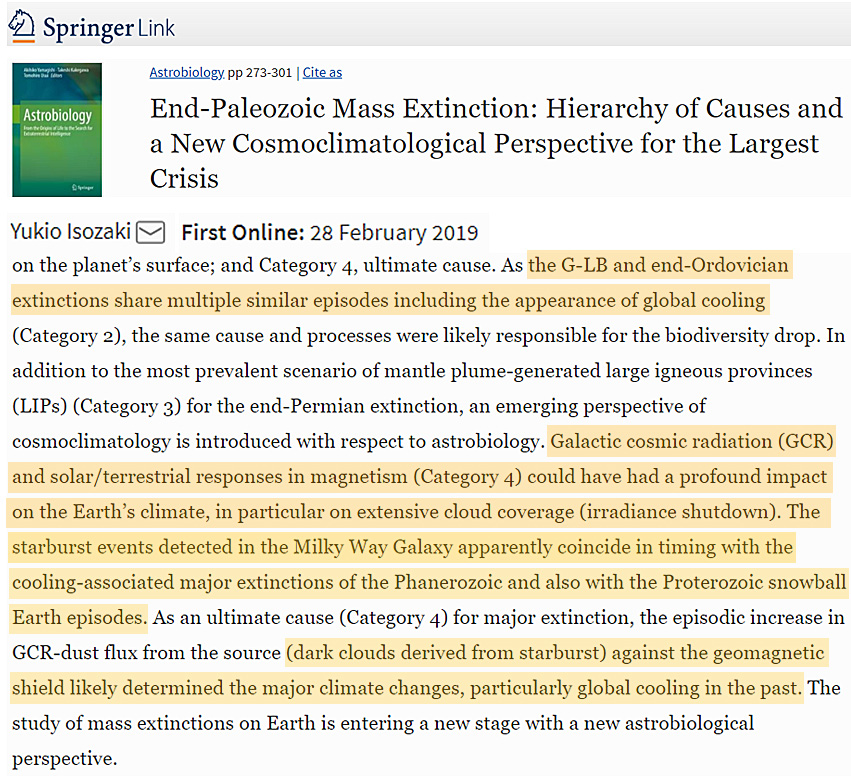
Isozaki, 2019 As the G-LB and end-Ordovician extinctions share multiple similar episodes including the appearance of global cooling (Category 2), the same cause and processes were likely responsible for the biodiversity drop. In addition to the most prevalent scenario of mantle plume-generated large igneous provinces (LIPs) (Category 3) for the end-Permian extinction, an emerging perspective of cosmoclimatology is introduced with respect to astrobiology. Galactic cosmic radiation (GCR) and solar/terrestrial responses in magnetism (Category 4) could have had a profound impact on the Earth’s climate, in particular on extensive cloud coverage (irradiance shutdown). The starburst events detected in the Milky Way Galaxy apparently coincide in timing with the cooling-associated major extinctions of the Phanerozoic and also with the Proterozoic snowball Earth episodes. As an ultimate cause (Category 4) for major extinction, the episodic increase in GCR-dust flux from the source (dark clouds derived from starburst) against the geomagnetic shield likely determined the major climate changes, particularly global cooling in the past. The study of mass extinctions on Earth is entering a new stage with a new astrobiological perspective.
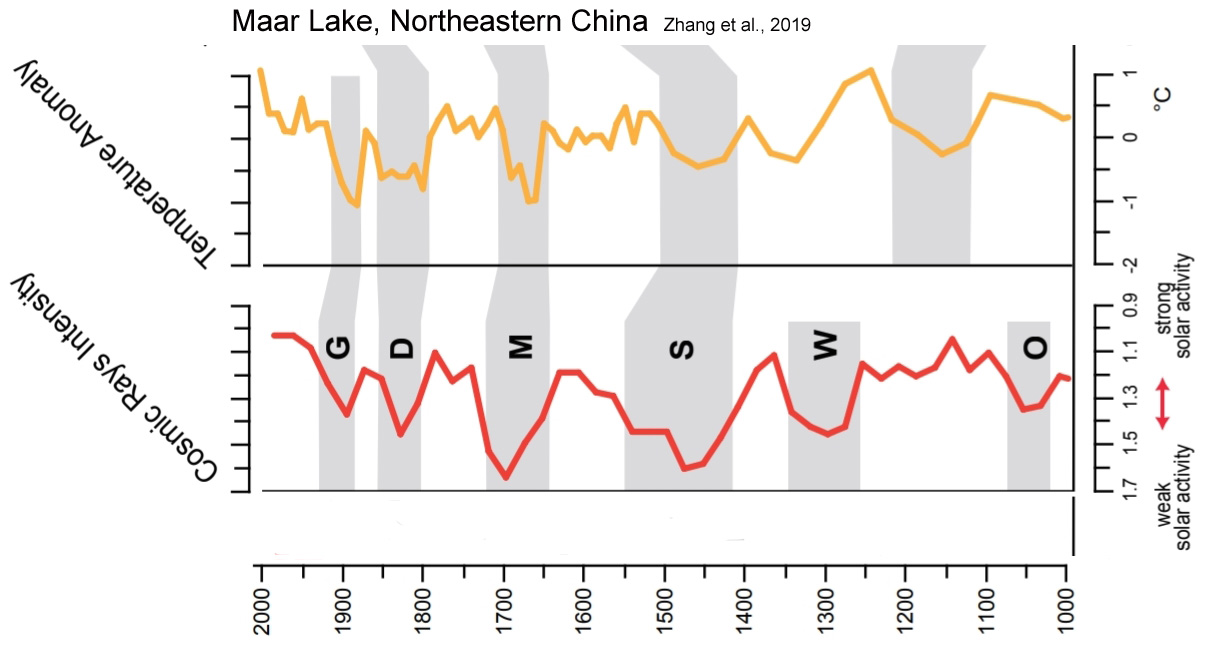
Zhang et al., 2019 Studies of solar activity and cosmic radiation indicate that solar activity is the main factor driving climate change on decadal-to centennial scales (Stuiver and Braziunas, 1993; Xu et al., 2014; Yu and Ito, 1999; Zhao et al., 2010). In addition, solar activity is well correlated with global surface temperature (Bond et al., 2001; Usoskin et al., 2003). Changes in the production rates of two common cosmic radionuclides (∆14C and 10Be), which are preserved in ice cores and tree rings, suggest that periodic fluctuations in solar activity on decadal-to-centennial scales directly affect the cosmic ray flux (Abreu et al., 2013; Masarik and Beer, 1999; Steinhilber et al., 2012). Kirkby (2007) summarized evidence for a close relationship between temperature change and solar activity during the last millennium, finding that cosmic radiation flux was weak and solar activity was strong during the MWP; whereas, the opposite conditions occurred during the LIA. Therefore, the cosmic ray flux can be regarded as a proxy for solar activity and that it can be used to assess the relationship between climate change and solar activity. … Several notable cold periods, with lower Quercus frequencies, occurred at approximately 1200 AD, 1410 AD, 1580 AD, 1770 AD and 1870 AD. These centennial-scale cold periods basically correspond to major minima in solar activity, suggesting that variations in solar activity may have been an important driver of climate and vegetation change in the study area during the last millennium.
Misios et al., 2019 Influences of the 11-y solar cycle (SC) on climate have been speculated, but here we provide robust evidence that the SC affects decadal variability in the tropical Pacific. By analyzing independent observations, we demonstrate a slowdown of the Pacific Walker Circulation (PWC) at SC maximum. We find a muted hydrological cycle at solar maximum that weakens the PWC and this is amplified by a Bjerknes feedback. Given that a similar muted hydrological cycle has been simulated under increased greenhouse gas forcing, our results strengthen confidence in model predictions of a weakened PWC in a warmer climate. The results also suggest that SC forcing is a source of skill for decadal predictions in the Indo-Pacific region.
Ning et al., 2019 The results show that internal climate variability within the coupled climate system plays an essential role in triggering megadroughts, while different external forcings may contribute to persistence and modify the anomaly patterns of megadroughts. … For the mechanisms behind megadroughts over eastern China, circulation anomalies, e.g., Western Pacific subtropical high (WPSH) and Eastern Asia summer monsoon (EASM), are the direct causes of megadroughts, while external forcing, e.g., solar radiation and volcanic eruptions, may influence the regional climate by changing large-scale circulation patterns [33–36]. For example, Shen et al. [37] found that several exceptional droughts over eastern China during the last 500 years may have been triggered by large volcanic eruptions and amplified by both volcanic eruptions and El Niño events. Through model simulations, Peng et al. [38] indicated that solar activity may be the primary driver in the occurrence of several persistent droughts over eastern China, and the influences occurred through EASM weakening.
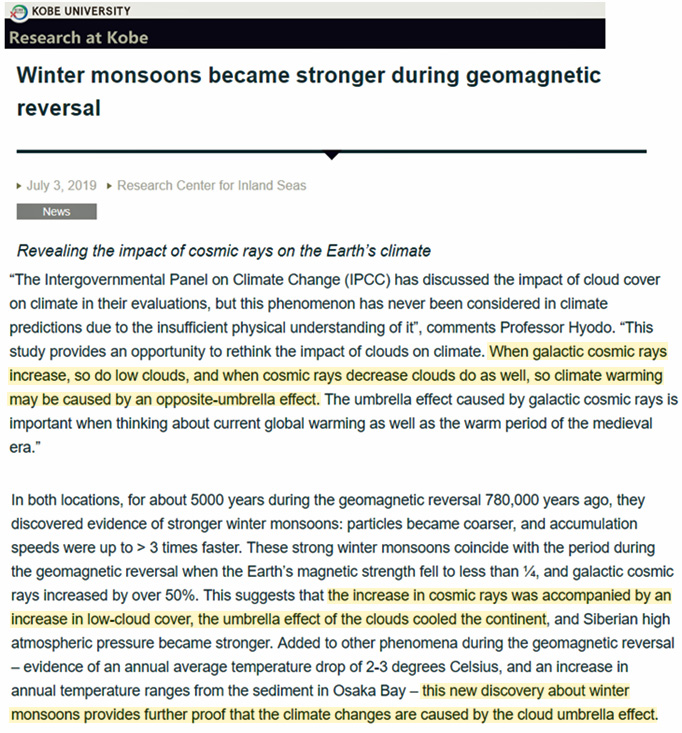
Ueno et al., 2019 The strength of Earth’s magnetic dipole field controls galactic cosmic ray (GCR) flux, and GCR-induced cloud formation can affect climate. Here, we provide the first evidence of the GCR-induced cloud effect on the East-Asian monsoon during the last geomagnetic reversal transition.
press release [D]uring the last geomagnetic reversal transition, when the amount of galactic cosmic rays increased dramatically, there was also a large increase in cloud cover, so it should be possible to detect the impact of cosmic rays on climate at a higher sensitivity. … [F]or about 5000 years during the geomagnetic reversal 780,000 years ago, they discovered evidence of stronger winter monsoons: particles became coarser, and accumulation speeds were up to > 3 times faster. These strong winter monsoons coincide with the period during the geomagnetic reversal when the Earth’s magnetic strength fell to less than ¼, and galactic cosmic rays increased by over 50%. This suggests that the increase in cosmic rays was accompanied by an increase in low-cloud cover, the umbrella effect of the clouds cooled the continent, and Siberian high atmospheric pressure became stronger. Added to other phenomena during the geomagnetic reversal – evidence of an annual average temperature drop of 2-3 degrees Celsius, and an increase in annual temperature ranges from the sediment in Osaka Bay – this new discovery about winter monsoons provides further proof that the climate changes are caused by the cloud umbrella effect.
Skalik and Skalikova, 2019 The global horizontal radiation has been measured for a high number of years at all of these stations. The values show a tendency of increased annual global radiation, most likely due to decreased pollution of the atmosphere, increased duration of periods without clouds and/or combination of both these effects. Twenty years of measurements from a climate station in Lyngby, Denmark show that the global radiation increase is almost 3.5 kWh/m2 per year, corresponding to a growth of 7 % for the last 20 years. The global radiation variation between the least sunny year to the sunniest year is 22%. Twenty-nine years of measuring of global radiation from twelve radiation stations across Sweden shows an increase of 3.1 kWh/m2 per year. The increase is 87 kWh/m2, corresponding to 9 % of global radiation growth during the last 29 years. The annual global radiation varies between 838 kWh/m2/year in 1998 and 1004 kWh/m2/year in 2002 with an average radiation of 932 kWh/m2/year, corresponding to a radiation variation from the least sunny year to the sunniest year of 20 %.
Pokrovsky, 2019 The results of analysis of climatic series of global and regional cloudiness for 1983–2009. Data were obtained in the framework of the international satellite project ISCCP. The technology of statistical time series analysis including smoothing algorithm and wavelet analysis is described. Both methods are intended for the analysis of non-stationary series. The results of the analysis show that both global and regional cloudiness show a decrease of 2–6%. The greatest decrease is observed in the tropics and over the oceans. Over land, the decrease is minimal. The correlation coefficient between the global cloud series on the one hand and the global air and ocean surface temperature series on the other hand reaches values (–0.84) — (–0.86). This means that the inflow of solar radiation in the tropics is increasing faster than the global average, and this growth is more than 1 W/m2. Since the tropics are dominated by water areas, this fact suggests that the increasing influx of solar radiation primarily entails an increase in the temperature of the ocean surface (TPO). Not surprisingly, the cloud cover values themselves and their temporal trends are close to global characteristics. Thus, changes in cloud cover over three decades during global warming can explain not only the linear trend of global temperature, but also some interannual variability. … However, the influence of clouds on climate change cannot be ignored because of the significant contribution of this climate-forming parameter and should be studied more closely to improve climate forecasts.
via NoTricksZone
October 3, 2019 at 09:31AM
