Month: February 2020

Longest-Ever S. Hemisphere Tree-Ring Reconstruction Finds The 1700s-1800s Were Warmer Than Today

A new 5680-year tree-ring temperature reconstruction for southern South America (Lara et al., 2020) reveals (a) no clear warming trend in recent decades, and (b) the 18th and 19th centuries (and many centennial-scale periods from the last 5680 years) had much warmer temperatures than today.

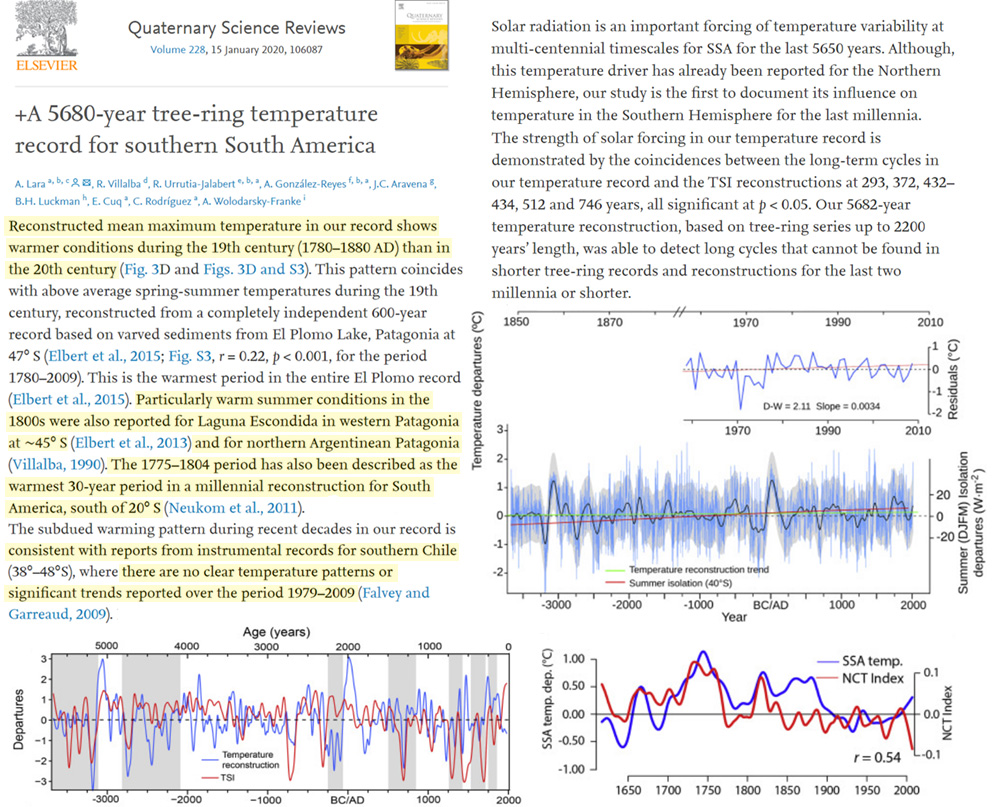
Image Source: Lara et al., 2020

In addition to finding modern temperature changes in southern South America fall well within the range of natural variability in the context of the last 5680 years, Lara et al. (2020) assess solar forcing to have contributed to climate variations for this region of the Southern Hemisphere.

The authors find CO2 fertilization can explain trees’ improved water use efficiency and tree-ring growth in general; this affects the capacity for tree-rings to be a proxy for long-term temperature variability.

They emphasize this composite tree-ring record is “the longest in the Southern Hemisphere.”

Lara et al., 2020

“The most outstanding features in the reconstruction presented here are two major warm periods between 3140–2800 BC and 70 BC – 150 AD (5159–4819 and 2089–1869 years ago, respectively, counted from 2019 to facilitate comparisons with glacier records based on 10Be dated moraines). During these warm periods, no glacier advances have been reported for Patagonia (Aniya, 2013; Kaplan et al., 2016; Strelin et al., 2014, Fig. 5A).”

“Reconstructed mean maximum temperature in our record shows warmer conditions during the 19th century (1780–1880 AD) than in the 20th century (Fig. 3D and Figs. 3D and S3). This pattern coincides with above average spring-summer temperatures during the 19th century, reconstructed from a completely independent 600-year record based on varved sediments from El Plomo Lake, Patagonia at 47° S (Elbert et al., 2015; Fig. S3, r = 0.22, p < 0.001, for the period 1780–2009). This is the warmest period in the entire El Plomo record (Elbert et al., 2015). Particularly warm summer conditions in the 1800s were also reported for Laguna Escondida in western Patagonia at 45° S (Elbert et al., 2013) and for northern Argentinean Patagonia (Villalba, 1990). The 1775–1804 period has also been described as the warmest 30-year period in a millennial reconstruction for South America, south of 20° S (Neukom et al., 2011).”

“The subdued warming pattern during recent decades in our record is consistent with reports from instrumental records for southern Chile (38°–48°S), where there are no clear temperature patterns or significant trends reported over the period 1979–2009 (Falvey and Garreaud, 2009).”

Consistent with the patterns documented in this paper, low frequency reconstructed cold temperature anomalies for the NH and periods of minimal solar activity were variable with periods of coincidences and discrepancies during the last 1200 years (Anchukaitis et al., 2017). Changes in large scale NH circulation are thought to provide a possible mechanism for these differences (Anchukaitis et al., 2017). The two major periods with positive anomalies in our reconstruction (3140–2800 BC and 70 BC-150 AD), coincide with positive anomalies of solar irradiance, but the deviations in the TSI are proportionally smaller in the latter period (Fig. 5A).

A strong CO2 fertilization effect has been the main explanation for the significant increase in water-use efficiency (WUE) reported for Northern Hemisphere temperate and boreal forests over the recent two decades (Keenan et al., 2013).”

“The increasing growth trend and decreasing isotope discrimination in Fitzroya have been attributed to a raise in photosynthetic rates, which has been caused by increased CO2 and/or higher surface radiation, the latter associated with a reduction in cloudiness in a high precipitation area (Urrutia-Jalabert et al., 2015a). In the eastern slope of the northern Patagonian Andes, Argentina, under lower rainfall and cloudiness than in the Chilean western slope, a marked increase in Fitzroya tree-ring growth during the 20th century has also been recorded and attributed to increased CO2 concentration (Lavergne et al., 2018). The coincident Fitzroya growth patterns in two areas of contrasting cloud cover is an additional support for the attribution of CO2 fertilization in this species.”

For good measure, Lara et al., (2020) point out that “a cooling trend has been reported along the Pacific coast (17° – 37° S) of South America for the periods 1979–2006 and 1981–2012 (Falvey and Garreaud, 2009; Hartmann et al., 2013).

This cooling record is consistent with instrumental records from the dozens of temperature stations all across the central and southern regions of South America which also show cooling/no warming in recent decades (Lansner and Pepke-Pedersen, 2018).

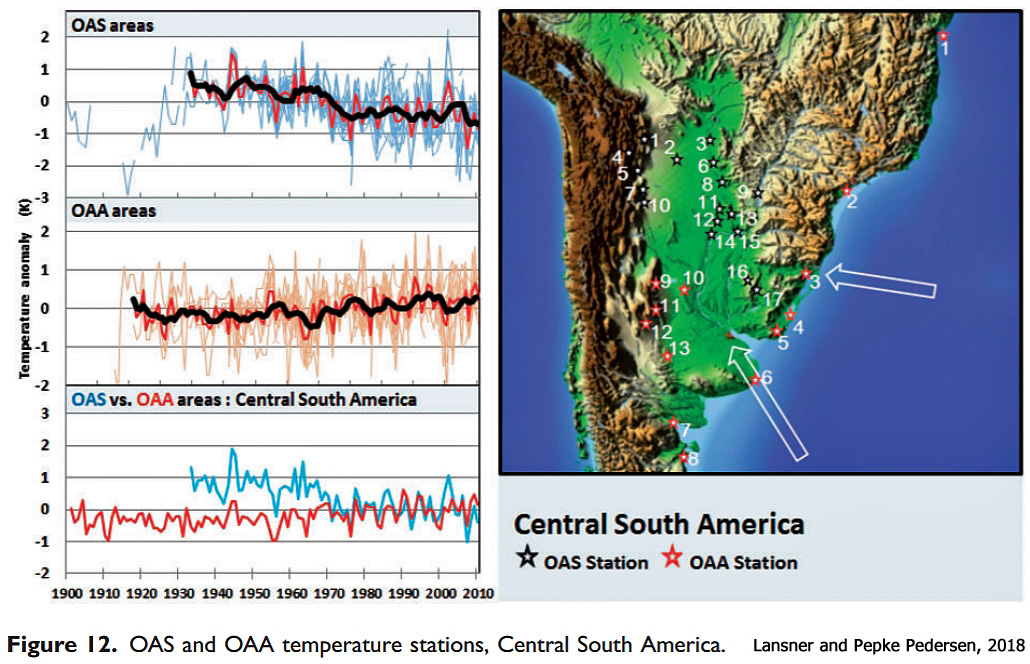
Image Source: Lansner and Pepke-Pedersen, 2018

via NoTricksZone

https://ift.tt/2ScpIlX

February 3, 2020 at 07:26AM

Climate Doomsayers Keep Putting Sell-By Dates On Their Credibility

For these doomsday cultists there’s literally no cost to getting it wrong. The panjandrums of the mainstream media forgive them for spinning these yarns because they know they’re doing it ‘for the right reasons’.

I was slightly surprised when Greta Thunberg announced at Davos that we had eight years left to save the planet. As long as that? Admittedly, that’s four years less than Alexandria Ocasio-Cortez, who put it at 12, although, come to think of it, that was last January, so presumably she now thinks we’ve got 11 years left. But some doomsayers have been much less optimistic. According to Peter Wadhams, a Cambridge professor interviewed in the Guardian in 2013, Arctic ice would disappear by 2015 if we didn’t mend our ways, while Gordon Brown announced in 2009 that we had just 50 days to save the Earth. Then again, playing the long game can also catch up with you. In 2004, Observer readers were told Britain would have a ‘Siberian’ climate in 16 years’ time. We’re supposed to be in the midst of that now.

On the face of it, we should be grateful that these gloomsters make such oddly precise predictions. It’s like putting a sell-by date on their credibility. After all, when the soothsayer in question is proved wrong, they just shuffle off with their tail between their legs, never to be heard from again, right? In eight years’ time, when the planet hasn’t disappeared in a cloud of toxic gas, presumably Greta will throw up her arms and say: ‘Sorry guys. Looked like I was wrong about you ruining my childhood. I’m now going to become a flight attendant.’

But, weirdly, that never happens. No matter how often these ‘experts’ are shown to be no better at forecasting than Paul the Octopus — worse, actually — they just carry on as if nothing has happened. Take Paul Ehrlich, author of the 1968 bestseller The Population Bomb. ‘We must realise that unless we are extremely lucky, everybody will disappear in a cloud of blue steam in 20 years,’ he told the New York Times in 1969. Ehrlich also predicted America would be subject to water rationing by 1974 and food rationing by 1980. Ehrlich’s ‘bomb’ failed to explode, but his career didn’t. On the contrary, he’s now the Bing Professor of Population Studies at Stanford and the president of Stanford’s Center for Conservation Biology. All I can say is, it’s lucky he didn’t become a bookmaker.

The fact that Ehrlich is still an eminent environmentalist — and Prince Charles can pose alongside Greta Thunberg in Davos in spite of claiming we had eight years left to save the planet 11 years ago — helps explain why these Mystic Megs have no hesitation about making these forecasts. It’s a great way of drawing attention to their cause and there’s literally no cost to getting it wrong. The panjandrums of the mainstream media forgive them for spinning these yarns because they know they’re doing it ‘for the right reasons’. They’re not peddling alarmist nonsense — no, they’re just exaggerating the risk. In any case, they might be right and doesn’t the ‘precautionary principle’ dictate that we should change our behaviour just in case? Oddly, these same secular humanists don’t apply the logic of Pascal’s Wager to believing in God. That would be unscientific.

But is there also something else going on? I’m generous enough to think that these activists are not cynics trying to grab headlines, but are sincere in their prophecies of doom. For instance, when George Monbiot predicted a ‘structural global famine’ in as little as ten years’ time if we didn’t start eating less meat — this was in 2002 — he genuinely believed it. And when that famine failed to materialise, he didn’t abandon his apocalyptic environmentalism, but doubled-down, as readers of his Guardian column can testify.

Full post

The post Climate Doomsayers Keep Putting Sell-By Dates On Their Credibility appeared first on The Global Warming Policy Forum (GWPF).

via The Global Warming Policy Forum (GWPF)

https://ift.tt/31n9Xg4

February 3, 2020 at 06:36AM

The Superbowl Of Data Tampering

NOAA shows that US afternoons have warmed sharply over the past century.

Climate at a Glance | National Centers for Environmental Information (NCEI)

NOAA thermometer data shows cooling. The warming only appears after the data is altered.


These adjustments are made despite the fact that hot days used to be much more common in the US.

The National Climate Assessment agrees with the graphs I create.


Temperature Changes in the United States – Climate Science Special Report

The primary excuse for the data tampering is Time of Observation Bias (TOB) – which based on the belief that if your twenty four hour measuring period begins too close to the daily maximum, average maximum temperatures will be too high. The opposite occurs if the 24 hour period begins too close to the daily minimum, average minimum temperatures will be too low.

In this case, the 24 hour period begins at 4PM, and average maximum temperatures are too high.

In this case, the 24 hour period begins at 4AM, and average minimum temperatures are too low.

Fort Collins Weather Station Custom Data Plots

NOAA believes that most stations during the 1930s used a 24 hour period which began in the afternoon, causing average 1930s afternoon temperatures to be too high. This is easy enough to test out by splitting the stations up into afternoon groups and morning groups.

The morning stations average about three degrees warmer, because people at warmer locations are more likely to read thermometers in the morning.

If these two graphs are normalized, it becomes clear that there is almost no difference between the trends of the two groups of stations. TOB has very little effect.

Missouri is the best state to look at in more detail, because they had nearly an equal number of morning and afternoon stations in 1936.

NOAA massively adjusts Missouri temperatures to cool the past.

But the two groups (morning and afternoon) are nearly identical, particularly during the 1930s. The NOAA adjustments are fraudulent.

The real story is that NOAA is simply making data up. Almost half of it is now fake.

I pointed this out in 2014, and Anthony Watts originally disagreed with me – but later he came around and realized I was correct. He talked to Zeke and NOAA, and they acted shocked and surprised. Anthony thought they would fix it in a week.  But six years later the problem has only gotten worse.

Reality is that the data is being tampered with precisely to match the increase in atmospheric CO2.

via Real Climate Science

https://ift.tt/2RU0075

February 3, 2020 at 06:23AM

David Attenborough’s Fake News

Documentary films educate. They also misinform and manipulate.

via Big Picture News, Informed Analysis

https://ift.tt/31nN0cF

February 3, 2020 at 06:17AM