The SARS-Cov2 virus can take over and does some pretty cool engineering. (At least in the case of monkey cells.)
The infected cells produce hairy tentacles that poke holes in nearby cells to help spread the virus.
Coronavirus tentacles with small yellow virus particles attached.
So once a virus is inside it can not only hijack the cell to make more viruses (the little yellow prickly balls in the photo) it also forces the cell to make all these hairy tentacles to push the viruses into neighboring cells. Apart from being a neat gee-whiz moment in molecular construction, this is worth knowing because it gives us more targets to aim for. (More moving parts to throw spanners at).
To that end, the team found 87 drugs that are already either FDA approved or in clinical trials that might help. And 7 of them have already shown they can inhibit the virus in both human and monkey cells.
There are some major molecular engineering battles going on
Coronaviruses are larger RNA viruses than most, so that gives the virus more tools to work with. All up we know that there are 27 SARS Cov2 proteins which […]
The headlines are screaming about recent increases in coronavirus cases, with some suggesting that the essential problem is the loosening of the lockdowns and restrictions. A number of media sources note that many of the problematic locations are “red” states with Republican leadership.
It is not surprising that moving out of lockdown resulted in more COVID-19 cases. In addition, the increasing number of tests undoubtedly increases the number of known infected.
But could there be something else going on?
Could increased use of air conditioning, particularly in the southern tier of states, be a significant driver of increasing number of COVID-19 cases?
This blog will attempt to help answer this question.
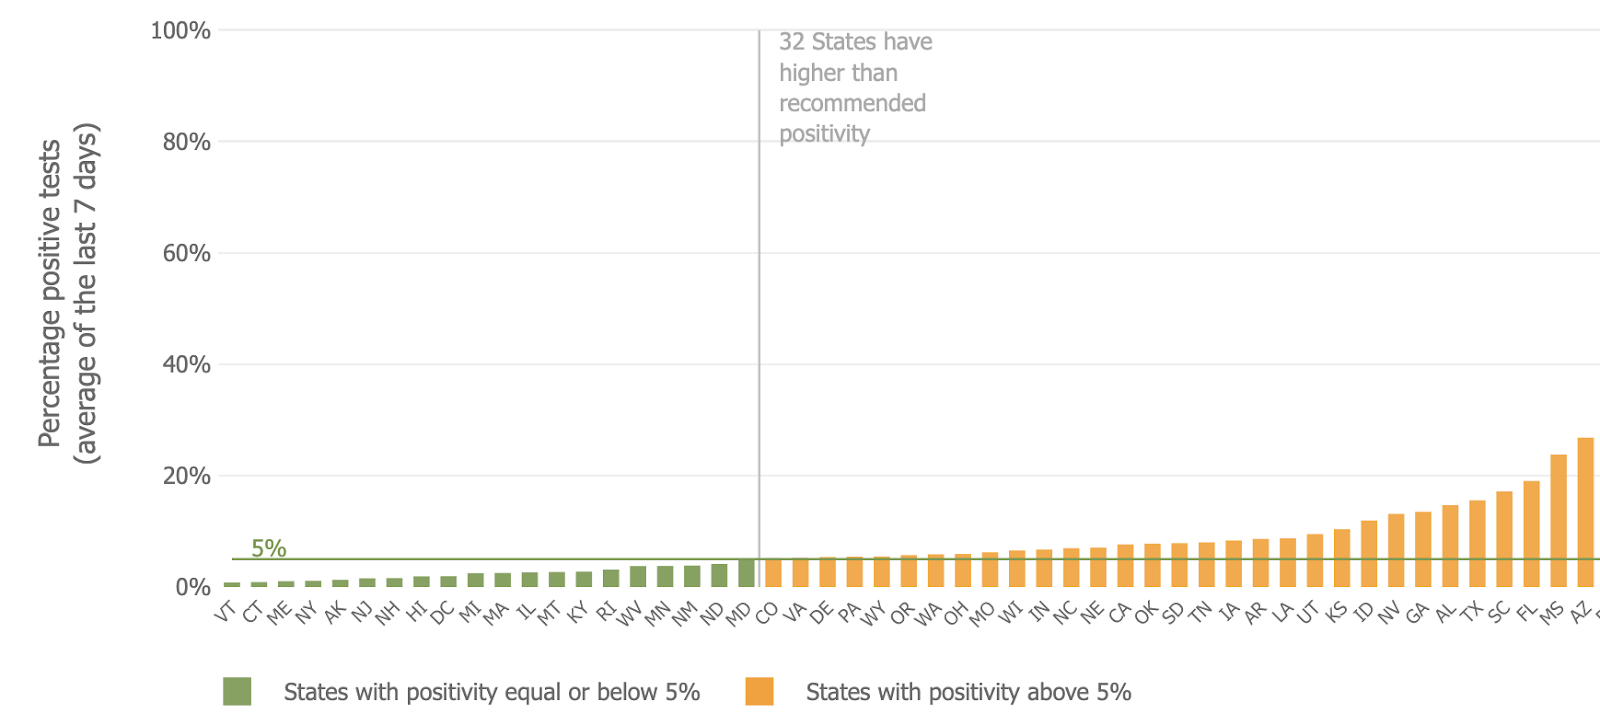
So where is the virus really spreading? A good way to see the problem locations is to view the percentage of positive tests. A worsening epidemic is signaled by a higher percentage of positives, assuming there is widespread testing. Positive percentage is far better than number of positive tests, which, of course, varies by the amount of testing.
Here is a plot of the positive percentage on July 7th. The big problem states were Arizona, followed Mississippi, Florida, South Carolina, Texas, Georgia, Alabama, Nevada, and finally Idaho.
Below is a different type of plot that shows the same thing, but provides the actual numerical values. The bottom line: the situation is far worse for states along the southern tier of the U.S. Arizona is the worst, with Mississippi and Florida right behind. These are states with very different demographics.
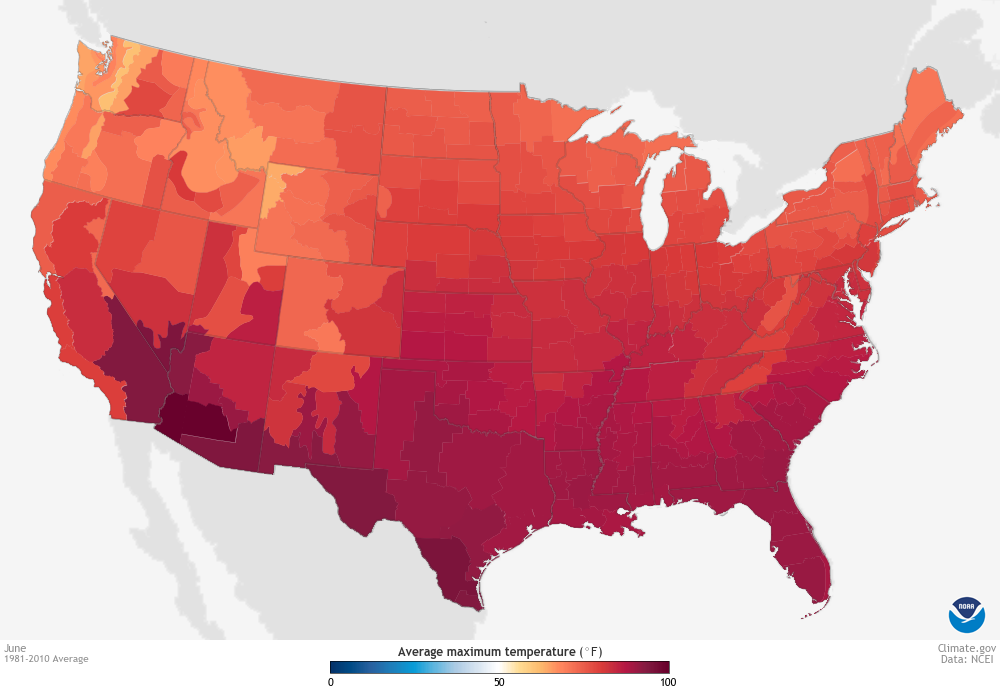
But what do these states have in common? Some media outlets are pushing the fact that most of these states are dominated by the Republican party and have been quicker to open up. But they have something else in common: these states have had high temperatures with a lot of air conditioning use. (And no, there is no reason to think that heat turns people into Republicans). If we look at the high temperatures in June (shown below, NOAA division dataset), southern Arizona (including Tucson) is the nation’s hot spot–and yes, it is the hot spot for COVID-19 as well. Mississippi, South Caroline, Florida, Texas are all very hot. And according to U.S. Census data nearly all homes and most restaurants in these states have AC. And an independent graphic, showing the high temperatures averaged over the 30 days ending July 7th (Climate Prediction Center), has a similar pattern. Arizona has the highest temperatures.
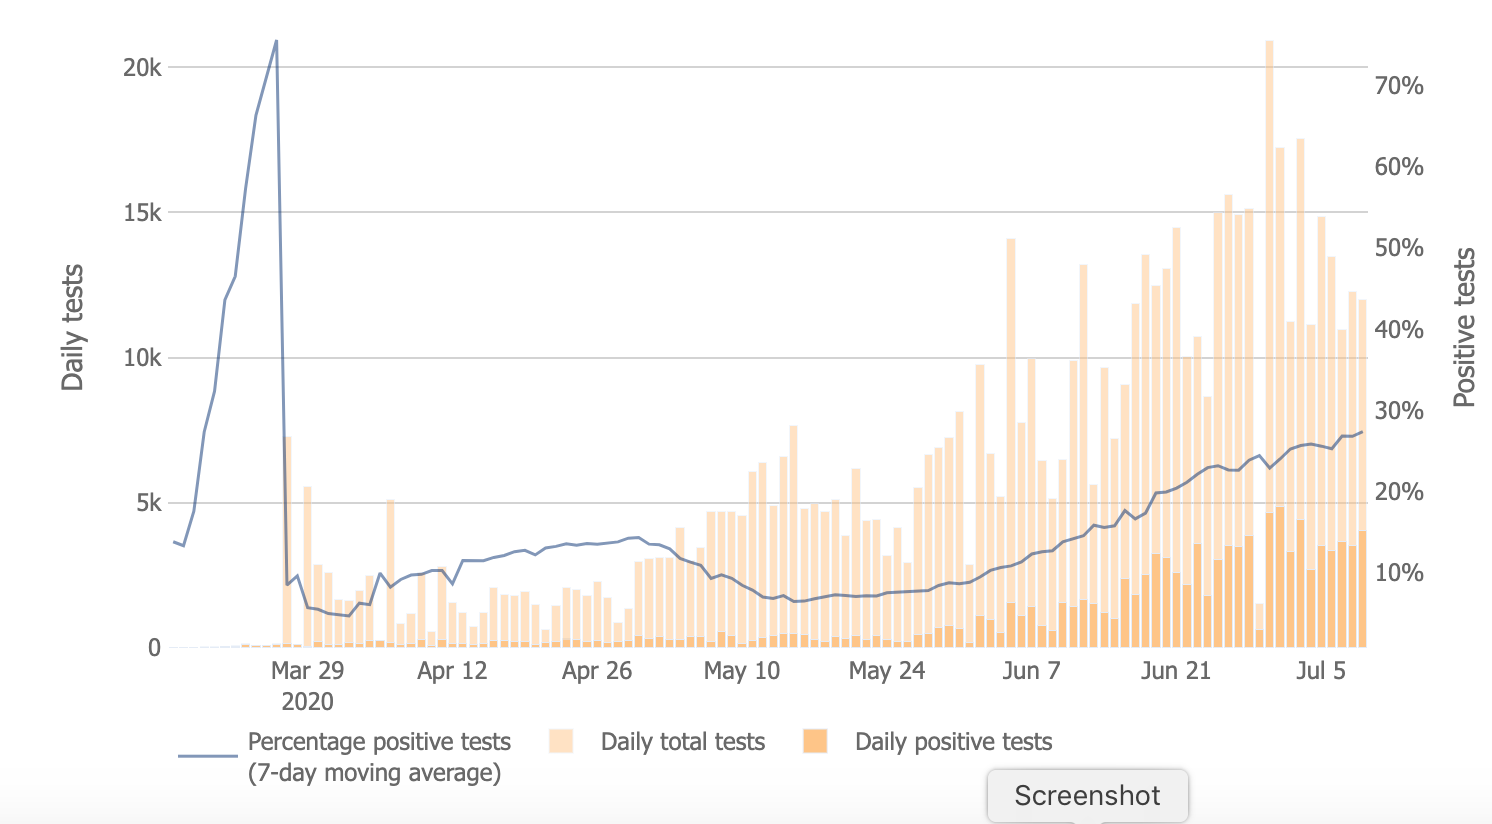
So let us consider a hypothesis: the rapid warming in late spring led to greatly increased use of air conditioning in homes, stores and restaurants in the warm, southern tier states. More people are thrust into interior spaces with recycled, recirculating air that increases COVID-19 spread, something described in several research papers. And the cooler, drier conditions associated with air conditioned spaces are favorable for COVID-19, and the blowing air spreading COVID-19 containing droplets and aerosols. Now is this hypothesis consistent with observations? We can begin by looking at the total tests and percent of positive tests in Arizona (see below). Tests went up substantially in May and June, but so did the percentage of positive tests, which has progressively risen since mid-May (the largest increase was in mid-June)
So what happened in Tucson, located in southern Arizona during June? Temperatures exceeded 100F on many days and over half of the month was above normal (green shows the normal range). Some days were way above normal. June is the worst month in southern Arizona–very, very hot without the relief of the southwest monsoon in July. Air conditioning was a necessity and this miserable period is exactly when the virus surged.
Florida had a similar story. Positive percentages surged in middle and late June.
And this is exactly when temperatures surged to way above normal in southern Florida (see below). And Florida has terrible humidity as well. Folks were forced to flock to air conditioned spaces.
You want something more rigorous? No problem.
If I was writing a paper on this topic, I would present a scatter diagram plotting the temperatures against positive percentages of COVID-10. And I have done exactly that below. Specifically, I found the June average maximum temperature for every state in the continental U.S. and its corresponding positive percentage for COVID-19 (Y-axis percentage, X-axis is average high temperature). Each state is shown by a blue dot. I only plotted states with max temperatures in June of 75F or more, which excluded a handful of states that are very cool and have very few air conditioners (e.g., WA, OR, and Montana).
I also plotted a best-fit line (red). There DOES appear to be a relationship between COVID-19 infection rates and temperature. The correlation coefficient is .69, which suggests this relationship explains about 48% of the variability. That is quite a bit. The point in the upper right corner?–Arizona.
Now certainly there are a number of factors that help explain the variability of COVID-19 infection rates around the U.S. But I do think the above results are very, very suggestive that very warm temperatures result in increasing infection rate. Not because the virus likes warm temperatures (it does not, as shown by a number of studies), but because warm temperatures push people indoors into air conditioned spaces in which spread is greatly enhanced. Restaurants and bars are probably key here.
In warmer climates, summer is the time when folks huddle together in confined spaces and thus the greatest potential for COVID spread. The implication of all this is that the situation might be expected to worsen over the southern tier states and into the warm/humid areas of the southeast over the next month or so, but improve during the fall. Clearly, there is reason to avoid air conditioned interior spaces during a COVID epidemic, and dining should mainly limited to outdoor spaces, which should be quite safe.
This states the obvious of course. More carbon dioxide is emitted per unit of energy from biomass than from coal, undermining claims of ‘climate benefits’, and wood pellet production is energy-intensive. But ‘carbon targets’ mean the biomass obsession goes on due to lack of alternatives, given general dislike of nuclear power.
– – –
Leading industry figures acknowledge that not all biomass brings benefits to the climate, insisting that only low-value wood and forest residues should make the cut under EU law, says Euractiv.
“Not all biomass is good biomass,” says Jennifer Jenkins, chief sustainability officer at Enviva, a US-based company which is the world’s largest producer of industrial wood pellets used for electricity and heat production.
“We agree that not all biomass should automatically be categorised as carbon neutral,” Jenkins told an online debate organised on 29 June during EU sustainable energy week.
To bring climate benefits, biomass needs to come from low-value wood residues or smaller trees coming from timber harvests – not from high-value trees that could be used in products like furniture or construction material, Jenkins said.
The question now facing policymakers in Brussels is how to ensure EU energy policies do not encourage the wrong sort of biomass, even inadvertently.
Biomass currently represents almost 60% of the EU’s renewable energy, more than solar and wind power combined, according to the EU’s statistical office, Eurostat.
And even though wind and solar are growing fast, countries such as Austria, Denmark, Finland, Latvia and Sweden would be unable to achieve their 2020 renewable energy targets without biomass, experts say.
“Bioenergy is basically the backbone for these countries’” renewable energy policies, said Martin Junginger, a professor of energy and resources at Utrecht University who spoke at the online event.
EU bioenergy review
The future of bioenergy in Europe is looking uncertain, however.
Earlier this year, the European Commission announced it would perform a comprehensive assessment of biomass supply and demand in Europe and globally with a view to “ensure that EU biomass-related policies are sustainable”.
EU recovery fund leaves €2 trillion investment gap towards climate targets
A European Commission proposal for the European Union’s long-term budget and recovery fund risks leaving a huge shortfall in the “green” investment needed to meet Europe’s climate goals, researchers said on Tuesday (14 July).
With the coronavirus pandemic plunging the EU into a deep recession, leaders from its 27 countries will meet in Brussels on Friday to attempt to agree the bloc’s budget for 2021-27 and an economic stimulus fund.
The EU Commission has proposed a €1.85 trillion package, which it says will drive a recovery in Europe’s virus-hit economies based on “green” industries and technologies that help to reduce emissions of the greenhouse gases fuelling climate change.
But only €80 billion are firmly earmarked for climate protection, according to an analysis by the consultancy Climate & Company and think tank Agora Energiewende, both German-based, being published on Tuesday.
That would pale against the €2.4 trillion in low-carbon investments that the researchers said were needed by 2027 to meet the EU’s current emissions-cutting goals.
They said investment priorities should be rapidly expanding renewable power generating capacity, clean hydrogen production, energy-saving building renovations and electric vehicle charging infrastructure.
“There is a real discrepancy between the narrative we are seeing at the highest political level and the details of the proposals,” said Matthias Buck, head of European energy policy at Agora Energiewende.
The Commission said it could not comment on an unpublished study.
It has said 25% of the EU budget should support climate action. But the researchers said the lack of enforcement measures created a “huge political risk” that this money would be spent on investments that are polluting.


