Shock, horror: According to the WMO and the Met Office, there is a 3% chance of the forthcoming five-year global temperature average exceeding 1.5°C
There are several definitions of hustle. One of them is to use forceful actions to promote an action or point of view. It’s everywhere of course and in all aspects of climate change. It’s all to apparent when scientists want grants, jobs and headlines. It’s no new discovery that combining hustle with statistics can get you anywhere.
The recently released news from the World Meteorological Organisation (WMO), prepared by the UK Met Office, that there is a “growing chance” of the world exceeding the “Paris threshold” of 1.5°C in global temperature above pre-industrial levels is a prime example of this. It says there is a 20% chance that one of the next five years will exceed 1.5°C, and a 70% chance a single month will during the same period. Another way of saying this, statistically equally justifiable, is that there is an 80% change that global annual average temperatures will not increase statistically significantly over the next five years. There are no headlines saying that!
Just for a moment think what this means. If there is no significant change in global average temperature by 2025, we will be able to look back thirty years (the official definition of climate) and note that the two major warming episodes, 1998 and 2015, were both due to natural climatic variability, in this case two El Nino events. In many ways, the WMO report is more a testament to the importance of natural climatic variability than it is to long-term anthropogenic warming.
What’s more this forecast has been tested by reversing the direction of time in the computer models and seeing how successfully it “predicts” the past. One would expect any model to be good at this because past observations have already been incorporated into the model which has evolved to have no serious disagreements with it. In such a complicated system as the climate – and the WMO report actually stresses the uncertain and poorly understood nature of internal climatic variability – looking into the future is an entirely different thing. Good hindcasts do not imply good forecasts.
In other reports of the same WMO document the statistics get even more suspicious. One says that there is a 3% chance of the forthcoming five-year global temperature average exceeding 1.5°C. Three percent implies a very accurate predicative ability, especially when it is accompanied by no error statement. Again, any journalist looking at these figures objectively would find that the real story is that there is a 97% chance that the average of the next five years will remain what it is now! And yet the Ecologist website proclaims we have five years to climate breakdown.
A story like this is a kind of litmus test for journalists. They can take the press release and wave it through to their website with minor changes and supporting statements. Or they could look at the statistics and — how can I say this — ask questions. I have a feeling that the era of unquestioning journalist environmental advocacy which began in the early years of this century, is gradually fading away.
Perhaps they could start to be guided by the empirical data and the messages it has been sending us for years; we do not understand natural climatic variability; our models are nowhere near as accurate as some maintain and forecasts of future temperatures more often than not end in ignominy.
Overview:Death certificate data, corrected for recent under-reporting, reveals a 10-20% decrease in weekly deaths compared to seasonal norms commencing in early March, 2020. This date coincides with the widespread closing of public schools. It is hypothesized that a decrease in traffic accidents is the most likely explanation for the decrease, a conclusion which would be confirmed from detailed analysis of the death certificate data.
I had previously blogged on the caution needed when analyzing the death counts from death certificate data compiled by the CDC. The most recent weeks always have under-counted totals because it takes weeks to months for all of the death certificates to trickle in and be counted. Use of the data without knowing this can lead to false conclusions about recently declining death rates. I outlined a simple method for doing a first-order correction of the data based upon the number of additional death reports in each successive week, a method which I use here.
The CDC data report weekly deaths in three age groups: less than 18 years old (“child”), 18-64, and 65 on up. The data are updated weekly, and the data online extend back to week 40 in 2015. I examined the death totals for the under-18 year old group versus the totals for the 18-and-older (combined) group. (Only those recent reports that were labeled as “100% reporting” were used, but this notation is misleading because the CDC means 100% of the locations around the country had submitted reports, not that all of the reports were complete.)
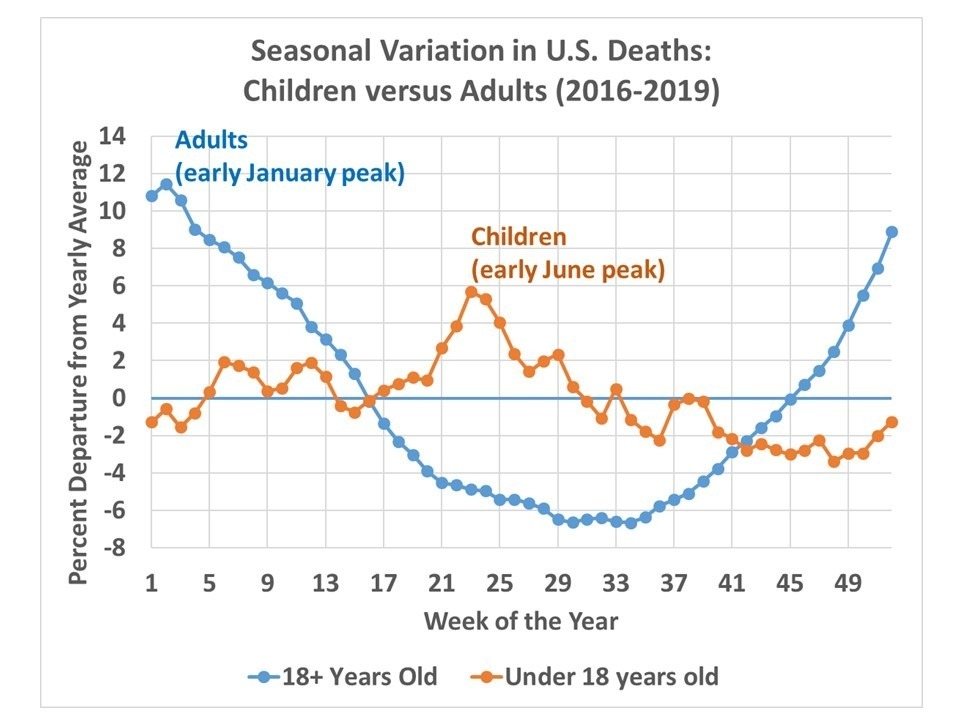
I removed the average seasonal cycle (2016-2019) from the weekly totals, which show a seasonal ~11% peak in deaths in early January for adults, and a weaker ~6% peak in children’s deaths in early June (Fig. 1).
Fig. 1. Seasonal variations (%) in deaths (all causes) for adults versus children, 2016 through 2019.
In order to corrected for under-reporting of recent deaths, I used the data from 4 successive weeks earlier this year to correct the most recent 52 weeks of data. Those 4 successive weeks yielded average week-to-week adjustments which accumulated to 16.5% under-reporting for 1 week previous to latest reported week; 10.4% at 2 weeks previous; 7.8% at 3 weeks; 6.4% at 4 weeks, dropping below 1% at 10 weeks previous, etc.
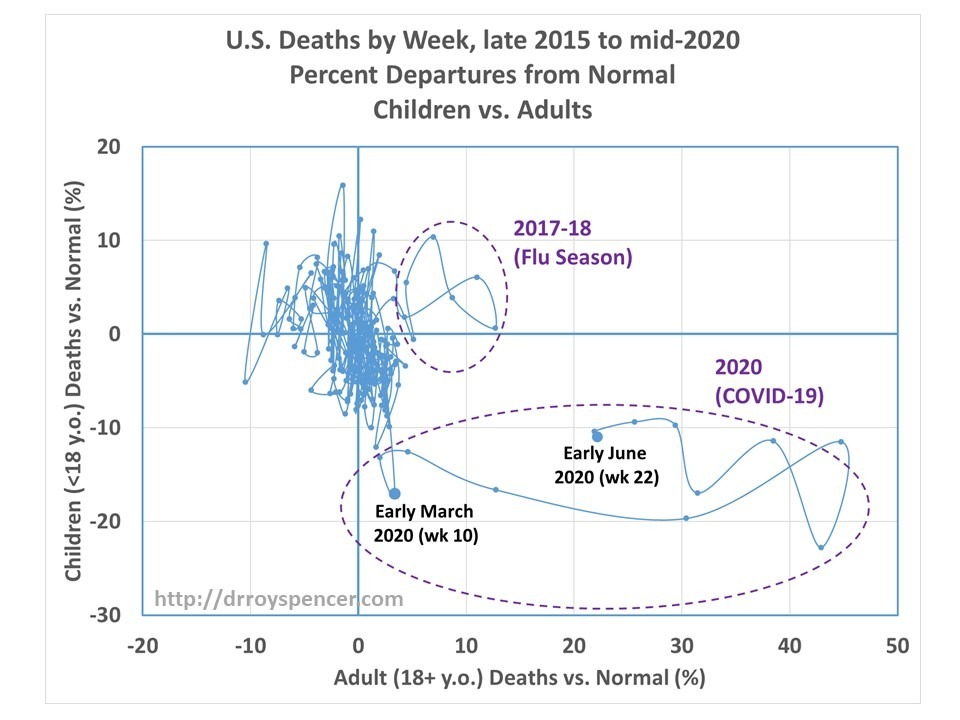
I then computed the weekly percent departures from the average seasonal cycle for the entire time period (since week 40 of 2015). The results (Fig. 2) show the unusually bad peak in seasonal flu and pneumonia deaths in 2017-18, which as expected results in a larger increase in adults that children.
Fig. 2. Weekly number of deaths as percent departures from seasonal normals, for adults versus children, plotted as a phase space diagram (successive weeks connected by a line).
Note that there is a 10-20% decrease in child deaths beginning in early March, which is when most schools in the U.S closed down. Since the most frequent cause of death in the under-18 age group is auto accidents, it makes sense that the greatly reduced traffic activity during “lockdown” led to fewer deaths.
Of course, the same kind of reduction would be expected in the adult age category, but it is completely overwhelmed in Fig. 2 by the large increase due to COVID-19 deaths, which peaked in mid-April. Since there have been very few COVID-19 deaths in children we more clearly see the reduction in that age group. In absolute terms, a 15% reduction in childhood deaths equates to about 85 children per week.Â
Temperature recordings at the Greenland Ranch weather station in Death Valley, California during the intense heat wave of July 1913. This excerpt about the record-breaking heat wave comes from an article posted during January 1922 in the meteorological journal Monthly Weather Review which is still in publication today. Source: NOAA
*On July 10, 1913, Death Valley, California reached an amazing 134 degrees…the hottest temperature ever reliably recorded in a year with many remarkable weather events*
Overview
The high temperature in Death Valley, California on Friday will come close to 120°F, but this is still well short of the all-time record there that occurred way back in 1913. On July 10th, 1913, the weather observer at Greenland Ranch in Death Valley recorded a high temperature of 134°F. One hundred and seven years later, this is still the highest air temperature ever reliably recorded on Earth. In addition to this all-time and worldwide high temperature record, the year of 1913 produced numerous other extreme weather events.
Asphalt roadway near the salt flats of Death Valley National Park in California
Why so hot in Death Valley?
Death Valley National Park is the largest national park in the continental US and is located in the Mojave Desert of southeast California. It contains a vast range of elevations and landscapes and is known for being a land of extremes including its climate. In fact, the depth and shape of Death Valley contribute greatly to its extreme heat. Specifically, the extreme heat is due to a combination of several factors including the elevation below sea level (282 feet), the lack of vegetation; especially, on the lowest part of the valley floor which allows sunlight to directly heat the desert surface, the narrow width of the valley and its north-south orientation which traps air in the valley allowing it to be recycled back down to the valley floor, radiation of heat from the rocky surfaces of the mountains that surround the valley, and the low humidity as dry air heats at a much quicker rate than moist air and greatly inhibits the formation of clouds. Temperatures in Death Valley normally reach or exceed 100°F from mid-May until early October.
Extreme weather of 1913
The intense heat of July 1913 in California was not the only extreme heat measured that year in the US. There was a widespread heat wave in June of that same year across the eastern half of the nation which resulted in many readings above 100°F. In fact, NOAA’s official temperature records still cite June 16, 1913 as the hottest ever on a nationwide basis for that particular date. In addition to the excessive heat seen across the US that year, there are newspaper articles from that same time period suggesting high heat may have taken place in others part of the world. One such article (excerpt shown above) written on March 30, 1913 reported that “recent observations seem to show that glaciers are gradually disappearing all over the world”.
In addition to the extreme heat, 1913 featured other severe and deadly weather events across the US. During March, one of the worst floods ever in this nation took place after major rivers in the central and eastern US flooded from runoff and several days of heavy rain. This flood now referred to as the “Great Flood of 1913” remains one of the worst natural disasters ever for Ohio with places like Dayton in the southwestern part of the state submerged underwater for several days. Later that same very eventful year, one of the worst storms ever for the Great Lakes region took place and it is now referred to in multiple ways including “White Hurricane”, “Freshwater Fury” or simply “The Great Lakes Storm of 1913”. This powerful storm was a blizzard with hurricane-force winds that devastated the Great Lakes Basin and the province of Ontario in Canada from November 7 through November 10, 1913.
During July 1913, Death Valley, California endured an intense stretch of hot weather from the 5th through the 14th when the high temperature reached 125°F or higher each and every day. In fact, this 10-day stretch still ranks as the hottest stretch ever recorded in Death Valley. The hottest days in this time period occurred from the 9th through the 13th when the high temperature reached at least 129°F with the hottest being on July 10th when the record-breaking 134°F was measured.
Weather station reliability at Greenland Ranch
In terms of the reliability of the Greenland Ranch weather station at Death Valley, California, there should be little question in that regard. The US Weather Bureau (now known as the US National Weather Service) actually established this weather station in 1911 in cooperation with the company that operated the ranch. In their own words, the US Weather Bureau “carefully tested maximum and minimum thermometers” and stated that “the instrument shelter at this station is the same as those used at several thousand other weather stations maintained by the Weather Bureau throughout the United States”. The US Weather Bureau summarized by stating “the extreme maximum temperature of 134°F recorded on July 10, 1913, is the highest natural-air temperature ever recorded on the earth’s surface by means of a tested standard thermometer exposed in a standard ventilated instrument shelter”.
Interesting twist to the record
In this particular case, we are dealing with what appears to be a reliable high temperature record that was set long ago and still stands today as the all-time record on the planet, but there is an interesting twist to the record. The Death Valley, California record of 134°F was less than a decade old when it fell to a new record. On September 13, 1922, a temperature of 136°F was recorded at El Azizia, Libya and this was indeed cited by the World Meteorological Organization (WMO) for nine decades as the world’s highest temperature ever recorded. However, on September 12th, 2012, the WMO officially re-certified the 134 degree reading of July 10th, 1913 at Death Valley, California as the all-time highest air temperature ever recorded on Earth after evidence surfaced suggesting the Libya record of 136°F was based on a reading from a bad thermometer that was placed in the wrong place (near asphalt) and read by an untrained observer.
Cooperative observer form for July 1913 from Greenland Ranch in Death Valley, California. The high of 134°F recorded on July 10 is circled in red.
In fact, there are many risks when comparing high temperature records set in today’s world to those set decades ago. Many of today’s “official” reporting weather stations have had significant growth in development (housing, roads, etc.) in their immediate surrounding region with materials like asphalt and concrete that are known to have an overall warming effect on temperatures. This “urban heat island (UHI)” effect has become an increasingly important problem to deal with in the analysis of long-term temperature trends and the evaluation of modern day high temperature records. In the Southwest US, for example, where populations have doubled or tripled in the past 50 years near official reporting weather stations (e.g., Las Vegas, NV, Phoenix, AZ), the UHI effect has become important enough that record high temperature records of today are questioned in some locations. Even the inhospitable region of Death Valley has had some development in the area surrounding today’s weather station at Furnace Creek with asphalt roads now leading to a nearby visitor’s center – all of which makes this long-surviving record of 134°F set in 1913 at Greenland Ranch very impressive indeed.
One final note of interest, the coldest temperature ever recorded at Death Valley occurred in, yes, the same year of 1913. On January 8th, 1913, the temperature dropped to 15°F at Furnace Creek which is the lowest ever recorded in Death Valley.
Spend £25 billion to save £20 a year. That sounds like a bargain!!
The energy watchdog has announced new plans to transform the UK’s gas power network, upgrading it to be more “green” and potentially saving Brits an average of £20 a year on their energy bills.
Ofgem, the energy regulator, on Thursday published plans to invest £25bn ($32bn) over five years to develop more “clean” gas energy network the UK. The investment will go into the infrastructure that transports energy around the UK.
The plan would be paid for by energy companies themselves. The regulator has proposed doubling a cap on how much money energy firms can return to their investors and reducing firm’s spending plans to ensure costs do not rise for consumers.
Ofgem estimates the average gas bill would in fact fall by £20 per year at the start of its transformation plan.
“Ofgem is working to deliver a greener, fairer energy system for consumers,” chief executive Jonathan Brearley said in a statement.
“This is why we are striking a fair deal for consumers, cutting returns to the network companies to an unprecedented low level while making room for around £25bn of investment needed to drive a clean, green and resilient recovery.
“Now more than ever, we need to make sure that every pound on consumers’ bills goes further. Less of your money will go towards company shareholders, and more into improving the network to power the economy and to fight climate change.”
If you read the small print however, the £20 a year saving only applies at the start of its transformation plan.
By the time the plan is completed, households will have paid out about £1000 each to fight climate change. As the plan covers five years, that works out at £200 a year.
We are not told exactly what this will cover, but we know it only covers power transmission and gas distribution. Plans for electricity distribution will be announced later, and will doubtless cost billions more.
None of this money includes the cost of subsidising renewables, which is accounted for separately. Presumably it will cover grid enhancements necessary for accommodating renewable energy, and I suspect preparation for a hydrogen grid.
What is certain though is that this £25 billion is loose change, compared to the eventual cost to be placed on consumers. By doing it piecemeal in this way, OFGEM is hoping that nobody will notice the true impact on their energy bills.