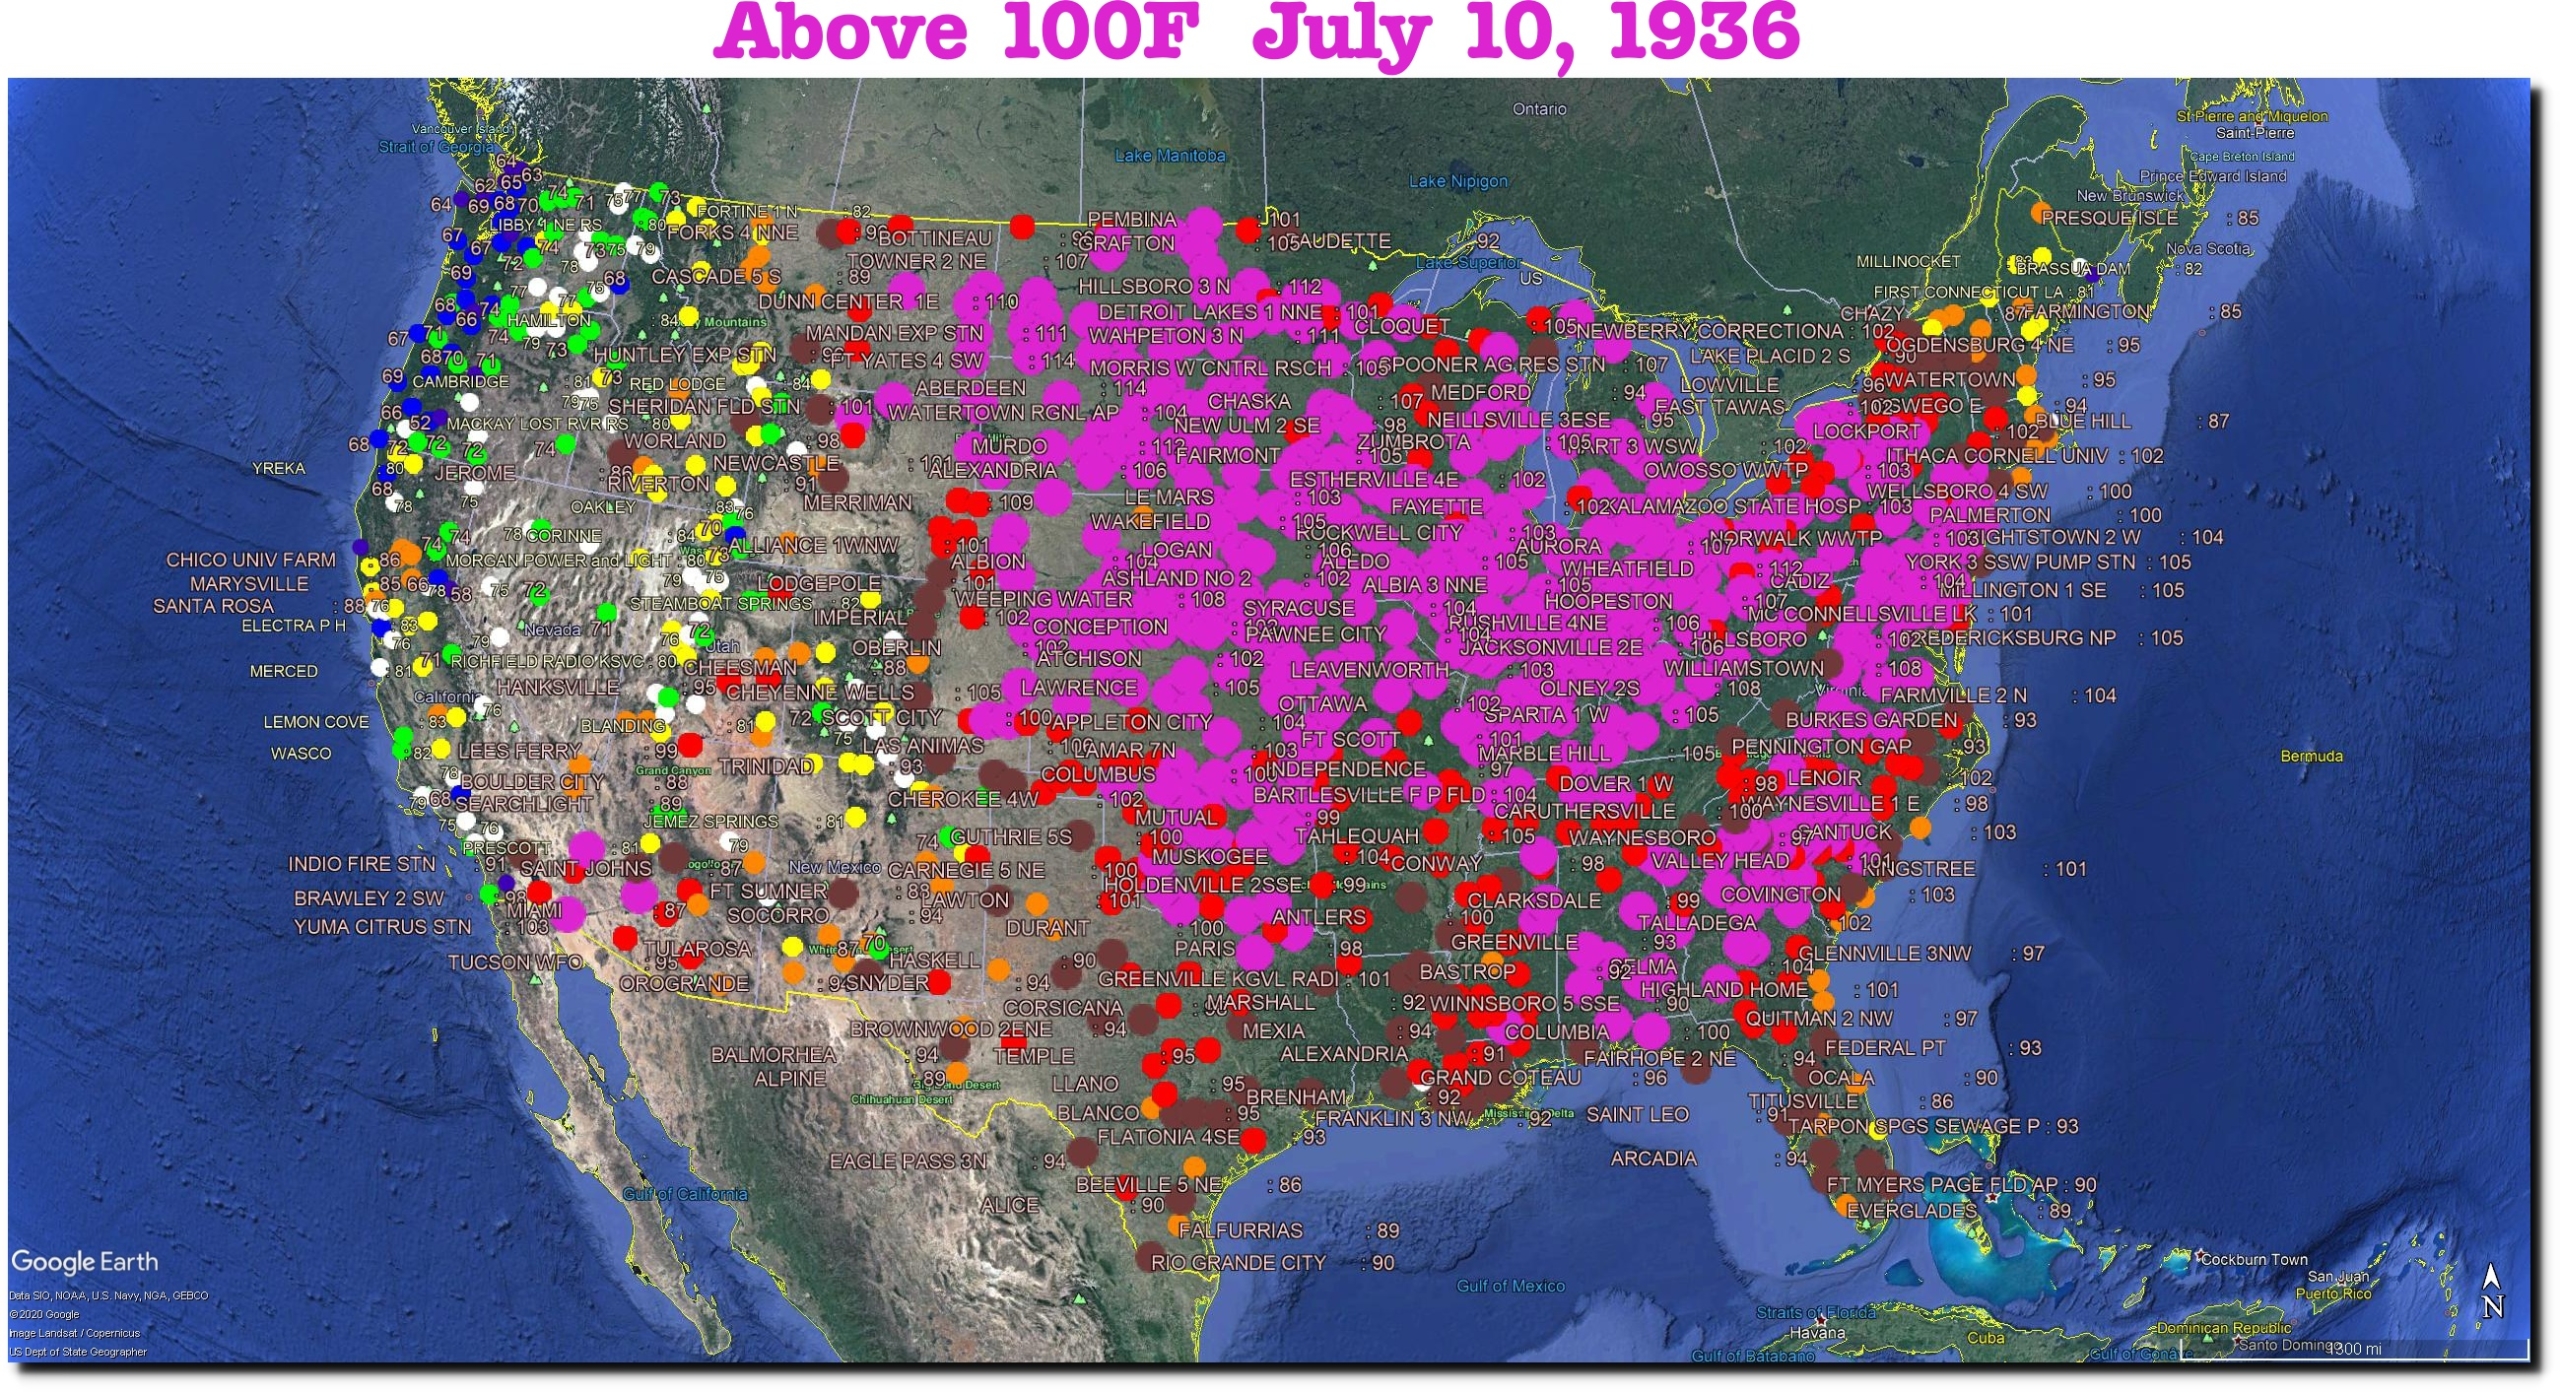
On July 10, 1936 almost half of the US was over 100 degrees, and six states were over 110 degrees : North Dakota 114, South Dakota 114, Indiana 112, Montana 112, Nebraska 111, Minnesota 11.
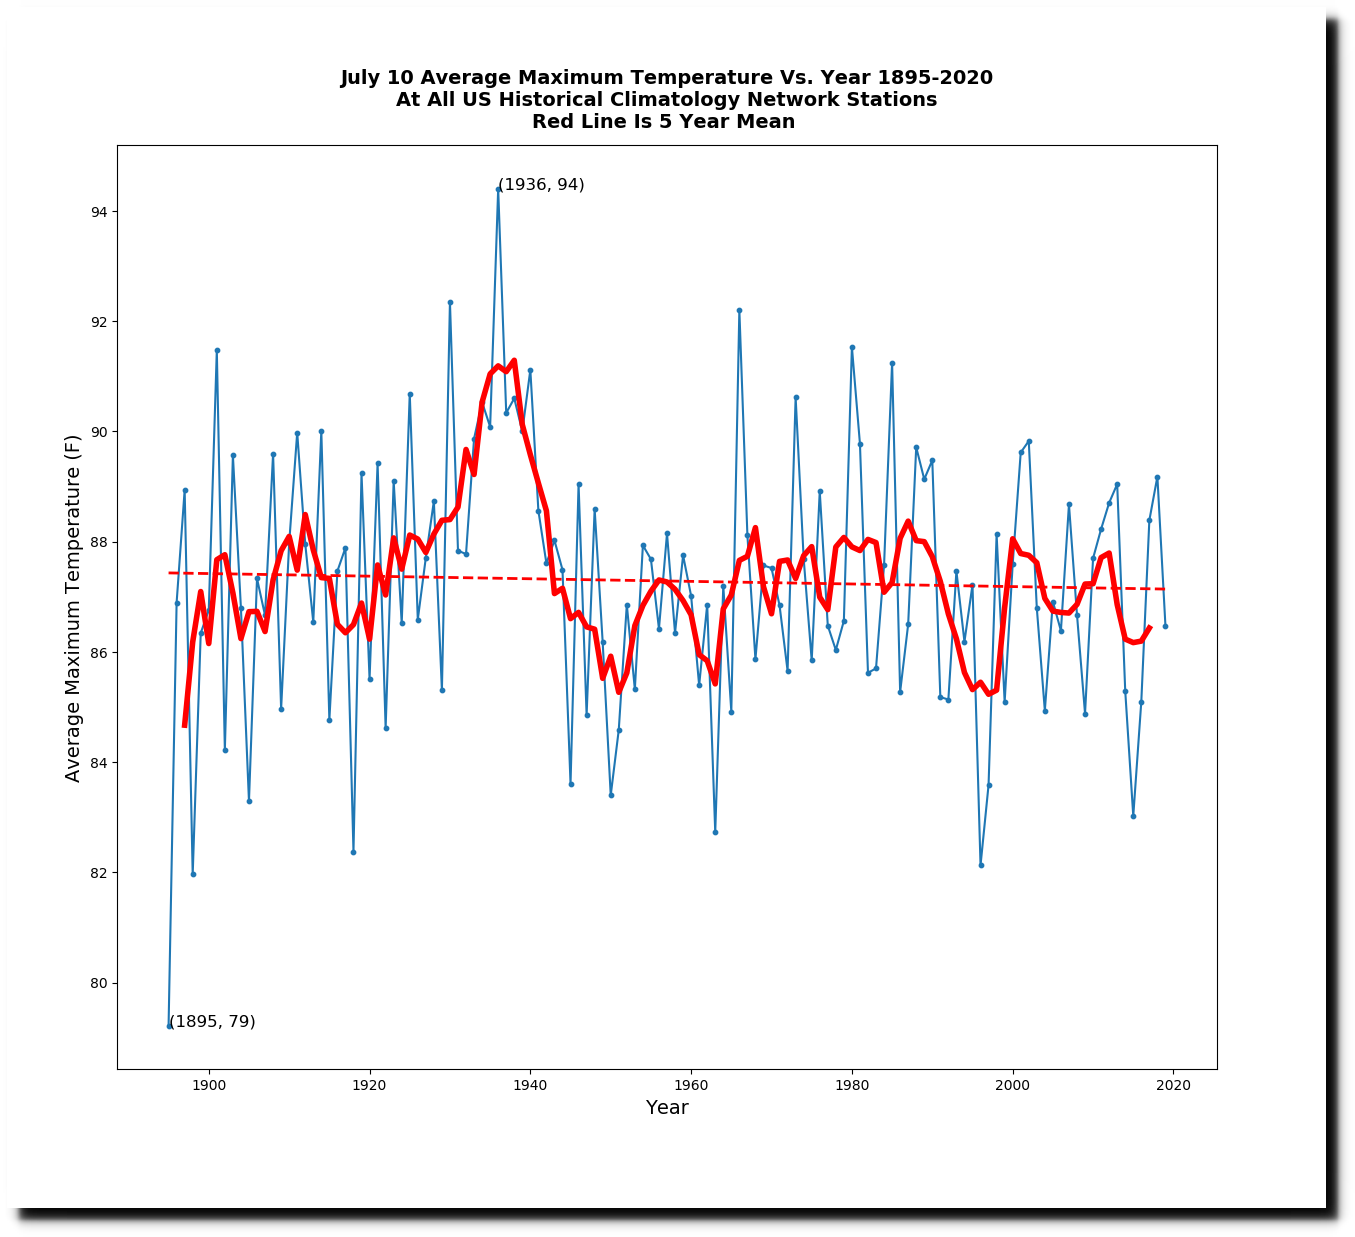
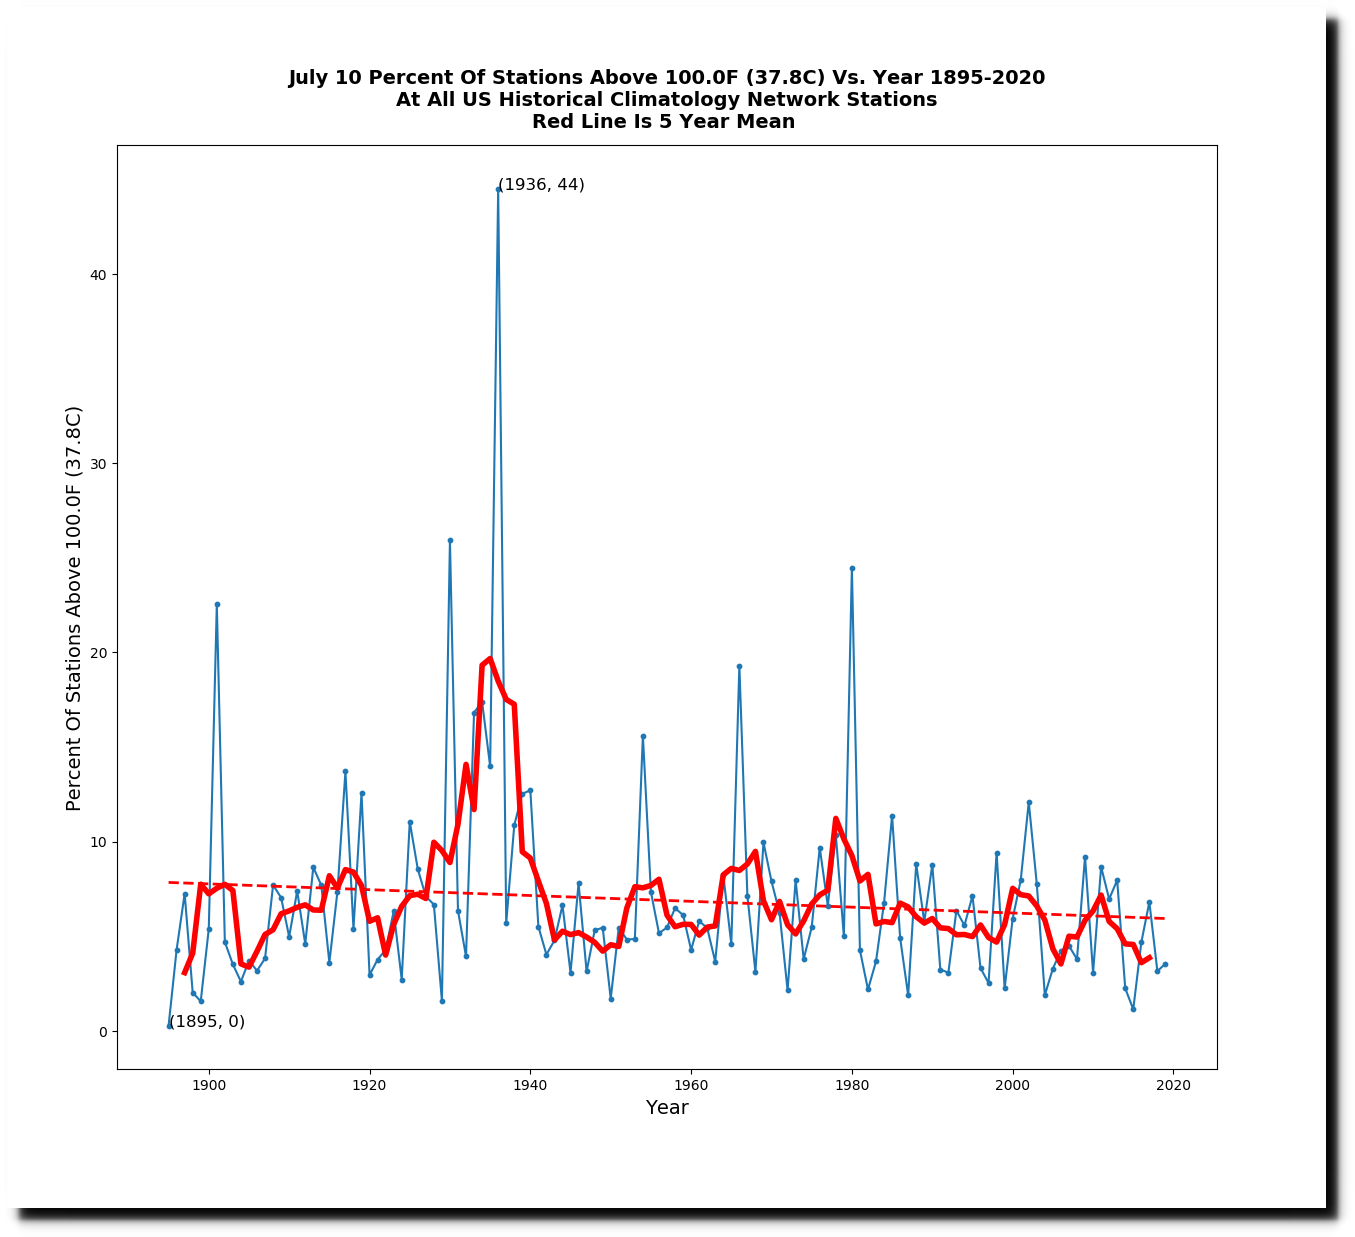
The average temperature across the US was 94 degrees, and 44% of USHCN stations were over 100 degrees.
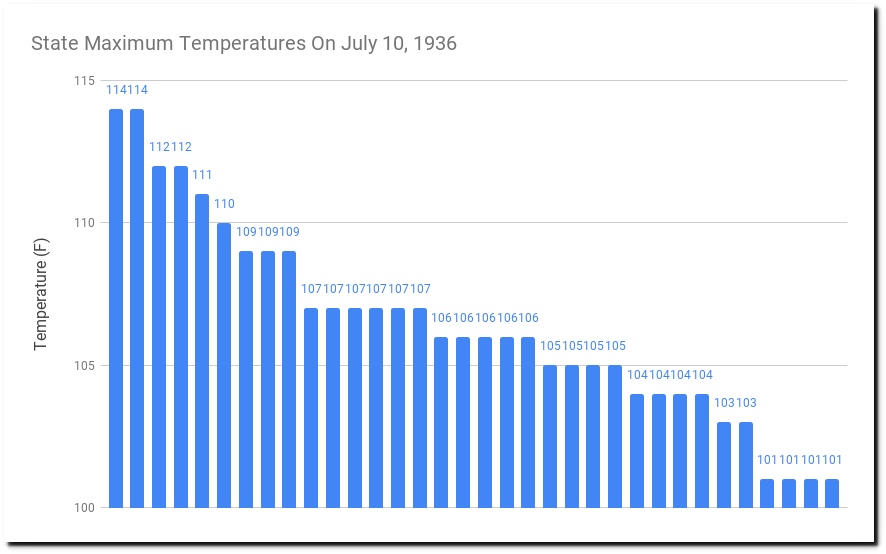
State	        Highest Temperature (F)
North Dakota	114
South Dakota	114
Indiana	        112
Montana	        112
Nebraska	111
Minnesota	110
Illinois	109
Kentucky	109
Virginia	109
Iowa	        107
Missouri	107
Pennsylvania	107
West Virginia	107
Wisconsin	107
Wyoming	        107
Alabama	        106
Colorado	106
Maryland	106
New Jersey	106
Ohio	        106
Delaware	105
Kansas	        105
Michigan	105
Oklahoma	105
Georgia	        104
North Carolina	104
South Carolina	104
Tennessee	104
Arizona	        103
New York	103
Arkansas	101
Florida	        101
Mississippi	101
Texas	        101
As the planet warms, the intensity, frequency and duration of extreme weather events such as heatwaves and heavy rainfall is expected to increase.
Corresponding decreases in cool weather events along with changes to dry spells are also expected.
Understanding and quantifying this change is the focus of an updated dataset examining weather data from more than 36,000 weather stations between 1901 and 2018. An international team of scientists from 39 different institutions – led by the Met Office – has gathered data to compile a dataset known as HadEX3 containing 29 indices of weather extremes (17 relating to temperature and 12 relating to precipitation). The development and initial analysis of HadEX3 have today been published in a paper in the Journal of Geophysical Research – Atmospheres.
Dr Robert Dunn of the Met Office is the lead author. Commenting on the update, he said: “Looking at the changing climate by studying the frequency of extreme weather events provides a different perspective on climate change, complementing other metrics such as annual average temperature rise.
“It is extreme weather events which make the impacts of climate change real for people, and these events also present the greatest shocks to human health and well-being, financial economies and of course, the biosphere.”
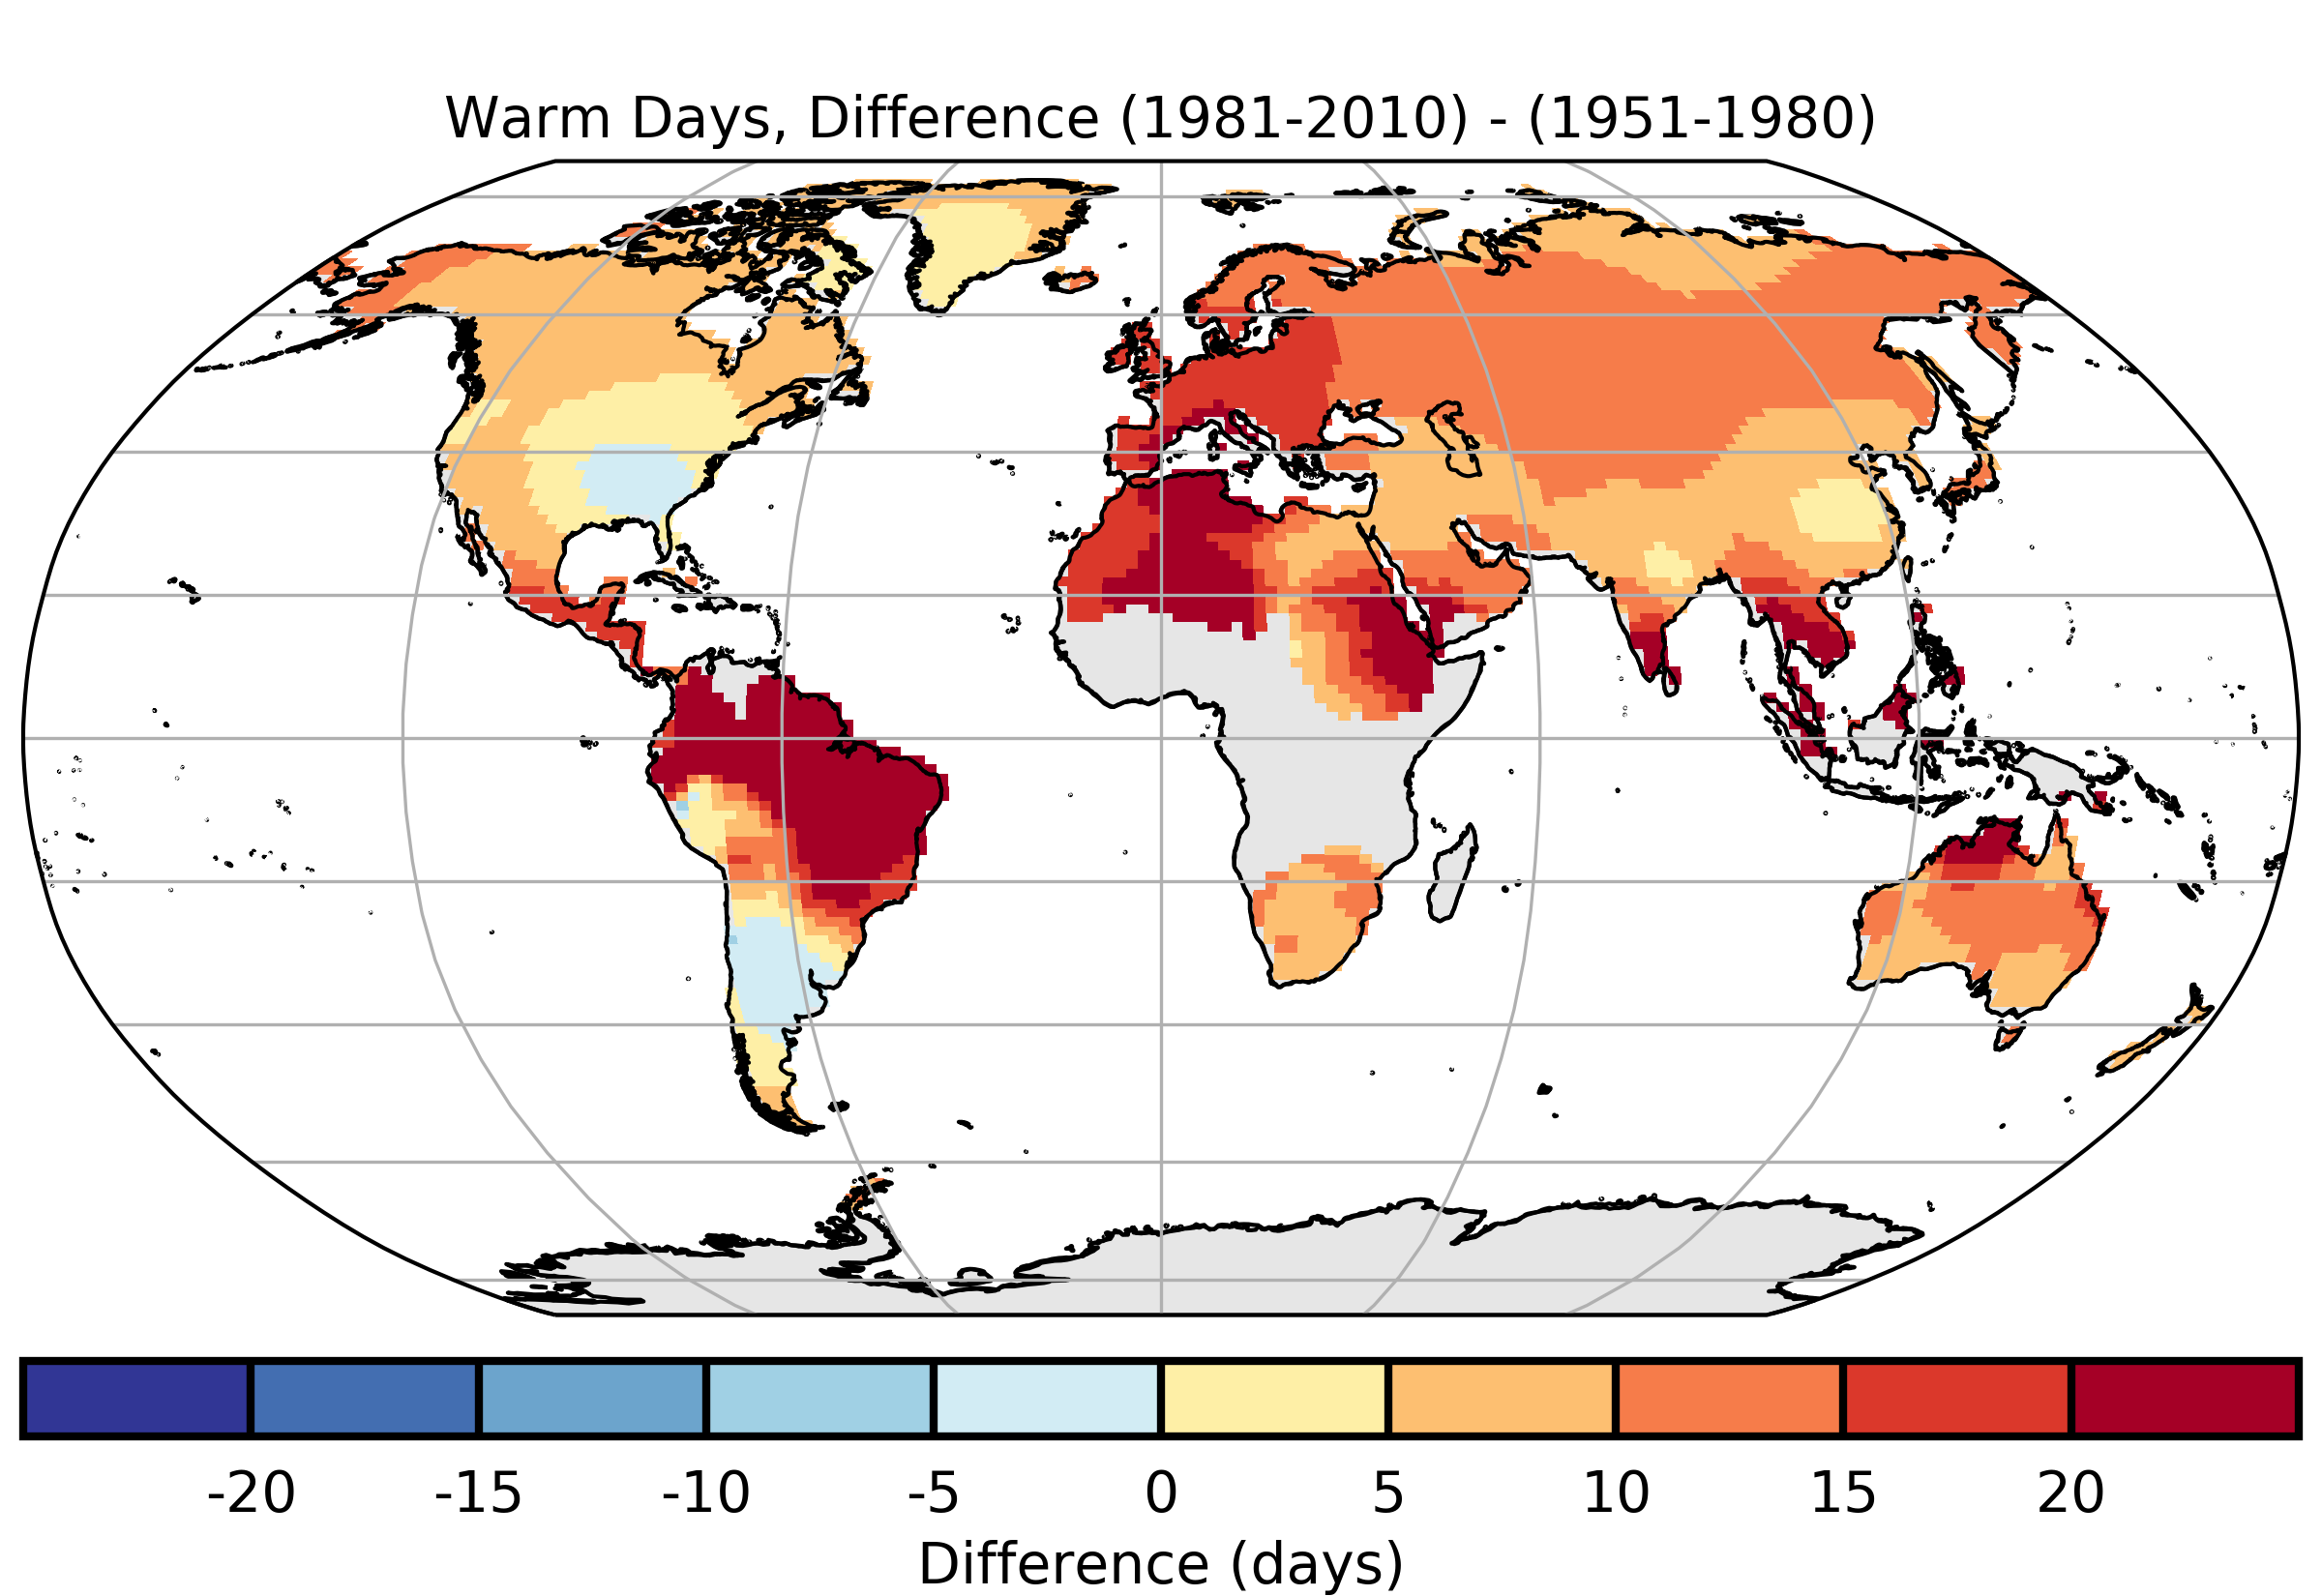
One of the clearest indices tracks the upward trend in daily maximum temperature, showing a clear increase in the number of warm days globally, when compared with the number of warm days between 1961-1990. As the map above shows, the greatest increase is observed in tropical regions of South America, Northern Africa and through Asia. Similarly, the number of warm nights in these regions have increased by over eight days per decade, leading to a doubling since the late 1970s.
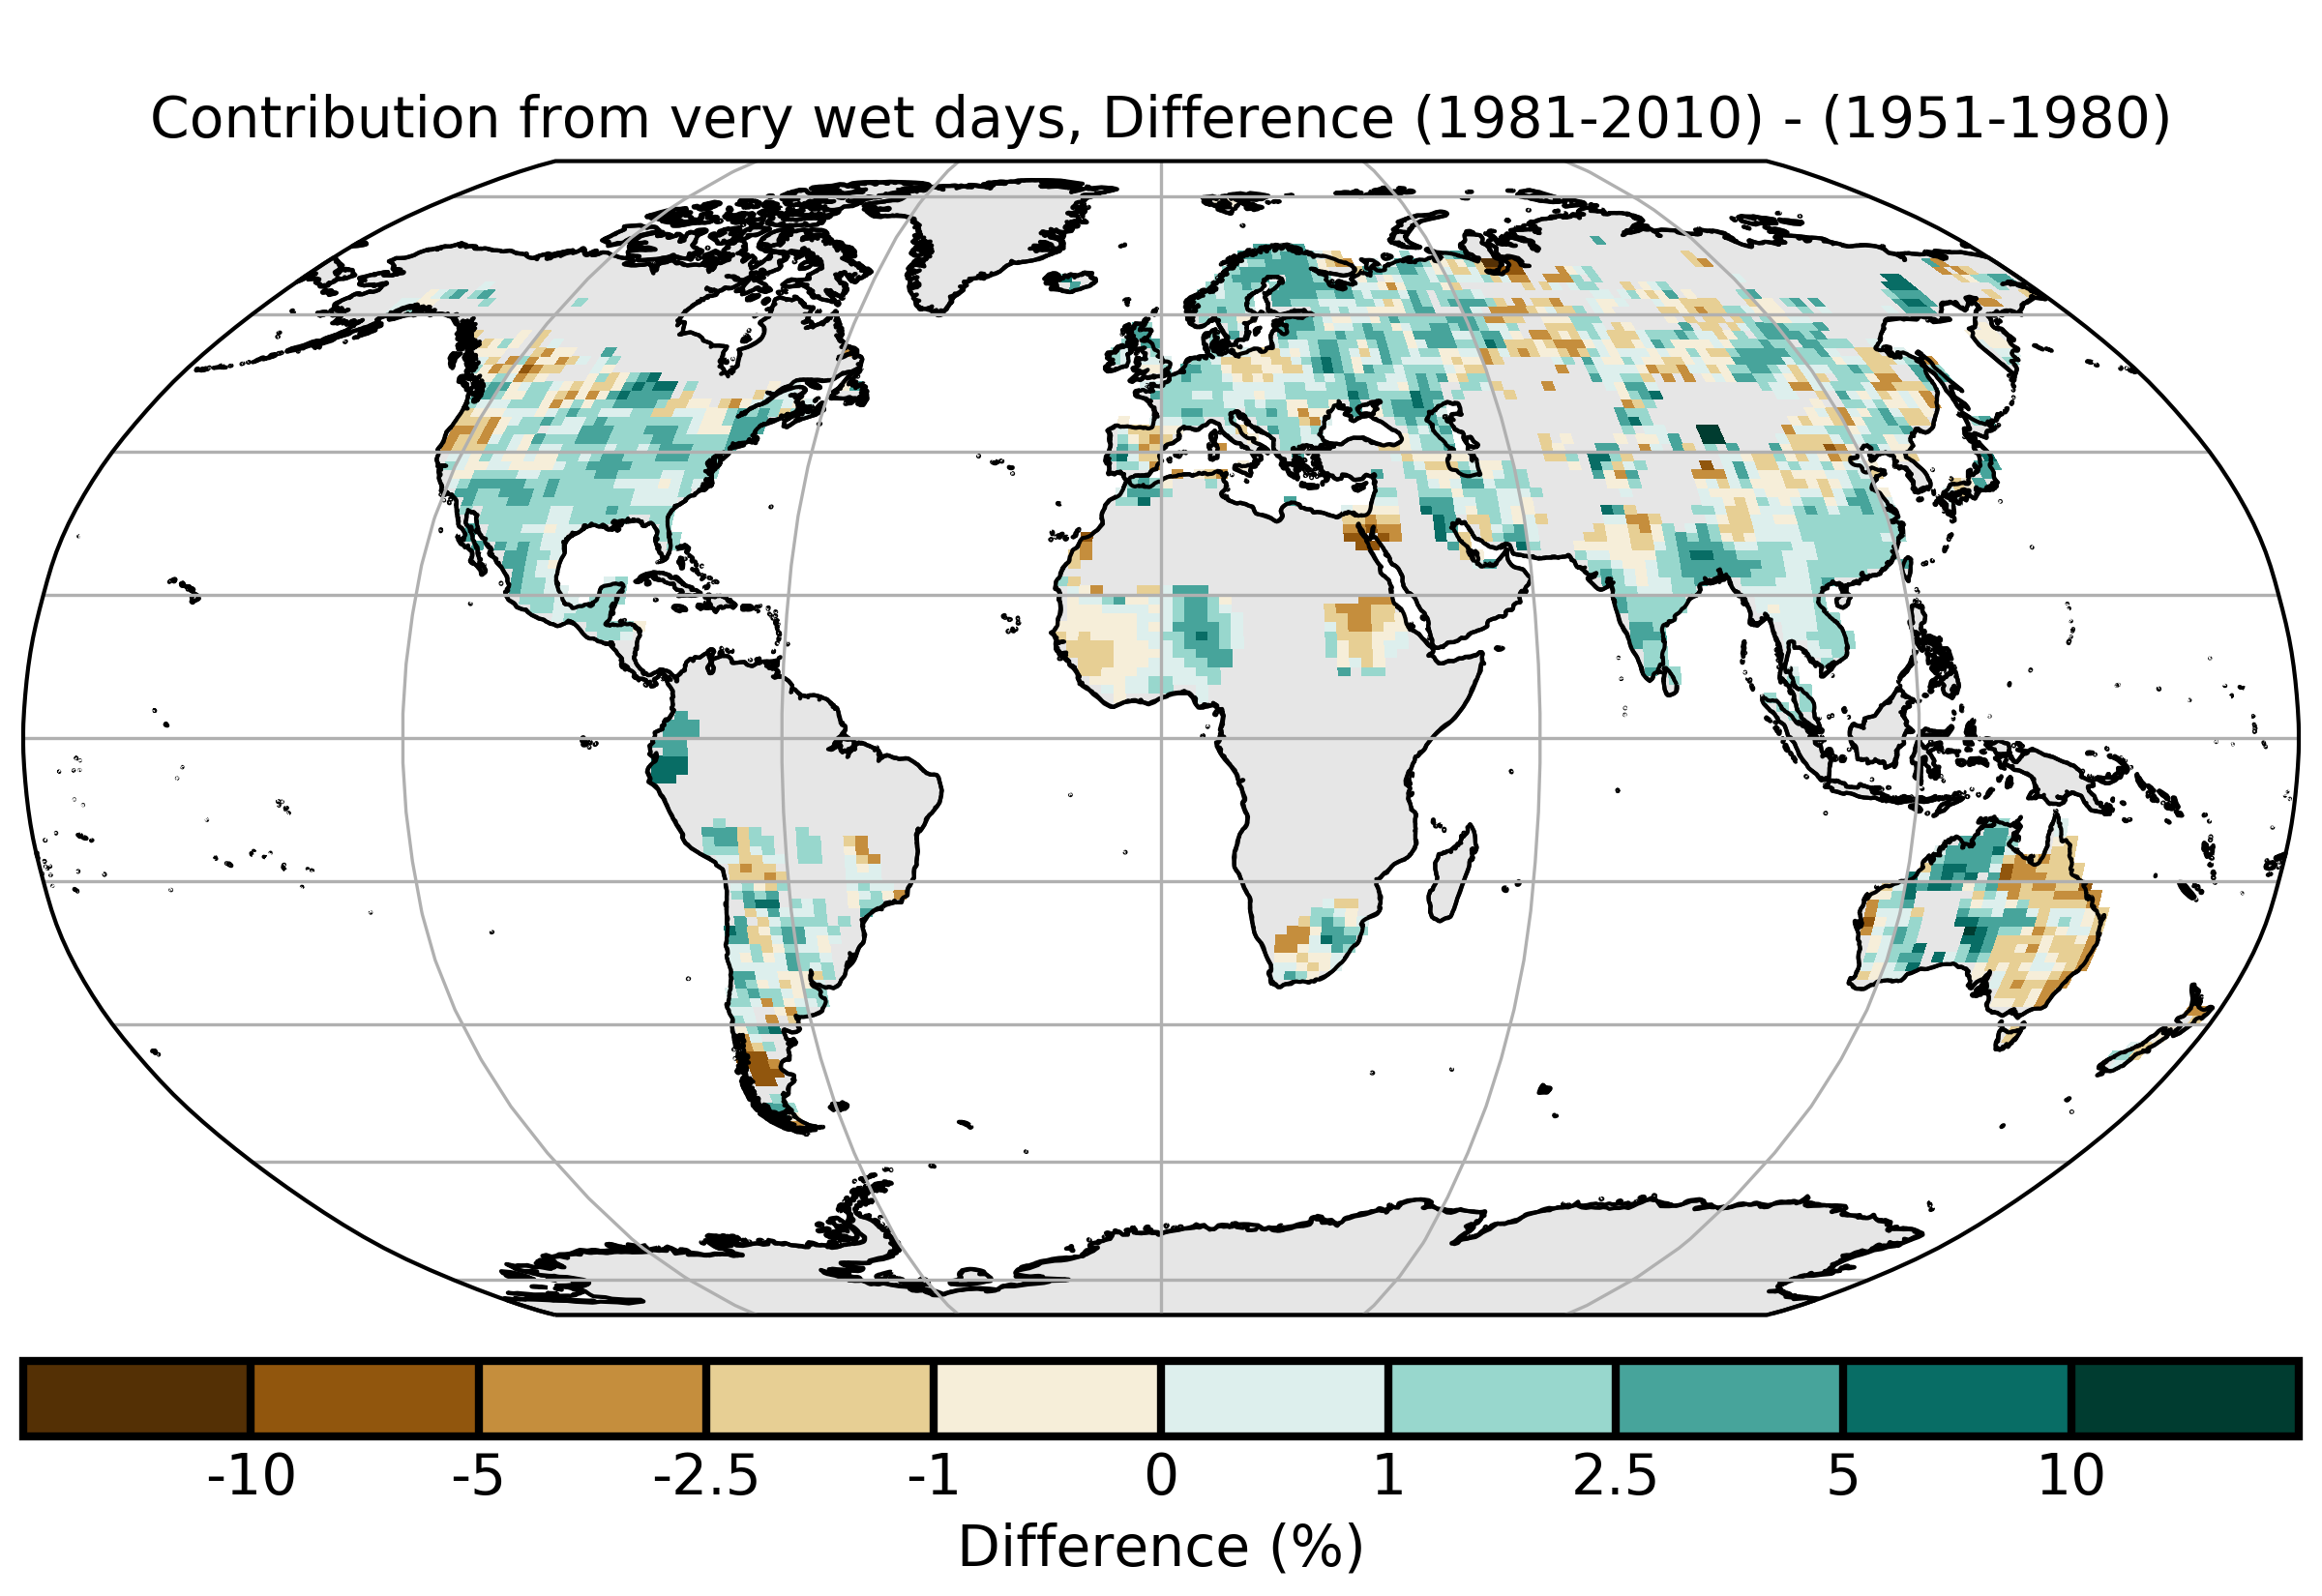
The variability of rainfall over space and time tends to be greater than temperature, so the trend is perhaps less clear, although there is a trend of an increasing contribution to total annual rainfall from very wet days, with an extra two per cent of precipitation falling compared to 1961-90.
The map above compares differences between two periods:1951-1980 and 1981-2010. Some areas such as the equatorial region of eastern South America and north of the Bay of Bengal seeing more rain failing in heavy events, but other areas such as eastern Australia have seen a corresponding decrease.
For a start, there is no evidence in the study quoted to justify such a claim. All the study does is to analyse changes between two periods, 1961-90 and 1981-2010. Just because it has become wetter in some areas. for instance, does not mean that trend will continue. Indeed, many of these changes are connected to multidecadal ocean cycles, so it is likely they could actually reverse.
More importantly though, there are two sides to every coin. Summer days may be slightly hotter in a warmer climate, but as the article also points out:
Corresponding decreases in cool weather events along with changes to dry spells are also expected.
In other words, “extreme weather events are not increasing”. There may be more heatwaves, but equally there will be fewer extreme cold spells.
The same applies to rainfall. Some areas may be wetter, but that also means that there is less drought.
The map shows this well, with notably heavier rain across the US and Sahel. Far from being “extreme weather”, this has actually relieved severe drought in both regions. India as well is another country which suffered long and severe droughts in the 1960s and 70s.
The Met Office, of course, have been trying to sell the extreme weather scare for years now. Shoddy misinterpretation of what the data actually says is sadly par for the course.
Holistic study charts effects of the coronavirus on sectors and regions globally
University of Sydney
Global impacts from the COVID-19 pandemic broken down by world region. view more Credit: University of Sydney
The first comprehensive study of the pandemic shows consumption losses amount to more than US$3.8 trillion, triggering full-time equivalent job losses of 147 million and the biggest-ever drop in greenhouse gas emissions.
The international group of researchers, using a global and highly detailed model, found that most directly hit was the travel sector and regions of Asia, Europe, the United States, with cascading multiplier effects across the entire world economy because of globalisation.
The loss of connectivity imposed to prevent the virus spreading triggers an economic ‘contagion’, causing major disruptions to trade, tourism, energy and finance sectors, while easing environmental pressures most in some of the hardest-hit areas.
This study focuses on ‘live’ data to 22 May (with the exception of air travel, for which only a 12-month forecast exists), differing from most assessments of the economic impacts of the pandemic based on scenario analyses and/or projections – and it is the first to provide an overview of the combined economic, social and environmental impacts, including indirect effects, of the coronavirus.
The findings publish today in the international scientific journal PLOS ONE.
KEY REDUCTIONS:
– Consumption: US$3.8 trillion (4.2 percent ~ GDP of Germany)
– Jobs: 147m (4.2 percent of the global workforce)
– Income from wages and salaries: $2.1 trillion (6 percent)
– Most directly hit: US, China (mainland), air transport and related tourism
– Greenhouse gas emissions: 2.5Gt (4.6 percent) – larger than any drop in human history*
– Other atmospheric emissions – PM2.5: Dangerously fine particulate matter emissions fall 0.6 Mt (3.8 percent); SO2 & NOx: Sulfur dioxide emissions from burning fossil fuels – which has been linked to asthma and chest tightness – and emissions from nitrogen oxide – from fuel combustion, for example, driving cars – fall 5.1 Mt (2.9 percent).
Corresponding author Dr Arunima Malik, from Integrated Sustainability Analysis (ISA) and University of Sydney Business School, said the experience of previous financial shocks showed that, without structural change, environmental gains were unlikely to be sustained during economic recovery.
“We are experiencing the worst economic shock since the Great Depression, while at the same time we have experienced the greatest drop in greenhouse gas emissions since the burning of fossil fuels began,” Dr Malik said.
“In addition to the sudden drop in climate-change inducing greenhouse gasses, prevented deaths from air pollution are of major significance.
“The contrast between the socio-economic and the environmental variables reveals the dilemma of the global socio-economic system – our study highlights the interconnected nature of international supply chains, with observable global spillover effects across a range of industry sectors, such as manufacturing, tourism and transport.”
The University of Sydney Vice-Chancellor Dr Michael Spence said it was wonderful to see significant applications come to life through a collaborative platform seeded a decade ago with University of Sydney funding.
“Thanks to pioneering work here at Sydney in collaboration with other world leaders in footprinting, it’s now possible to simulate the world economy quickly and accurately to see how society and the environment are impacted by changes in our consumption,” Dr Spence said.
“This research was conducted in the cloud-based Global MRIO Lab and it is these sorts of global, multidisciplinary collaborations that will help us tackle the complex issues of our time.”
RESEARCH USING THE GLOBAL MRIO LAB:
To chart the world economy and post-disaster impacts using global multi-regional input-output (MRIO) analysis or GMRIO, researchers worked in the open-source Global MRIO Lab. This customisable database is an extension of the Australian Industrial Ecology Lab (IE Lab) led by the University of Sydney.
The advancement of GMRIO has underpinned the increasing popularity and uptake of so-called consumption-based accounting, or footprinting, which avoids loopholes such as ‘carbon leakage’ where pollution is externalised to the producers, rather than consumers of goods and services. The Global MRIO Lab includes data from statistical agencies, including National Accounts and Eurostat and international trade data such as UN Comtrade. The lab is powered by supercomputers calculating the impacts of international trade along billions of supply chains extending to 221 countries.
Input-output (I-O) models were developed in the 1930s by Nobel Prize Laureate Wassily Leontief to analyse the relationships between consumption and production in the economy; I-O or multi-regional input-output (MRIO) models take account of actual data, from I-O records worldwide. Global MRIO or GMRIO models now not only extend to global value chains (GVCs) incorporating all orders of production but are also able to answer flexible and complex questions to a high degree of accuracy within a relatively short time lag. Once assembled, tables can be quickly updated, limited only by the timeliness of the data to hand.
Lead author Professor Manfred Lenzen, also from ISA and a recent co-author of the “Scientists’ warning on affluence“, said that the Australian-funded and University of Sydney-led innovation of the IO Labs had really catalysed new research efficiency in Australia. “Whilst the Labs were initially developed by a dedicated team from eight Universities and the CSIRO, supported by the Australian Bureau of Statistics, there are now hundreds of users, answering questions ranging from building sustainable cities, avoiding food waste, and carbon-footprinting tourism, to hedging against major disasters such as tropical cyclones,” said Professor Lenzen.
For this study into COVID-19, 38 regions in the world were analysed and 26 sectors. In order to incorporate as much information as possible, co-authors were allocated countries with which they had language skills and familiarity, with data translated from sources in 12 languages ranging from Arabic to Hindi and Spanish.
The international team of researchers are from: University of Sydney; Edinburgh Napier University; University of Queensland; UNSW Sydney; Ministry of Finance of the Republic of Indonesia; National Institute for Environmental Studies & Research Institute for Humanity and Nature, Japan; Yachay Tech University, Ecuador; Duke University; Beijing Normal University.
* Previous significant drops in greenhouse gas emissions were during the global financial crisis in 2009 (0.46Gt) and as a result of land-use changes (under the Kyoto Protocol) in 1998 (2.02Gt).
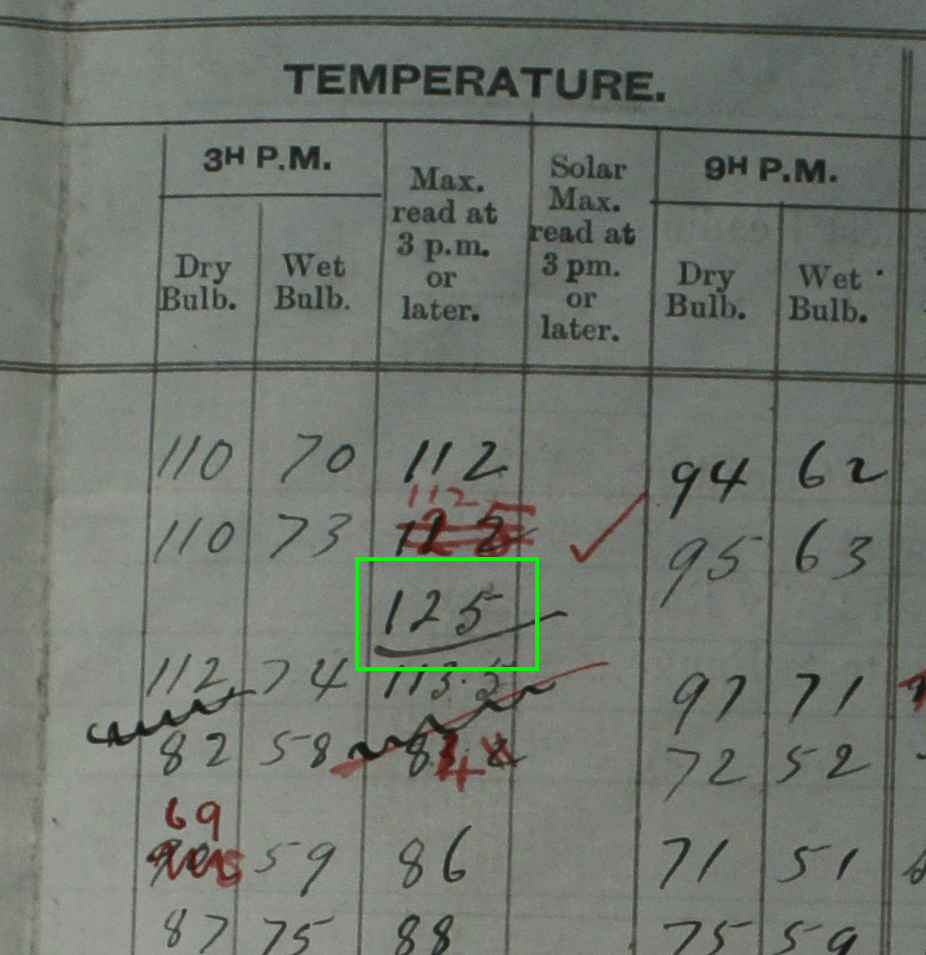
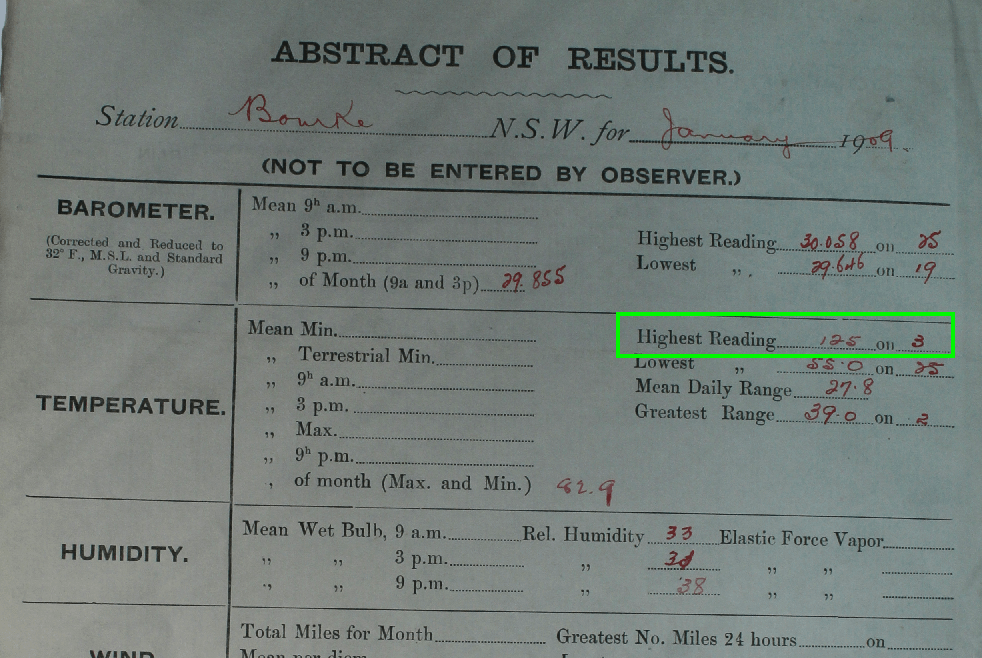
The Australian Bureau of Meteorology deleted what was long regarded as the hottest day ever recorded in Australia – Bourke’s 125°F (51.7°C) on the 3rd January 1909. This record* was deleted, falsely claiming that this was likely some sort of observer error, as no other official weather stations recorded similar high temperatures on that day.
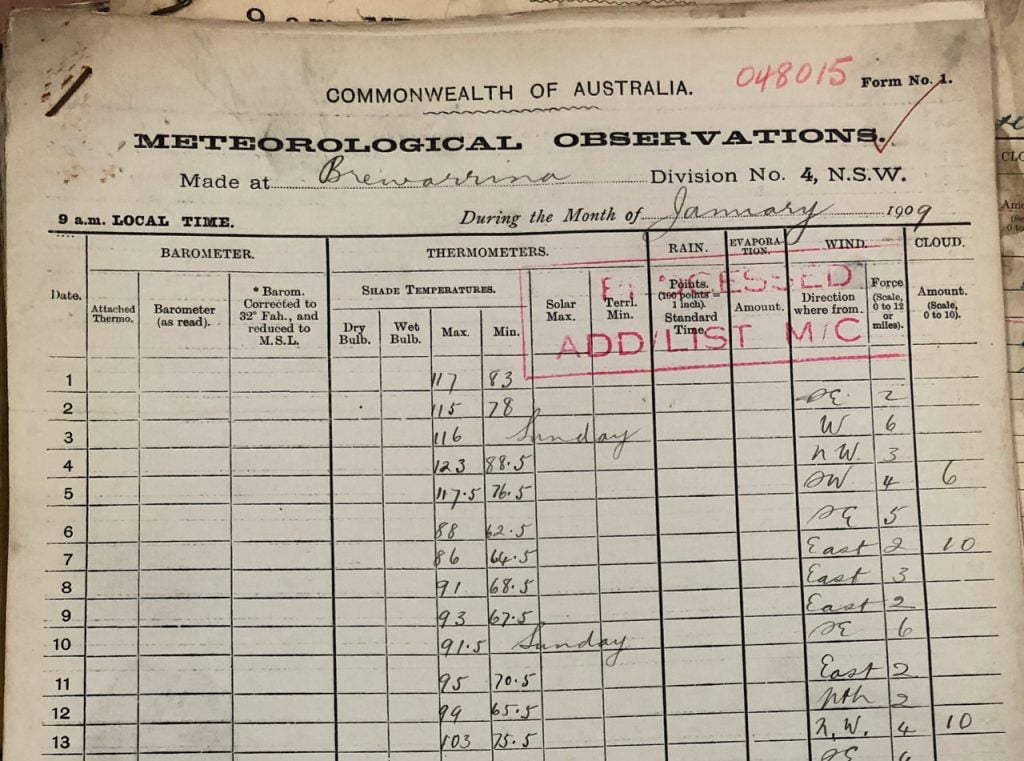
However, Craig Kelly MP has visited the Australian National Archive at Chester Hill in western Sydney to view very old meteorological observation books. It has taken Mr Kelly MP some months to track down this historical evidence. Through access to the archived book for the weather station at Brewarrina, which is the nearest official weather station to Bourke, it can now be confirmed that a temperature of 50.6°C (123°F) was recorded at Brewarrina for Sunday 3rd January 1909. This totally contradicts claims from the Australian Bureau of Meteorology that only Bourke recorded an extraordinarily hot temperature on that day.
Brewarrina Meteorological Observations Book, January 1909 — photographed by Craig Kelly MP. Note 123F recorded at 9am on 4th January 1909.
Just today, Friday 10th July 2020, Mr Kelly MP obtained access to this record for Brewarrina, the closest station to Bourke Post Office.
He has photographed the relevant page from the observations book, and it shows 123°F was recorded at 9am on the morning of Monday 4th January 1909 – published here for the first time. This was the highest temperature in the previous 24 hours and corroborates what must now be recognised as the hottest day ever recorded in Australia of 51.7°C (125°F) degrees at Bourke on the afternoon of Sunday 3rd January 1909.
The Meteorological Observations Book for Bourke for January 1909 records 125F for 3rd January. Photograph taken on 26th June in 2014 at the Chester Hill archive by Jennifer Marohasy.
That the Bureau of Meteorology denies these record hot days is a travesty. It is because these records contradict their belief in catastrophic human-caused global warming.
The temperature of 50.6°C (123°F) recorded back in 1909 which is more than 100 years ago, photographed by Mr Kelly today at the National Archives in Chester Hill, is almost equivalent to the current official hottest day ever for Australia of 50.7 degrees Celsius at Oodnadatta on 2nd January 1960. These are in fact only the fourth and third hottest days recorded in Australia, respectively.
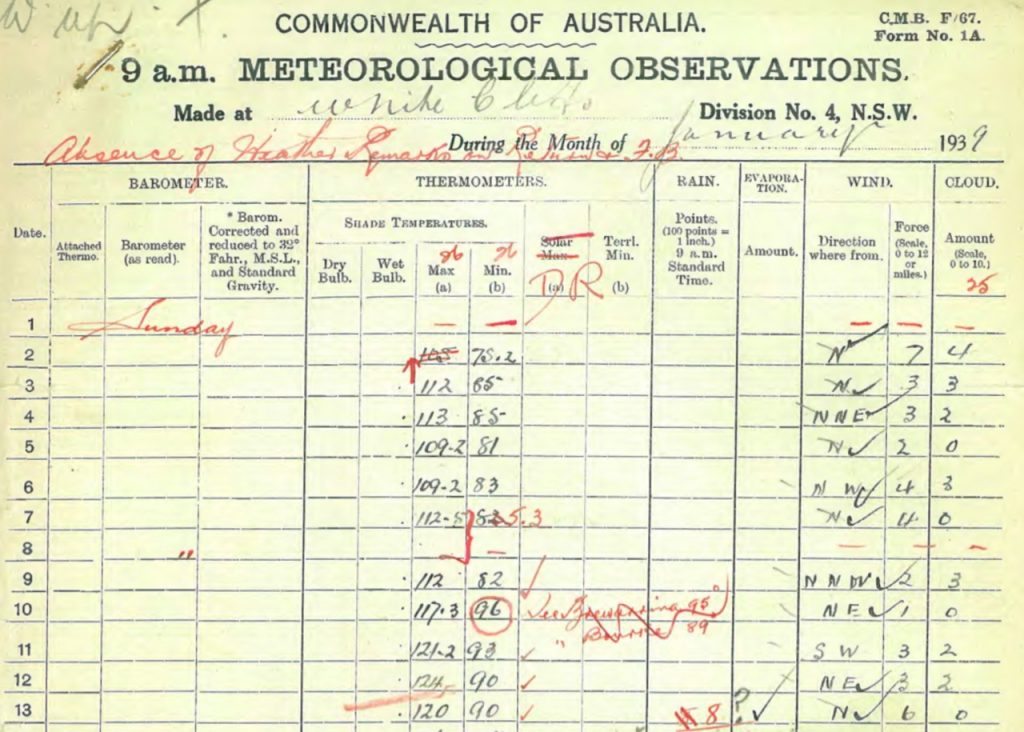
Not only has Mr Kelly MP tracked-down the meteorological observations book for Brewarrina, but over the last week he has also uncovered that 51.1°C (124°F) was recorded at White Cliffs for Wednesday 11th January 1939. This is the second hottest ever!
The evidence, a photograph from the relevant page of the White Cliff’s meteorological observations book, is published here for the first time.
This photograph from the White Cliffs Meteorological Observation Book shows the second hottest temperature ever recorded in Australia using standard equipment in a Stevenson screen.
Until the efforts of Mr Kelly MP, this second hottest-ever record was hidden in undigitised archives.
It is only through the persistence of Mr Kelly to know the temperatures at all the official weather stations in the vicinity of Bourke that this and other hot days have been discovered.
If we are to be honest to our history, then the record hot day at Bourke of 51.7°C (125°F) must be re-instated, and further the very hot 50.6°C (123°F) recorded at Brewarrina on the same day must be entered into the official databases.
Also, the temperature of 51.1°C (124°F) recorded at White Cliffs on 12th January 1939 must be recognised as the second hottest ever.
For these temperatures to be denied by the Bureau because they occurred in the past, before catastrophic human-caused global warming is thought to have come into effect, is absurd.
At a time in world history when Australians are raising concerns about the Chinese communist party removing books from Libraries in Hong Kong, we should be equally concerned with the Australian Bureau of Meteorology removing temperature records from our history.
If global warming is indeed the greatest moral issue of our time, then every Australian regardless of their politics and their opinion on greenhouse gases and renewable energies, must be honest to history and these truths.
____
* This temperature (125°F/51.7°C on the 3rd January 1909) was recorded at an official Bureau weather station and using a mercury thermometer in a Stevenson screen. Hotter temperatures were recorded in 1896 but the mercury thermometers were not in Stevenson screens, which is considered the standard for housing recording equipment.
The feature image shows Craig Kelly MP at The Australian National Archive, Chester Hill, just today examining the Brewarrina Meteorological Observations book.