Spare a thought for people living in China. There have been 31 days of rain, leading to mass flooding, mudslides, a few minor earthquakes, and some ominous warnings like in #Chongqing city, where people have been told they need to be “above the third floor” and to prepare for floods that might reach 193m (which does not add up). There is chatter on social media ( and a few news outlets) wondering if the ThreeGorgesDam is about to break. The chatter has been building for a week and it’s so serious that Chinese government have officially said it’s nonsense.
In the last hours the normal inflow data for the dam has stopped being publicly updated. A glitch maybe.
As Kate says at SmallDeadAnimals. It’s probably nothing.
The Epoch Times: Floods in China reach biblical proportions
Rains have lasted over 30 days and are continuing. And many other disasters are hitting at once including tornadoes, hailstorms, torrents, mudslides, and earthquakes — in addition to a possible new virus outbreak from the swine flu, and also expected locusts.
The Epoch Times is outspokenly anti-communist, connected with the Falun Gong and is banned inside China.
Joe Biden has picked Carol Browner as a climate advisor. Browner was the Clinton EPA chief and Obama energy and environment czar. JunkScience.com fans will recall that in 2009 we exposed Browner’s leadership position in Socialist International. Below is a pic of Brpwner addressing a 2008 Socialist International convention. Green is the new red!
For the last 10 years I have consulted for grain growing interests, providing information about past and potential future trends in growing season weather that might impact crop yields. Their primary interest is the U.S. corn belt, particularly the 12 Midwest states (Iowa, Illinois, Indiana, Ohio, Kansas, Nebraska, Missouri, Oklahoma, the Dakotas, Minnesota, and Michigan) which produce most of the U.S. corn and soybean crop.
Contrary to popular perception, the U.S. Midwest has seen little long-term summer warming. For precipitation, the slight drying predicted by climate models in response to human greenhouse gas emissions has not occurred; if anything, precipitation has increased. Corn yield trends continue on a technologically-driven upward trajectory, totally obscuring any potential negative impact of “climate change”.
What Period of Time Should We Examine to Test Global Warming Claims?
Based upon the observations, “global warming” did not really begin until the late 1970s. Prior to that time, anthropogenic greenhouse gas emissions had not yet increased by much at all, and natural climate variability dominated the observational record (and some say it still does).
Furthermore, uncertainties regarding the cooling effects of sulfate aerosol pollution make any model predictions before the 1970s-80s suspect since modelers simply adjusted the aerosol cooling effect in their models to match the temperature observations, which showed little if any warming before that time which could be reasonably attributed to greenhouse gas emissions.
This is why I am emphasizing the last 50 years (1970-2019)…this is the period during which we should have seen the strongest warming, and as greenhouse gas emissions continue to increase, it is the period of most interest to help determine just how much faith we should put into model predictions for changes in national energy policies. In other words, quantitative testing of greenhouse warming theory should be during a period when the signal of that warming is expected to be the greatest.
50 Years of Predictions vs. Observations
Now that the new CMIP6 climate model experiment data are becoming available, we can begin to get some idea of how those models are shaping up against observations and the previous (CMIP5) model predictions. The following analysis includes the available model out put at the KNMI Climate Explorer website. The temperature observations come from the statewide data at NOAA’s Climate at a Glance website.
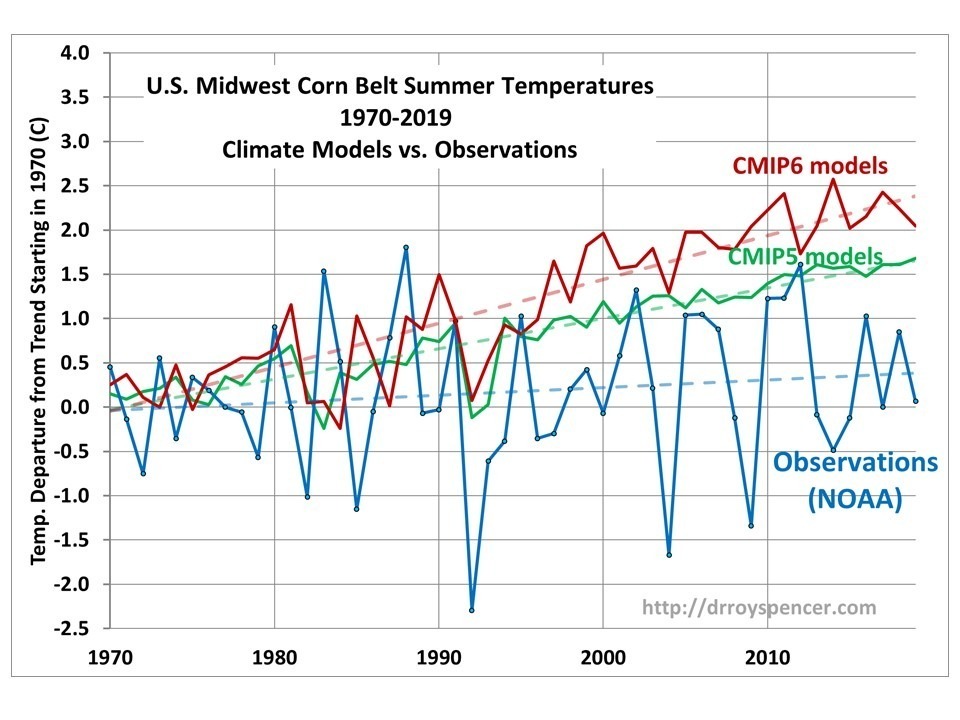
For the Midwest U.S. in the summer (June-July-August) we see that there has been almost no statistically significant warming in the last 50 years, whereas the CMIP6 models appear to be producing even more warming than the CMIP5 models did.
Fifty years (1970-2019) of U.S. corn belt summer (JJA) warming since 1970 from observations (blue); the previous CMIP5 climate models (42 model avg., green); and the new CMIP6 climate models (13 model avg., red). The three time series have been vertically aligned so their trend lines coincide in the first year (1970), which is the most meaningful way to quantify the long-term warming since 1970.
The observed 50-year trend is only 0.086 C/decade (barely significant at the 1-sigma level), while the CMIP5 average model trend is 4X as large at 0.343 C/decade, and the CMIP6 trend is 5.7X as large at 0.495 C/decade. While the CMIP6 trend will change somewhat as more models are added, it is consistent with the report that the CMIP6 models are producing more average warming than their CMIP5 predecessors.
I am showing the average of the available models rather than individual models, because it is the average of the models which guides the UN IPCC reports and thus energy policy. It is disingenuous for some to claim that “not all IPCC models disagree with the observations”, as if that is some sort of vindication of all the models. It is not. If there are one or two models that agree the best with observations, why isn’t the IPCC just using those to write its reports? Hmmm?
What I find particularly troubling is that the climate modelers are increasingly deaf to what observations tell us. How can the CMIP5 models (let alone the newer CMIP6 models) be used to guide U.S. energy policy when there is such a huge discrepancy between the models and the observations?
I realize this is just one season (summer) in one region (the U.S. Midwest), but it is immensely important. The U.S. is the world leader in production of corn (which is used for feed, food, and fuel) and behind only Brazil in soybean production. Blatantly false claims (e.g. here) of observed change in Midwest climate have fed the popular opinion that U.S. crops are already feeling the negative effects of human-caused climate change, despite the facts.
This is just one example of many that the news media have been complicit in the destruction of rational climate debate, which is now extending to outright censoring of alternative climate views on not only social media, but also in mainstream news sources like Forbes which disappeared environmentalist Michael Shellenberger’s op-ed in which he confessed he no longer believes in a “climate crisis”.
South Africa’s farms are producing near-record amounts of food right now
According to Tonie Fuchs, Managing Director at Capespan Group Limited, it’s been a good season for South Africa so far. He claims that South Africa’s wildly productive farms’ are keeping the nation afloat.
“Large harvests are the order of the day right now, and agriculture is thriving – it grew by 28% in the first quarter of 2020 while the economy shrunk by 2%. Agricultural economists expect the second-largest grain harvest in the country’s history while the maize harvest is forecast to be 38% larger than in 2019.”
“The country’s fruit farms are also having good harvests, with citrus production up 13%. … With Europe starting to open, exports are increasing, despite problems at the ports.”





 Iowa Climate Science Education