Apocalypse Never: Why Environmental Alarm Hurts Us All, by Michael Schellenberger [amazon] ‘Best Seller’
Schellenberger’s op-ed: On Behalf of Environmentalists I Apologize For the Climate Scare [link] originally published at Forbes, but then they pulled it.
I’ve read both books, well worth reading. Refreshing and complementary perspectives.
Seems like Schellenberger is taking more ‘heat’ from the usual consensus enforcers; apparently they figure that that they’ve already sufficiently dismissed Lomborg as a ‘denier.’
Not sure how much bandwidth there is for climate change at the moment, but it seems the sales especially for Schellenberger’s book are really taking off.
A Melbourne law student is suing the Australian Government for not applying government climate disclosure regulations to the government’s own financial operations.
Australian Government sued by 23-year-old Melbourne student over financial risks of climate change
By national science, technology and environment reporter Michael Slezak and the Specialist Reporting Team’s Rahni Sadler
A 23-year-old Melbourne law student is suing the Australian Government for failing to disclose the risk climate change poses to Australians’ super and other safe investments.
The world-first case filed on Wednesday in the Federal Court alleges the Government, as well as two government officials, failed in a duty to disclose how climate change would impact the value of government bonds.
Katta O’Donnell, the head litigant for the class action suit, said she hoped the case would change the way Australia handled climate change.
“I’m suing the Government because I’m 23 [and] I think I need to be aware of the risks to my money and to the whole of society and the Australian economy,” Ms O’Donnell said.
“I think the Government needs to stop keeping us in the dark so we can be aware of the risks that we’re all faced with.”
Experts say it is the first where a national government has been sued for its lack of transparency on climate risks.
…
Ms O’Donnell’s lawyer, David Barnden from Equity Generation Lawyers, said the duty to be transparent extended to the Government.
“We allege that the Government is misleading and deceiving investors by not telling them about the risks,” Mr Barnden said.
“We don’t see any disclosure to investors about the risks that climate change poses to bonds and to society as a whole. So it certainly appears as though there is a double standard.”
I wonder if California and other green US states apply the climate disclosure rules they inflict on others to their own debt instruments?
This lawsuit like other climate litigation is based on the absurd premise that anthropogenic climate change is significant threat.
But it is hilarious to see someone attacking governments with their own green virtue signalling. If the lawsuit succeeds, and if applying climate disclosure rules drives up the cost of government borrowing, it will likely be the death of climate disclosure rules.
“Hooray for the Hols!”cried Greta, tossing her plaits joyfully over her shoulders:
“No more Latin, no more Greek, / No more freezing my arse off sitting on a cold pavement holding a placard reading Klimastreik!” (It sounded better in Swedish, of course.)
There were five of them. Greta, just seventeen, was the youngest. Then came the two Belgians Anuna de Wever, nineteen, and Adelaïde Charlier, twenty. The German Luisa Neubauer, at twenty four, was the wise old woman of the group.
Old McKibben the handyman came trundling up the path. He’d packed the girls’ trunks and loaded them into the caravan – all except for Luisa’s. (She was a little older than the others, and managed to pack her own trunks very nicely thank you.)
“Ere y’are missies. Don’t be gettin’ into any mischief now, and mind you takes care of old Deben ‘ere, and see ‘e gets plenty of ‘ay and oats.” Deben the Donkey hee-hawed as only Deben could, farted and staled on McKibben’s boot. Greta gave Deben a hard prod with the whip, and the caravan set off. Old McKibben pulled out a soiled handkerchief and blew his nose loudly, trying unsuccessfully to hide a tear.
From the steps of the Great Hall Anuna’s mother Katrien Van der Heyden waved distractedly, before returning to her studies of gender equality, diversity and climate change. Her second daughter [1]Anuna had been a subject of academic interest to her when, at the age of two, she had declared she wanted to be a boy. Aruna had now renounced all gender, much to the chagrin of her mother, since it left her nothing to study. Her father Harwin de Wever, who had been let out of the cellar specially, gazed blankly at the parting caravan before descending to his den. [2]
Four girls – but who was the fifth member of the Famous Five? Why, dear old George of course, Greta’s faithful Welsh Terrier – mangey and getting on a bit now, but still playful as a puppy when in the presence of his Mistress, whomhe adored. [3]
They made good progress that day through a landscape that recalled the imaginary worlds they’d read about in the books that elderly aunts had regaled them with in their childhood – Tove Jansson, Tolkien, Rupert Bear [5] – before stopping for the night in a leafy lay-by.
As they were sitting round the dying embers of the camp fire, with George sprawled at Greta’s feet, Greta suddenly broke the silence with: “Beg dog, beg!” and George obediently turned on his back with his paws in the air, pleading to have his tummy tickled. Greta took a charred stick from the fire to satisfy his desires,rubbing it violently across the hound’s exposed abdomen.
“There! How do you like it?”
“Ruff! Ruff!”
“Men!” sighed the slender adolescent, as if drawing on aeons of innate female experience. Then she suddenly got serious:
“Guys! Don’t forget that we’re not here on a holiday. The end of the world is no picnic. It’s up to us four…”
“Foonf!” snorted George.
“… sorry, us five – to find a way to stop the world from overheating by a whole degree Centigrade…”
“Arff! Arff!” George interjected.
“..oh, very well, 0.5°C, you old fusspot. Now kindly shut up.”
And without further ado, the four chums got down to discussing climate chaos, ecocide, and animal rights. George, realising that the discussion didn’t apply to him, soon got bored and went off to sniff the environment. He circled the caravan three times before deciding on the right rear wheel of the caravan, where he casually lifted a hind leg and left his calling card.
That night, curled up on the bottom half of his mistress’s sleeping bag, George had a strange dream.
George was lying on the river bank, getting rather tired of leafing through IPCC AR5 WG1, [4] for it had no predictions of imminent catastrophe in it “and what’s the point of a peer reviewed official intergovernmental report without predictions of imminent catastrophe?” thought George.
So he was considering, as well as he could (for global heating was making him feel very sleepy and stupid) whether it was worth the trouble of changing his position to lick his privates (given the absence of anyone likely to appreciate his efforts) when suddenly a white bunny rabbit with pink eyes and plaits ran close by him.
Therewas nothing so very remarkable in that: nor did George think it so very much out of the way to hear the bunny say to itself: “Knulla mig! I’m late! Too late to save the planet!” But when the bunny took an i-phone out of its backpack and started texting the leaders of the free world, George ceased his licking and bounded after the rodent. For a hot bunny with an i-phone was one thing, but one with a line to the leaders of the free world was another, and, burning with curiosity, he ran across the field after it, and was just in time to see it pop down a large rabbit hole under the hedge.
In another moment down went George after it, never once considering how in the world he was to get out again. The rabbit hole went straight on like a tunnel for some way, and then dipped suddenly down, and George found himself falling, falling…
George let out a tremendous howl, and Greta woke with a start. “What’s that noise?” she asked.
“It’s only George. He’s barking,” murmured Anuna from the next bunk.
“I know, but what’s that noise?” repeated the frail young Swede.
[to be continued]
[1] Or first – who knows? -Anuna has a twin sister.
Anuna’s father Harwin is an “urbanist” (town planner.) He has no internet presence. Katrien seems to be married to someone called Peter. There are five Peter de Wevers listed at LinkedIn, one of whom describes himself as a “bus analist.” I don’t think that’s him.
The Youth Strike 4 Climate gives me more hope than I have felt in 30 years of campaigning. Before this week, I believed it was all over. I thought .. that climate breakdown and ecological collapse were inevitable … we created a cannibal economy: we ate your future to satisfy our greed… ours is a society of altruists governed by psychopaths… we have bequeathed you a world that… may soon become uninhabitable. The disasters I feared my grandchildren would see in their old age are happening already.. But those of us who have long been engaged in this struggle will not abandon you… we will stand in solidarity with you. Though we are old and you are young, we will be led by you… Together, we will build a movement that must – and will – become irresistible.
Links are provided at the end to previous posts describing climate models 4 and 5 from the Institute of Numerical Mathematics in Moscow, Russia. Now we have forecasts for the 21st Century published for INM-CM5 at Izvestiya, Atmospheric and Oceanic Physics volume 56, pages218–228(July 7, 2020). The article is Simulation of Possible Future Climate Changes in the 21st Century in the INM-CM5 Climate Model by E. M. Volodin & A. S. Gritsun. Excerpts are in italics with my bolds, along with a contextual comment.
Abstract
Climate changes in 2015–2100 have been simulated with the use of the INM-CM5 climate model following four scenarios: SSP1-2.6, SSP2-4.5, and SSP5-8.5 (single model runs) and SSP3-7.0 (an ensemble of five model runs). Changes in the global mean temperature and spatial distribution of temperature and precipitation are analyzed. The global warming predicted by the INM-CM5 model in the scenarios considered is smaller than that in other CMIP6 models. It is shown that the temperature in the hottest summer month can rise more quickly than the seasonal mean temperature in Russia. An analysis of a change in Arctic sea ice shows no complete Arctic summer ice melting in the 21st century under any model scenario. Changes in the meridional stream function in atmosphere and ocean are studied.
Overview
The climate is understood as the totality of statistical characteristics of the instantaneous states of the atmosphere, ocean, and other climate system components averaged over a long time period.
Therefore, we restrict ourselves to an analysis of some of the most important climate parameters, such as average temperature and precipitation. A more detailed analysis of individual aspects of climate change, such as changes in extreme weather and climate situations, will be the subject of another work. This study is not aimed at a full comparison with the results of other climate models, where calculations follow the same scenarios, since the results of other models have not yet been published in peer reviewed journals by the time of this writing.
The INM-CM5 climate model [1, 2] is used for the numerical experiments. It differs from the previous version, INMCM4, which was also used for experiments on reproducing climate change in the 21st century [3], in the following:
an aerosol block has been added to the model, which allows inputting anthropogenic emissions of aerosols and their precursors;
the concentrations and optical properties of aerosols are calculated, but not specified, like in the previous version;
the parametrizations of cloud formation and condensation are changed in the atmospheric block;
the upper boundary in the atmospheric block is raised from 30 to 60 km;
the horizontal resolution in the ocean block is doubled along each coordinate; and,
the software related to adaptation to massively parallel computers is improved, which allows the effective use a larger number of compute cores.
The model resolution in the atmospheric and aerosol blocks is 2° × 1.5° in longitude and latitude and 73 levels and, in the ocean, 0.5° × 0.25° and 40 levels. The calculations were performed at supercomputers of the Joint Supercomputer Center, Russian Academy of Sciences, and Moscow State University, with the use of 360 to 720 cores. The model calculated 6–10 years per 24 h in the above configuration.
Four scenarios were used to model the future climate: SSP1-2.6, SSP2-4.5, SSP3-7.0, and SSP5-5.8. The scenarios are described in [4]. The figure after the abbreviation SSP (Shared Socioeconomic Pathway) is the number of the mankind development path (see the values in [4]). The number after the dash means the radiation forcing (W m–2) in 2100 compared to the preindustrial level. Thus, the SSP1-2.6 scenario is the most moderate and assumes rapid actions which sharply limit and then almost completely stop anthropogenic emissions. Within this scenario, greenhouse gas concentrations are maximal in the middle of the 21st century and then slightly decrease by the end of the century. The SSP5-8.5 scenario is the warmest and implies the fastest climate change. The scenarios are recommended for use in the project on comparing CMIP6 (Coupled Model Intercomparison Project, Phase 6, [5]) climate models. Each scenario includes the time series of:
carbon dioxide, methane, nitrous oxide, and ozone concentrations;
emissions of anthropogenic aerosols and their precursors;
the concentration of volcanic sulfate aerosol; and
the solar constant.
One model experiment was carried out for each of the above scenarios. It began at the beginning of 2015 and ended at the end of 2100. The initial state was taken from the so-called historical experiment with the same model, where climate changes were simulated for 1850–2014, and all impacts on the climate system were set according to observations. The results of the ensemble of historical experiments with the model under consideration are given in [6, 7]. For the SSP3-7.0 scenario, five model runs was performed differing in the initial data taken from different historical experiments. The ensemble of numerical experiments is required to increase the statistical confidence of conclusions about climate changes.
[Contextual Comment inserted Prior to Consideration of Results]
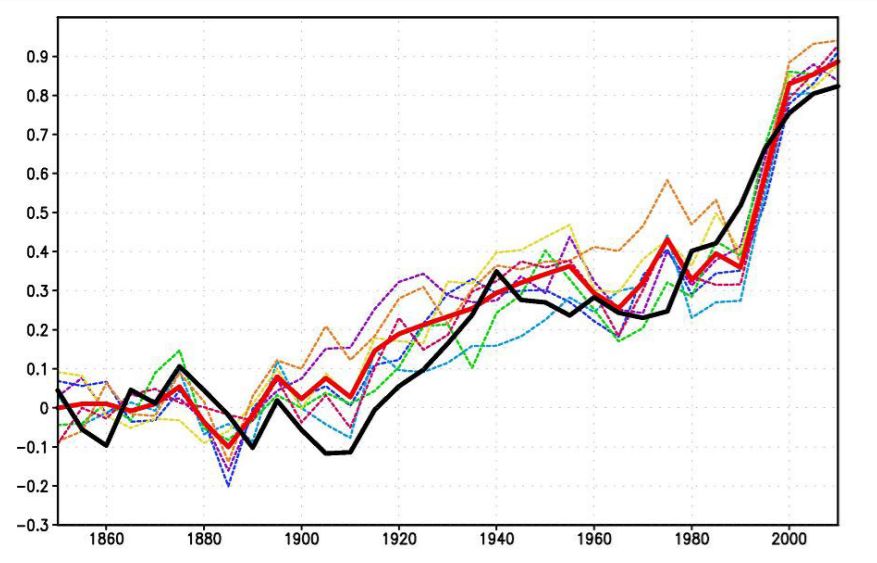
Firstly, the INM-CM5 historical experiment can be read in detail by following a linked post below, but this graphic summarizes the model hindcasting of past temperatures (GMT) compared to HadCrutv4.
Figure 1. The 5-year mean GMST (K) anomaly with respect to 1850–1899 for HadCRUTv4 (thick solid black); model mean (thick solid red). Dashed thin lines represent data from individual model runs: 1 – purple, 2 – dark blue, 3 – blue, 4 – green, 5 – yellow, 6 – orange, 7 – magenta. In this and the next figures numbers on the time axis indicate the first year of the 5-year mean.
Secondly, the scenarios are important to understand since they stipulate data inputs the model must accept as conditions for producing forecasts according to a particular scenario (set of assumptions). The document with complete details referenced as [4] is The Scenario Model Intercomparison Project (ScenarioMIP) for CMIP6.
All the details are written there but one diagram suggests the implications for the results described below.
Figure 5. CO2 emissions (a) and concentrations (b), anthropogenic radiative forcing (c), and global mean temperature change (d) for the three long-term extensions. As in Fig. 3, concentration, forcing, and temperature outcomes are calculated with a simple climate model (MAGICC version 6.8.01 BETA; Meinshausen et al., 2011a, b). Outcomes for the CMIP5 versions of the long-term extensions of RCP2.6 and RCP8.5 (Meinshausen et al., 2011c), as calculated with the same model, are shown for comparison.
As shown, the SSP1-26 is virtually the same scenario as the former RCP2.6, while SSP5-85 is virtually the same as RCP8.5, the wildly improbable scenario (impossible according to some analysts). Note that FF CO2 emissions are assumed to quadruple in the next 80 years, with atmospheric CO2 rising from 400 to 1000 ppm ( +150%). Bear these suppositions in mind when considering the INMCM5 forecasts below.
Results [Continuing From Volodin and Gritsun]
Fig. 1. Changes in the global average surface temperature (K) with respect to the pre-industrial level in experiments according to the SSP1-2.6 (triangles), SSP2-4.5 (squares), SSP3-7.0 (crosses), and SSP5-8.5 (circles) scenarios.
Let us describe some simulation results of climate change in the 21st century. Figure 1 shows the change in the globally averaged surface air temperature with respect to the data of the corresponding historical experiment for 1850–1899. In the warmest SSP5-8.5 scenario, the temperature rises by more than 4° by the end of the 21st century. In the SSP3-7.0 scenario, different members of the ensemble show warming by 3.4°–3.6°. In the SSP2-4.5 scenario, the temperature increases by about 2.4°. According to the SSP1-2.6 scenario, the maximal warming by ~1.7° occurs in the middle of the 21st century, and the temperature exceeds the preindustrial temperature by 1.4° by the end of the century.
[My comment: Note that the vertical scale starts with +1.0C ( not 1.3) as can be seen in the historical experiment. Thus an anomaly of 1.4C by 2100 is an increase of only 0.2C, while the SSP2-4.5 result adds 1.4C to the present].
The results for other CMIP6 models have not yet been published in peer-reviewed journals. However, according to the preliminary analysis (see, e.g., https://cmip6workshop19.sciencesconf.org/ data/Session1_PosterSlides.pdf, p.29), the INM-CM5 model shows the lowest temperature increase among the CMIP6 models considered for all the scenarios due to the minimal equilibrium sensitivity to the CO2 concentration doubling, which is ~2.1° for the current model version, like for the previous version, despite new condensation and cloud formation blocks. [For more on CMIP6 comparisons see post Climate Models: Good, Bad and Ugly]
Fig. 2. Differences between the annual average surface air temperatures (K) in 2071–2100 and 1981–2010 for the (a) SSP5-8.5 and (b) SSP1-2.6 scenarios.
The changes in the surface air temperature are similar for all scenarios; therefore, we analyze the difference between temperatures in 2071–2100 and 1981–2010 under the SSP5-8.5 and SSP1-2.6 scenarios (Fig. 2). The warming is maximal in the Arctic; it reaches 10° and 3°, respectively. Other features mainly correspond to CMIP5 data [8], including the INMCM4 model, which participates in the comparison. The warming on the continents of the Northern Hemisphere is about 2 times higher than the mean, and the warming in the Southern Hemisphere is noticeably less than in the Northern Hemisphere. The land surface is getting warmer than the ocean surface in all the scenarios except SSP1-2.6, because the greenhouse effect is expected to weaken in the second half of the 21st century in this scenario, and the higher heat capacity of the ocean prevents it from cooling as quickly as the land.
The changes in precipitation in December–February and June–August for the SSP3-7.0 scenario averaged over five members of the ensemble are shown in Fig. 4. All members of the ensemble show an increase in precipitation in the winter in a significant part of middle and high latitudes. In summer, the border between the increase and decrease in precipitation in Eurasia passes mainly around or to the north of 60°. In southern and central Europe, all members of the ensemble show a decrease in precipitation. Precipitation also increases in the region of the summer Asian monsoon, over the equatorial Pacific, due to a decrease in the upwelling and an increase in ocean surface temperature (OST). The distribution of changes in precipitation mainly corresponds to that given in [6, Fig. 12.22] for all CMIP5 models.
The change in the Arctic sea ice area in September, when the ocean ice cover is minimal over the year, is of interest. Figure 5 shows the sea ice area in September 2015–2019 to be 4–6 million km2 in all experiments, which corresponds to the estimate from observations in [11]. The Arctic sea ice does not completely melt in any of the experiments and under any scenario. However, according to [8, Figs. 12.28 and 12.31], many models participating in CMIP6, where the Arctic ice area is similar to that observed at the beginning of the 21st century, show the complete absence of ice by the end of the 21st century, especially under the RCP8.5 scenario, which is similar to SSP5-8.5.
The reason for these differences is the lower equilibrium sensitivity of the INM-CM5 model.
Note that the scatter of data between experiments under different scenarios in the first half of the 21st century is approximately the same as between different members of the ensemble under the SSP3-7.0 scenario and becomes larger only after 2070. The sea ice area values are sorted in accordance with the radiative forcing of the scenarios only after 2090. This indicates the large contribution of natural climate variability into the Arctic ice area. In the SSP1-2.6 experiment, the Arctic ice area at the end of the 21st century approximately corresponds to its area at the beginning of the experiment.
Climate changes can be also traced in the ocean circulation. Figure 6 shows the change in the 5-year averaged intensity of the Atlantic meridional circulation, defined as the maximum of the meridional streamfunction at 32° N. All experiments show a decrease in the intensity of meridional circulation in the 21st century and natural fluctuations against this decrease. The decrease is about 4.5–5 Sv for the SSP5-8.5 scenario, which is close to values obtained in the CMIP5 models [8, Fig. 12.35] under the RCP8.5 scenario. Under milder scenarios, the weakening of the meridional circulation is less pronounced. The reason for this weakening of the meridional circulation in the Atlantic, as far as we know, is not yet fully understood.
Conclusion
Numerical experiments have been carried out to reproduce climate changes in the 21st century according to four scenarios of the CMIP6 program [4, 5], including an ensemble of five experiments under the SSP3-7.0 scenario. The changes in the global mean surface temperature are analyzed. It is shown that the global warming predicted by the INM-CM5 model is the lowest among the currently published CMIP6 model data. The geographical distribution of changes in the temperature and precipitation is considered. According to the model, the temperature in the warmest summer month will increase faster than the summer average temperature in Russia.
None of the experiments show the complete melting of the Arctic ice cover by the end of the 21st century. Some changes in the ocean dynamics, including the flow velocity and the meridional stream function, are analyzed. The changes in the Hadley and Ferrel circulation in the atmosphere are considered.