Since the CDC, the FDA, and the NIH decided to withhold useful information and to give harmful advice to the public, the following is some commonsense advice for a COVID-19 prophylaxis. It is intended for adults.
If you belong to a risk group because of your age, specific health conditions, or professional activity, consider taking hydroxychloroquine (HCQ)
For the first 7 days: 200 mg HCQ + 100 mg Zinc, daily

After that: 200 mg HCQ weekly + 50 mg Zinc daily
A prophylactic effect is achieved after 5-7 days. It decreases the chances of contracting COVID-19 but does not guarantee immunity. Do not take HCQ if you have a history of retina diseases. Other contraindications exist. Consult your physician.
Take vitamin C, 1,000 mg twice a day.
Take cod liver oil Alternatively, or additionally, include wild caught salmon in your diet. Wild caught mackerel and other fatty fish are also beneficial.
Go out and catch some sunshine. In summer, 20-30 minutes of half body exposure per day should be enough for light skinned individuals. In the south, light skinned individuals should avoid peak UV times (11 am to 3 pm). Darker skinned individuals need more sun exposure. Avoid overexposure to the UV sunlight, as it decreases immunity.
Keep the indoor environment visited by more than one person warm, humid, and well ventilated. Temperatures 77°F (25°C) or higher and the humidity range 50-60% are recommended. If possible, use natural ventilation rather than air conditioning.
Find a physician who would prescribe you a hydroxychloroquine-based treatment for COVID-19 if you develop symptoms, without requiring test results. The tests waste precious time and return 20-40% of false negatives at the onset of symptoms. Check whether your pharmacy would fill a prescription for HCQ (and Azithromycin) – some pharmacies do not. If you develop COVID-19 symptoms, try to get diagnosed and obtain and fill the prescription within 24 hours. Self-quarantine until you successfully finish the treatment.
Mandatory face masks increase, rather than decrease, transmission of the coronavirus. They harm the wearer and persons around him or her. Tell your mayor and governor to cease and desist mandatory masking. Wherever such orders exist:
Avoid places where many people congregate and wear masks.
If you must wear a mask, select one that does not obstruct your breathing. One type is a transparent protective face shield. Wash it with soap and water.
If you must wear a cloth or surgical mask, treat it as an infection spreader. Replace the mask after each use (possibly 3-6 times per day). Handle the used masks safely. If you use disposable masks, soak in soapy water and strain them before throwing them in the If you prefer reusable masks, have more than one, and wash them frequently. Do this even if you have recovered from COVID-19 and have immunity – the mask picks up the coronavirus and other germs from the air and airborne dust, and transfers them to you and other people when you wear it again.
Do not panic. COVID-19 is less dangerous than common flu for persons below 50 and is comparable to the common flu for those between the ages of 50 and 65.
I am not a doctor. This is not medical advice. This is educational material. It is recommended for consideration and adoption by the municipal, state, and the federal governments. Listen to your physician. Prophylaxis improves your odds of not contracting COVID-19 and/or developing severe symptoms if contracted, but it does not give you complete protection.
“Nishinoshima, considered the Worlds newest piece of real estate continues to erupt and grow,” says reader David Hartley. “Over the last few months it’s been busier than it has been since 2013. It’s been pouring particulates out frequently of late.”
“It’s latest eruption:”
According to news reports citing the Geospatial Information Authority of Japan, the southern shore of the island grew by at least 150 meters between June 19 and July 3. The European Space Agency’s TROPOMI satellite also observed a sizable plume of sulfur dioxide from the eruption.
Nishinoshima is part of the Ogasawara Islands, in the Volcano Islands arc. It is located at 27° 14’ North latitude and 140° 52’ East longitude, about 130 kilometers (80 miles) from the nearest inhabited island. You can see the evolution of the island eruption by visiting our Nishinoshima event page.
Brussels has been dragged into a bogus accounting scandal after it was claimed climate change spending had been overblown by at least €24 billion.
Ursula von der Leyen’s EU Commission has overestimated spending, says report (Image: GETTY)
The European Court of Auditors has questioned the European Commission’s claims about its climate-change programmes. It was found the European Union’s powerful executive had substantially overestimated the amount it spent on preventing global warming though the use of clever-accounting. Farmers have been handed cash subsidies which have been counted as agriculture-based spending aimed at climate protection by the Commission.
Eurocrats pass off their subsistence payments to farmers as climate spending, as long as the farmers fulfil a certain level of climate standards.
The ECA said in its report the Commission had overstated the current 2014-2020 budget’s contribution to tackling climate change.
They warned the same was likely to be true for the next seven-year cycle.
The auditors said:
Our analysis of Member State rural development programmes in the same report showed that the Commission was overestimating their contribution to climate action by more than 40 percent, or almost €24billion.
This is because the Commission did not adequately distinguish between climate contributions made by different activities.
The Commission justified this approach by the need to strike a balance between minimising the administrative burden and costs and providing a reasonably reliable estimate for climate-related spending within the European Agricultural Fund for Rural Development.”
ECA auditor Joelle Elvinger called on the Commission to develop more robust methods for tracking its spending.
She said:
The anticipated contributions to climate-related spending, in particular from some agricultural schemes, are likely to be overstated.
“Without a robust methodology, the estimated climate spending may not be reliable.”
Agriculture spending is expected to make up nearly half of the climate spending from the bloc’s 2021-2027 budget, which has been muted at a total of €1.075trillion.
Here I take a detailed look at sea ice and polar bear population health information available for Western Hudson Bay and the Southern Beaufort compared to the Barents and Chukchi Seas. Data from the first two regions – but especially Western Hudson Bay – are used repeatedly to proclaim that a pronounced decline in summer sea ice since 1979 has caused harm to the health of global polar bear populations even though data from the second two regions strongly contradict such a conclusion, as I’ve pointed out in my fully referenced book, The Polar Bear Catastrophe That Never Happened.
These contradictions mean that studies from Western Hudson Bay and the Southern Beaufort should not be used to extrapolate to the rest of the Arctic with regard to how polar bears are responding to reduced summer sea ice. The plea to ‘Save Our Sea Ice‘ for the sake of polar bear survival is a climate change marketing slogan, not a scientific assessment.
ARCTIC SEA ICE FAILED PREDICTIONS
“Dominant outcomes of the BN model were for extinction [extirpation] of polar bear populations in the Seasonal Ice and Polar Basin Divergent Ecoregions by 45 years from present [2050]… Our modeling suggests that realization of the sea ice future which is currently projected, would mean loss of ≈ 2/3 of the world’s current polar bear population by mid-century.” (Amstrup et al. 2007:1-2) [my bold]
Assuming low summer sea ice like we’ve had for more than the minimum 8 out of the last 10 years, total eradication of Western Hudson Bay polar bears – as well as extirpation of bears in nine other subpopulations, comprising all ‘divergent’ and ‘seasonal’ sea ice ecoregions, as shown below – is what USGS polar bear researcher Steven Amstrup predicted when he and his colleagues filed their reports in 2007 to support listing polar bears as ‘threatened’ under the US Endangered Species Act (Amstrup et al. 2007; Durner et al. 2009). Eradication of those ten subpopulations, the experts said, would cause the global population to decline by 67%.
In 2007, USGS expert Steven Amstrup predicted that all of the bears in the green and purple regions would be wiped out if sea ice declined to low extents by 2050. However, the ice declined faster than expected – we’ve had that dreaded sea ice future since 2007, and polar bears thrived. Not a single one of those 10 subpopulations has disappeared.
In Amstrup’s own words, from 2011, linked to by PBI on their sea ice day page:
Simply put, the predicted devastation of polar bear populations did not require waiting until 2050 – the predicted decline in sea ice has already happened (Crockford 2017, 2019), as shown in the NSIDC graph below. Summer sea ice levels not expected to occur until 2050 have existed since 2007.
Yet, more than a decade of what was presumed to be polar-bear-destroying sea ice levels has resulted in virtually no overall damage to polar bear health or survival – fat polar bears still come ashore in Western Hudson Bay, along the Alaskan shore of the Southern Beaufort Sea and on Wrangel Island, Russia – and not a single subpopulation (let alone ten) has been wiped out (Crockford 2020; Aars et al. 2017; Regehr et al. 2016; Wiig et al. 2015). The anticipated polar bear catastrophe not only never happened, it never came close to happening.
Western Hudson Bay female in August 2019
SEA ICE VS. POLAR BEAR HARM CONTRADICTIONS
The graphs below show regional sea ice declines between 1979 and 2015 (Regehr et al. 2016, which is the ‘peer-reviewed’ version of the Wiig et al. (2015) IUCN 2015 polar bear assessment). The authors’ define the length of the ‘summer sea ice’ season differently than that utilized by recent polar bear research papers (e.g. Castro de la Guardia et al. 2017) and their prediction for future polar bear survival assumes that each of these regional declines in summer sea ice will continue in linear fashion until 2050. In other words, they do not depend on any of the complex sea ice models that have so far failed to accurately predict future sea ice conditions and which have been shown to contain critical caveats that make them unsuitable for polar bear conservation purposes.
Western Hudson Bay vs. Barents Sea (1)
Sea ice profiles and polar bear responses both contrary to predictions: Western Hudson Bay (WH) is in the so-called ‘Seasonal’ sea ice ecoregion (see above), which is assumed to be most at risk of summer sea ice decline (Amstrup et al. 2007). So far, it has seen a decline in summer sea ice of 0.86 days per year, one of the smallest declines in sea ice of all polar bear subpopulation regions, which translates to 4 weeks since 1979 using these data (cf. all papers specific to WH which consider the change to be about 3 weeks, see e.g. Castro de la Guardia et al. 2017). Polar bears in this region now spend up to 5 months onshore in the summer, up from about 4 months previously. However, it has been acknowledged that this change happened in a single ‘step-change’ in 1995 or 1998 (depending on the data used) (Castro de la Guardia et al. 2017; Lunn et al. 2016). In other words, there has not been a continued, gradual decline in summer sea ice over time as CO2 has increased: breakup dates from 1995 to 2015 were about two weeks earlier than the 1980s and freeze-up about one week later, with lots of variability (Castro de la Guardia et al. 2017), although for the past few years, freeze-up has been like the 1980s. This year, even breakup is looking like it did in the 1980s.
WH polar bear numbers declined by a statistically significant 22% between 1987 and 2004 but have been stable since 2001 at about 1030 bears (Dyck et al. 2017: 3; Stapleton et al. 2014), even while some polar bear experts continue to insist that WH bears are suffering due to lack of ice. Data to support claims that WH bears are in poor health compared to the 1980s (i.e. ‘skinnier’) or reproducing poorly have not been published (Crockford 2020). Today (15 July) one of the first bears off the ice in WH was a fat female and her equally fat cub captured on the explore.org livecam at Wapusk National Park south of Churchill and as one of the official moderators commented (15 July 2020):
“The PBs we’ve seen so far are coming off the ice nice and fat. Seems it’s been a good hunting season for them.”
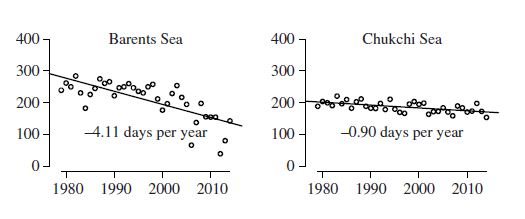
In contrast, the Barents Sea is in the so-called ‘Divergent’ sea ice ecoregion, which is also considered at high risk of population decline due to loss of summer sea ice (Amstrup et al. 2007). As of 2015, it had lost a whopping 4.11 days per year of summer sea ice since 1979 (more than 21 weeks or almost 5 1/2 months, using these data). Despite now having an ice-free season longer than Western Hudson Bay, Barents Sea polar bear numbers have not declined at all: rather, the Svalbard area population has seen a documented but ‘statistically insignificant’ increase of 42% that almost certainly can be extrapolated to the entire Barents Sea region (Crockford 2019). Moreover, the body condition of females has increased significantly since 2004 while the condition of males has been stable (Aars 2018; Aars et al. 2017; Lipppold et al. 2019). The Barents Sea subpopulation is subject to a natural movement of Svalbard area pregnant females to the polar pack ice or to Franz Josef Land in the eastern Barents Sea when summer sea ice levels around Svalbard are low.
Barents Sea vs. Chukchi Sea (2)
Markedly different sea ice profiles, remarkably similar polar bear responses: Like the Barents Sea, the Chukchi Sea polar bear subpopulation is considered to reside in the ‘Divergent’ sea ice ecoregion, where summer sea ice loss was expected to be similar. However, the Chukchi Sea has only lost about 0.9 days per year of summer sea ice between 1979 and 2015, or about 41 days total – slightly more than experienced by Western Hudson Bay. However, to the astonishment of polar bear researchers, Chukchi Sea polar bears are thriving by all measures used to assess individual and population heath: body condition has been better than it was in the 1980s (when there was a shorter ice-free period) and females are reproducing well, with a number of triplet litters reported (Rode and Regehr 2010; Rode et al. 2013, 2014, 2015, 2018). A recent survey put the population size at about 3,000 bears, considerably higher than the estimate of about 2,000 bears used in the 2015 Red List assessment (AC SWG 2018; Regehr et al. 2016, 2018; Wiig et al. 2015).
“Chukchi bears remain larger and fatter and have not seen downward trends in cub production and survival, according to new preliminary information on the health and numbers of bears.”
In addition, Chukchi Sea ringed and bearded seals – the primary prey of polar bears – were also found to be doing much better up to 2013 than they were in the 1980s when the open-water period was much shorter (Crawford and Quakenbush 2013; Crawford et al. 2015), and preliminary data from on-going studies suggest this continues to be the case (Adam et al. 2019). These results contradict predictions that ringed and bearded seals numbers would decline markedly due to sea ice loss, which formed the basis of classifying both species as ‘threatened‘ in the US in 2012.
In contrast, polar bears in the Barents Sea (see discussion 1) are similarly thriving despite the greatest decline in sea ice of all subpopulations.
Southern Beaufort vs. Kane Basin (3)
Remarkably similar sea ice profiles, markedly different polar bear responses: The Southern Beaufort polar bear subpopulation is considered to reside within the ‘Divergent’ sea ice ecoregion. However, Southern Beaufort Sea summer ice cover has declined only 1.75 days per year in the 37 years between 1979 and 2015 or about 65 days total – just over 2 months, compared to 41 days of ice lost in the adjacent Chukchi Sea and the 5 1/2 months lost in the Barents Sea (all ‘Divergent’ ecoregions). Between 2001 and 2010, the SB polar bear population is said to have declined by 25-50% (Bromaghin et al. 2015) but the numerous problems with that estimate are well documented and even acknowledged by the Polar Bear Specialist Group (see Crockford 2019 for a full discussion, also Crockford 2015, 2017, 2020; Durner et al. 2018; Stirling 2002; Stirling and Lunn 1997; Stirling et al. 1975a, 1975b; 1981, 1982, 1993).
Regardless, 2010 is a decade ago and recent anecdotal reports (including Inuit knowledge) suggest the SB population is now substantially recovered or never declined as suggested in the first place (COSEWIC 2018). Polar bears encountered in recent years, as shown below, are fat and healthy. A recent population estimate update, started in 2017, has not been completed (Crockford 2020).
Healthy polar bear male at Kaktovik, Alaska on the Southern Beaufort Sea, September 2019, Ed Boudreau photo, with permission.
Kane Basin resides in the so-called ‘Archipelago’ sea ice ecoregion presumed to be more resilient to summer sea ice loss and but has lost 1.44 days per year since 1979 or about 53 days total (just under 2 months). Yet, the polar bear population in Kane Basin has more than doubled between 1997 and 2013 (an increase of 118%) and body condition of bears improved (COSEWIC 2018; Crockford 2020; SWG 2016). The summer sea ice loss included a change from predominantly thick, multi-year ice to primarily thin, first year ice that disappears in summer, but the decline in summer sea ice coverage decades before 2050 was unexpected. However, since seasonal ice is more productive habitat for seals, the change in ice type has been advantageous to polar bear health and survival.
SUMMARY
Western Hudson Bay vs. Barents Sea: WH summer sea ice decline was far less than expected, while the polar bear response has reflected actual sea ice change (stable population, not extirpated); BS ice decline has been much greater than expected (the greatest of any subpopulation), yet the response of polar bears has been wildly contrary to predictions (thriving population, not extirpated).
Barents vs. Chukchi Seas: BS ice decline has been much greater than expected (the greatest of any subpopulation), yet the response of polar bears has been wildly contrary to predictions (thriving population, not extirpated); CS summer ice loss about as predicted (but similar to the actual loss in WH), yet polar bear response has been contrary to predictions and remarkably similar to BS (thriving population, not extirpated).
Southern Beaufort Sea vs. Kane Basin: SB summer sea ice declined markedly as expected but the decrease in population size of polar bears blamed on this ice loss (if it happened at all) has probably recovered (population stable or slightly declined); KB summer sea ice declined more than predicted (similar to SB), yet the polar bear population size doubled and bears were in better condition with less summer ice (thriving population, not stable).
Overall, contrary to the predictions made by sea ice and polar bear researchers both decades ago and more recently, relative loss of summer sea ice since 1979 has not been a good predictor of polar bear health and survival either within or between sea ice ecoregions. The pronounced contradictions with respect to the amount of summer sea ice loss and documented population health of polar bears means that data from Western Hudson Bay and the Southern Beaufort should not be used to extrapolate to the rest of the Arctic with regard to how polar bears in any other region, such as the Laptev Sea, are likely to respond to reduced summer sea ice.
REFERENCES
Aars, J. 2018. Population changes in polar bears: protected, but quickly losing habitat. Fram Forum Newsletter 2018. Fram Centre, Tromso. Download pdf here (32 mb).
Aars, J., Marques,T.A, Lone, K., Anderson, M., Wiig, Ø., Fløystad, I.M.B., Hagen, S.B. and Buckland, S.T. 2017. The number and distribution of polar bears in the western Barents Sea. Polar Research 36:1. 1374125. doi:10.1080/17518369.2017.1374125
AC SWG 2018. Chukchi-Alaska polar bear population demographic parameter estimation. Eric Regehr, Scientific Working Group (SWG. Report of the Proceedings of the 10th meeting of the Russian-American Commission on Polar Bears, 27-28 July 2018), pg. 5. Published 30 July 2018. US Fish and Wildlife Service. https://www.fws.gov/alaska/fisheries/mmm/polarbear/bilateral.htm pdf here.
Adam, R., Bryan, A., Quakenbush, L., Crawford, J., and Biderman, L.2019. Bearded seal productivity in Alaska using harvest-based monitoring, 1975-2016. Poster presentation, Alaska Marine Science Symposium, 28 January-1 February.
Abstract: Declines in arctic sea ice extent, thickness, and duration are projected to negatively impact bearded seals (Erignathus barbatus) by reducing their time to rest, pup, nurse, and molt on sea ice. Existing population estimates for bearded seals in Alaska cannot be used to detect trends; however, the Alaska Department of Fish and Game works with Alaska Native hunters to collect data from the subsistence harvest that are used to determine several population health indices, such as: pregnancy rate, age of maturity, and the proportion of pups in the sampled harvest. These indices were previously used to determine if declines in sea ice have affected bearded seals between 1975–1984 and 2003–2014.
During these time periods pregnancy rates varied minimally (92–99%); however, the average age of maturity decreased from 4.2 years in 1975–1984 to 2.9 years in 2003–2014. Additionally, pups were harvested in lower proportions during 1975–1984 than during 2003–2014 (26% and 48%, respectively), indicating that pups are still being produced, weaned, and are surviving to be harvested. Through 2014, we have not detected the decreases in population indices that have been predicted to occur with climate change. However, due to continued declines in sea ice, further monitoring is important; therefore, here we update our 1975–2014 results to include samples from 2015 and 2016.
Amstrup, S.C., Marcot, B.G. & Douglas, D.C. 2007. Forecasting the rangewide status of polar bears at selected times in the 21st century. US Geological Survey. Reston, VA. Pdf here
Andersen, M., Derocher, A.E., Wiig, Ø. and Aars, J. 2012. Polar bear (Ursus maritimus) maternity den distribution in Svalbard, Norway. Polar Biology 35:499-508.
Bromaghin, J.F., McDonald, T.L., Stirling, I., Derocher, A.E., Richardson, E.S., Rehehr, E.V., Douglas, D.C., Durner, G.M., Atwood, T. and Amstrup, S.C. 2015. Polar bear population dynamics in the southern Beaufort Sea during a period of sea ice decline. Ecological Applications 25(3):634-651.
Castro de la Guardia, L., Myers, P.G., Derocher, A.E., Lunn, N.J., Terwisscha van Scheltinga, A.D. 2017. Sea ice cycle in western Hudson Bay, Canada, from a polar bear perspective. Marine Ecology Progress Series564: 225–233. http://www.int-res.com/abstracts/meps/v564/p225-233/
Crawford, J. and Quakenbush, L. 2013.Ringed seals and climate change: early predictions versus recent observations in Alaska. Oral presentation by Justin Crawfort, 28th Lowell Wakefield Fisheries Symposium, March 26-29. Anchorage, AK. Abstract below, find pdf here:http://seagrant.uaf.edu/conferences/2013/wakefield-arctic-ecosystems/program.php
Crawford, J.A., Quakenbush, L.T. and Citta, J.J. 2015. A comparison of ringed and bearded seal diet, condition and productivity between historical (1975–1984) and recent (2003–2012) periods in the Alaskan Bering and Chukchi seas. Progress in Oceanography 136:133-150.
Crockford, S.J. 2017. Testing the hypothesis that routine sea ice coverage of 3-5 mkm2 results in a greater than 30% decline in population size of polar bears (Ursus maritimus). PeerJ Preprints 19 January 2017. Doi: 10.7287/peerj.preprints.2737v1 Open access. https://peerj.com/preprints/2737/
Crockford, S.J. 2019. The Polar Bear Catastrophe That Never Happened. Global Warming Policy Foundation, London. Available in paperback and ebook formats.
Crockford, S.J. 2020. State of the Polar Bear Report 2019. Global Warming Policy Foundation Report 39, London. pdf here.
Durner, G.M., Douglas, D.C., Nielson, R.M., Amstrup, S.C., McDonald, T.L., et al. 2009. Predicting 21st-century polar bear habitat distribution from global climate models. Ecology Monographs 79: 25–58.
Dyck, M., Campbell, M., Lee, D., Boulanger, J. and Hedman, D. 2017. Aerial survey of the Western Hudson Bay polar bear sub-population 2016, final report (26 June 2017). Status report 2017-xx, Nunavut Department of Environment, Wildlife Research Section. Igloolik, Nunavut. pdf here.
Lippold, A., Bourgeon, S., Aars, J., Andersen, M., Polder, A., Lyche, J.L., Bytingsvik, J., Jenssen, B.M., Derocher, A.E., Welker, J.M. and Routti, H. 2019. Temporal trends of persistent organic pollutants in Barents Sea polar bears (Ursus maritimus) in relation to changes in feeding habits and body condition. Environmental Science and Technology 53(2):984-995.
Lunn, N.J., Servanty, S., Regehr, E.V., Converse, S.J., Richardson, E. and Stirling, I. 2016. Demography of an apex predator at the edge of its range – impacts of changing sea ice on polar bears in Hudson Bay. Ecological Applications 26(5):1302-1320. DOI: 10.1890/15-1256
Regehr, E.V., Laidre, K.L, Akçakaya, H.R., Amstrup, S.C., Atwood, T.C., Lunn, N.J., Obbard, M., Stern, H., Thiemann, G.W., & Wiig, Ø. 2016. Conservation status of polar bears (Ursus maritimus) in relation to projected sea-ice declines. Biology Letters 12: 20160556. http://rsbl.royalsocietypublishing.org/content/12/12/20160556 Supplementary data here.
Regehr, E.V., Hostetter, N.J., Wilson, R.R., Rode, K.D., St. Martin, M., Converse, S.J. 2018. Integrated population modeling provides the first empirical estimates of vital rates and abundance for polar bears in the Chukchi Sea. Scientific Reports 8 (1) DOI: 10.1038/s41598-018-34824-7 https://www.nature.com/articles/s41598-018-34824-7
Rode, K. and Regehr, E.V. 2010. Polar bear research in the Chukchi and Bering Seas: A synopsis of 2010 field work. Unpublished report to the US Fish and Wildlife Service, Department of the Interior, Anchorage. pdf here.
Rode, K.D., Douglas, D., Durner, G., Derocher, A.E., Thiemann, G.W., and Budge, S. 2013.Variation in the response of an Arctic top predator experiencing habitat loss: feeding and reproductive ecology of two polar bear populations. Oral presentation by Karyn Rode, 28th Lowell Wakefield Fisheries Symposium, March 26-29. Anchorage, AK.
Rode, K.D., Regehr, E.V., Douglas, D., Durner, G., Derocher, A.E., Thiemann, G.W., and Budge, S. 2014. Variation in the response of an Arctic top predator experiencing habitat loss: feeding and reproductive ecology of two polar bear populations. Global Change Biology20(1):76-88. http://onlinelibrary.wiley.com/doi/10.1111/gcb.12339/abstract
Rode, K. D., R. R. Wilson, D. C. Douglas, V. Muhlenbruch, T.C. Atwood, E. V. Regehr, E.S. Richardson, N.W. Pilfold, A.E. Derocher, G.M Durner, I. Stirling, S.C. Amstrup, M. S. Martin, A.M. Pagano, and K. Simac. 2018. Spring fasting behavior in a marine apex predator provides an index of ecosystem productivity. Global Change Biologyhttp://onlinelibrary.wiley.com/doi/10.1111/gcb.13933/full
Rode, K.D., Wilson, R.R., Regehr, E.V., St. Martin, M., Douglas, D.C. & Olson, J. 2015. Increased land use by Chukchi Sea polar bears in relation to changing sea ice conditions. PLoS One 10 e0142213.
Stapleton S., Atkinson, S., Hedman, D. and Garshelis, D.2014. Revisiting Western Hudson Bay: using aerial surveys to update polar bear abundance in a sentinel population. Biological Conservation 170:38-47.
Stern, H.L. and Laidre, K.L. 2016. Sea-ice indicators of polar bear habitat. Cryosphere 10: 2027-2041.
Stirling, I., Andriashek, D., and Calvert, W. 1993. Habitat preferences of polar bears in the western Canadian Arctic in late winter and spring. Polar Record29:13-24. http://tinyurl.com/qxt33wj
Stirling, I., Andriashek, D., Latour, P.B. and Calvert, W. 1975a. Distribution and abundance of polar bears in the Eastern Beaufort Sea. Beaufort Sea Tech. Report #2, Dept. Environment, Victoria, B.C.
Stirling, I., Archibald, R. and DeMaster, D. 1975b. Distribution and abundance of seals in the Eastern Beaufort Sea. Beaufort Sea Tech. Report #1, Dept. Environment, Victoria, B.C.
Stirling, I, Cleator, H. and Smith, T.G. 1981. Marine mammals. In: Polynyas in the Canadian Arctic, Stirling, I. and Cleator, H. (eds), pg. 45-58. Canadian Wildlife Service Occasional Paper No. 45. Ottawa. Pdf of pertinent excerpts from the Stirling and Cleator volume here.
Stirling, I, Kingsley, M. and Calvert, W. 1982. The distribution and abundance of seals in the eastern Beaufort Sea, 1974–79. Canadian Wildlife Service Occasional Paper 47. Edmonton.
Stirling, I. and Lunn, N.J. 1997. Environmental fluctuations in arctic marine ecosystems as reflected by variability in reproduction of polar bears and ringed seals. In Ecology of Arctic Environments, Woodin, S.J. and Marquiss, M. (eds), pg. 167-181. Blackwell Science, UK.
SWG [Scientific Working Group to the Canada-Greenland Joint Commission on Polar Bear]. 2016. Re-Assessment of the Baffin Bay and Kane Basin Polar Bear Subpopulations: Final Report to the Canada-Greenland Joint Commission on Polar Bear. +636 pp. http://www.gov.nu.ca/documents-publications/349