
Guest “geological perspective” by David Middleton
This is sort of a sequel yesterday’s post: Where’s the sea ice? 3 reasons the Arctic freeze is unseasonably late and why it matters.
With the setting of the sun and the onset of polar darkness, the Arctic Ocean would normally be crusted with sea ice along the Siberian coast by now. But this year, the water is still open.
What a difference a day can make! Looks like it’s starting to crust over:
“Where’s the sea ice?”
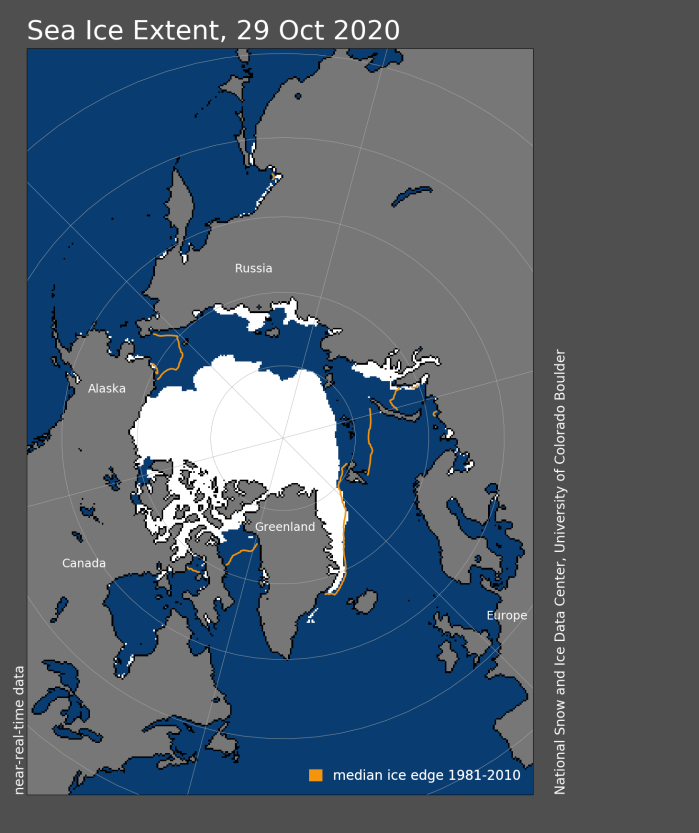
Right here:

September is the most recent monthly ice extent map available. September is also when the annual minimum generally occurs. The magenta outline represents the median September ice edge from 1981-2010. The minimum Arctic sea ice extent generally occurs in September. At 3.9 million km2, this is the second lowest September “on record.” A record that goes all the way back to 1979.

Considering the fact that this is such a short record length, is a 3-5 million km2 annual minimum particularly anomalous? Or are the 6-7 million km2 annual minima from 1979-2000 actually the anomaly? We really some context and scale here.
Geologists are big on context and scale. When a geologist takes a picture with a person in it, the person is just for scale. Since quarters, lens caps and rock hammers are far too small to provide scale to 3.9 million square kilometers of sea ice, and 42 years is far too short of a time span to provide context, we need something bigger, with a longer time span.
Scale
We can use the Arctic Ocean to provide scale:
The Arctic Ocean is the smallest of the world’s five oceans (after the Pacific Ocean, Atlantic Ocean, Indian Ocean, and the Southern Ocean). The Northwest Passage (US and Canada) and Northern Sea Route (Norway and Russia) are two important seasonal waterways. In recent years the polar ice pack has receded in the summer allowing for increased navigation and raising the possibility of future sovereignty and shipping disputes among the six countries bordering the Arctic Ocean (Canada, Denmark (Greenland), Iceland, Norway, Russia, US).
Area:
total: 14.056 million sq km

3.9 million km2 represents 28% of the area of the Arctic Ocean.

28% of the Arctic Ocean is just a bit below the climate “normal” range of 35% to 58% for the annual minimum. This doesn’t sound like much of a death spiral to me. Bear in mind that the satellite record started right about here:
Context
42 years is much too short of a record length to determine what the climate “normal” should be. It doesn’t provide a meaningful context. Fortunately, there have been efforts to reconstruct sea ice extent prior to the satellite record.

Nearly 70 years is better than 42 years… But still insufficient for context.
To look back into the past, researchers combine data and records from indirect sources known as proxy records. Researchers delved into shipping charts going back to the 1950s, which noted sea ice conditions. The data gleaned from those records, called the Hadley data set, show that Arctic sea ice has declined since at least the mid-1950s. Shipping records exist back to the 1700s, but do not provide complete coverage of the Arctic Ocean. However, taken together these records indicate that the current decline is unprecedented in the last several hundred years.
“The current decline is unprecedented in the last several hundred years” claim is a big, fat No Schist Sherlock. Earth has been warming from the coldest climate of the Holocene (the Little Ice Age) for the last 400-500 years.
Kinnard et al, 2008, pieced together a reconstruction back to 1870…

Oddly, Kinnard indicates minima with about 1 million km2 more ice extent than the satellite data.

Now we ‘re seeing a hint of context. The sea ice decline began when the Arctic sea ice extent was anomalously large. Let’s relate the context to scale:

According to the Kinnard reconstruction, the Arctic Ocean still has about half as much summer sea ice as it did at the end of Neoglacition, the maximum extent of Holocene glaciers and sea ice. Why is this a bad thing? Since 1870, Arctic sea ice has been retreating from this sort of climate “normal”…

Kinnard also featured a neat map:

Panel B is the annual minimum. Kinnard et al assert that the gray area had been covered with summer sea ice 100% of the time from 1870-2003. Let’s overlay the 2020 NSIDC map on Panel B:

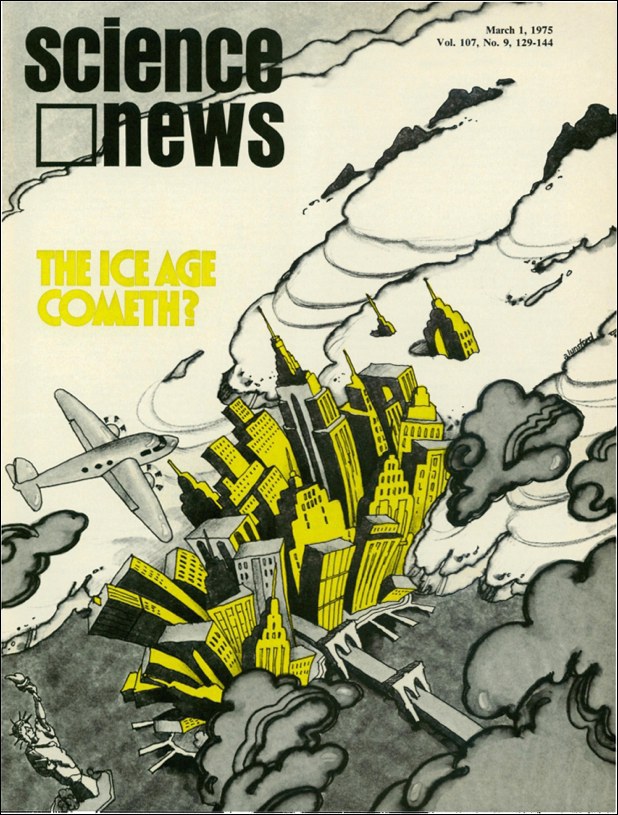
Alright… So, the annual sea ice minimum is now clearly lower than it was from the Little Ice Age through “The Ice Age Cometh”… How is this a bad thing? For that matter, we still don’t know which is the true anomaly: The recent 3-5 million km2 annual minima or the 6-10 million km2 annual minima from 1870-2003? The minimum summer sea ice covered about twice as much area for 90% of the past 150 years… So what? Is 150 years a long time? Is it relevant to the Holocene Epoch? Is it one of the “Goldilocks conditions” of the Holocene? We clearly need more context. We need a geological perspective.
A Geological Perspective
Stein et al., 2017 (H/T tty) provided a great description of a rather novel method of determining paleo sea ice extent.
In a pioneering study by Belt et al. (2007), the ability to (semi-)quantitatively reconstruct paleo-sea ice distributions has been significantly improved by a biomarker approach based on determination of a highly branched isoprenoid (HBI) with 25 carbons (C25 HBI monoene = IP25). This biomarker is only biosynthesized by specific diatoms living within the Arctic sea ice (Brown et al., 2014) and appears to be a specific, sensitive and stable proxy for Arctic sea ice in sedimentary sections representing Late Miocene to Recent times (Stein et al., 2012, 2016; Belt and Müller, 2013; Stein and Fahl, 2013; Knies et al., 2014). The presence of IP25 in the studied sediments is direct evidence for the presence of sea ice.
[…]
For more semi-quantitative estimates of present and past sea ice coverage, M€uller et al. (2011) combined the sea-ice proxy IP25 and phytoplankton biomarkers in a phytoplankton- IP25 index, the so-called ‘PIP25 index’:
PIP25 = [IP25]/([IP25] + ([phytoplankton marker] x c))
with c is the mean IP25 concentration/mean phytoplankton biomarker concentration for a specific data set or core.
[…]
Stein et al., 2017
This schematic diagram from Belt et al., 2013 relates the PIP25 index to sea ice conditions:

Generally speaking, the PIP25 index correlates to sea ice extent as follows:
- >0.7 = Extended, perennial (year-round) ice cover
- 0.5-0.7 = Seasonal ice cover/ice edge situation (mostly ice-free in summer)
- 0.1-0.3 = Reduced ice cover (only winter ice)
- <0.1 = Ice-free year-round
Here’s an example from the Chukchi Sea:

Note that the sea ice at this location has only been seasonal since about 1,600 years ago. Prior to that it was considered reduced, covered only partially during winter. It was much lower than it is today for about 85% of the Holocene.
Stein et al. 2017, constructed a cross-section of PIP25 curves across the Arctic from the Fram Strait to the Chukchi Sea.

All four core locations currently reflect seasonal ice cover/ice edge situations (PIP25 index 0.5-0.7), with the Fram Strait being an ice edge situation and the other three reflecting seasonal ice cover.

Two key takeaways:
- Maximum Holocene sea ice extent occurred within the past 500-1,000 years at every location.
- The current sea ice extent is higher at all of the locations than over 50% to 85% of the Holocene.
While this doesn’t tell us what the sea ice extent was in million km2, it does tell us that the modern sea ice extent is larger than it was over most of the Holocene Epoch. It also tells us that the areas of currently seasonal sea ice extent have been seasonal or reduced over most of the past 5,000 years and ice-free or nearly ice-free over the prior 3,000 years or so. Here’s is the Kinnard graph plotted at the same horizontal scale as the Stein cross section:

Where’s the sea ice?
Right where it’s been for most of the Holocene… And that’s a good thing. Had the sea ice continued to expand as it was from 8,000 years ago up until the mid-19th century, this would still be the climate crisis du jour:
So, next time you get gas at an Exxon station, be sure to thank them for this:


Humble Oil was founded in Humble, Texas in 1911. In 1919, Standard Oil of New Jersey acquired a 50% stake in Humble Oil. They acquired the other 50% in 1959. All of the affiliates were merged into Exxon Corporation by 1973 and Exxon ultimately merged with Mobil Oil Corporation, a descendant of Standard Oil Company of New York, in 1999 to become ExxonMobil (Texas State Historical Association).
Here’s your oil industry trivia for the day:

In as few as three more mergers, Standard Oil could be put back together again! That’s fracking awesome!
References
Belt S.T., Müller J. “The Arctic sea ice biomarker IP25: A review of current understanding, recommendations for future research and applications in palaeo sea ice reconstructions”. (2013) Quaternary Science Reviews, 79, pp. 9-25. Belt_2013
Fetterer, F., K. Knowles, W. N. Meier, M. Savoie, and A. K. Windnagel. 2017, updated daily. Sea Ice Index, Version 3. [Sea Ice Monthly By Year]. Boulder, Colorado USA. NSIDC: National Snow and Ice Data Center. doi: https://doi.org/10.7265/N5K072F8. [Accessed October 16, 2019].
Kinnard, C., Zdanowicz,C.M., Koerner,R .,Fisher,D.A., 2008. “A changing Arctic seasonal ice zone–observations from 1870–2003 and possible oceanographic consequences”. 35, L02507. Kinnard_2008
Stein, R. , Fahl, K. , Schade, I. , Manerung, A. , Wassmuth, S. , Niessen, F. and Nam, S. (2017), Holocene variability in sea ice cover, primary production, and Pacific‐Water inflow and climate change in the Chukchi and East Siberian Seas (Arctic Ocean). J. Quaternary Sci., 32: 362-379. doi:10.1002/jqs.2929 stein2017
Related
via Watts Up With That?
October 31, 2020 at 12:37AM
