By Paul Homewood

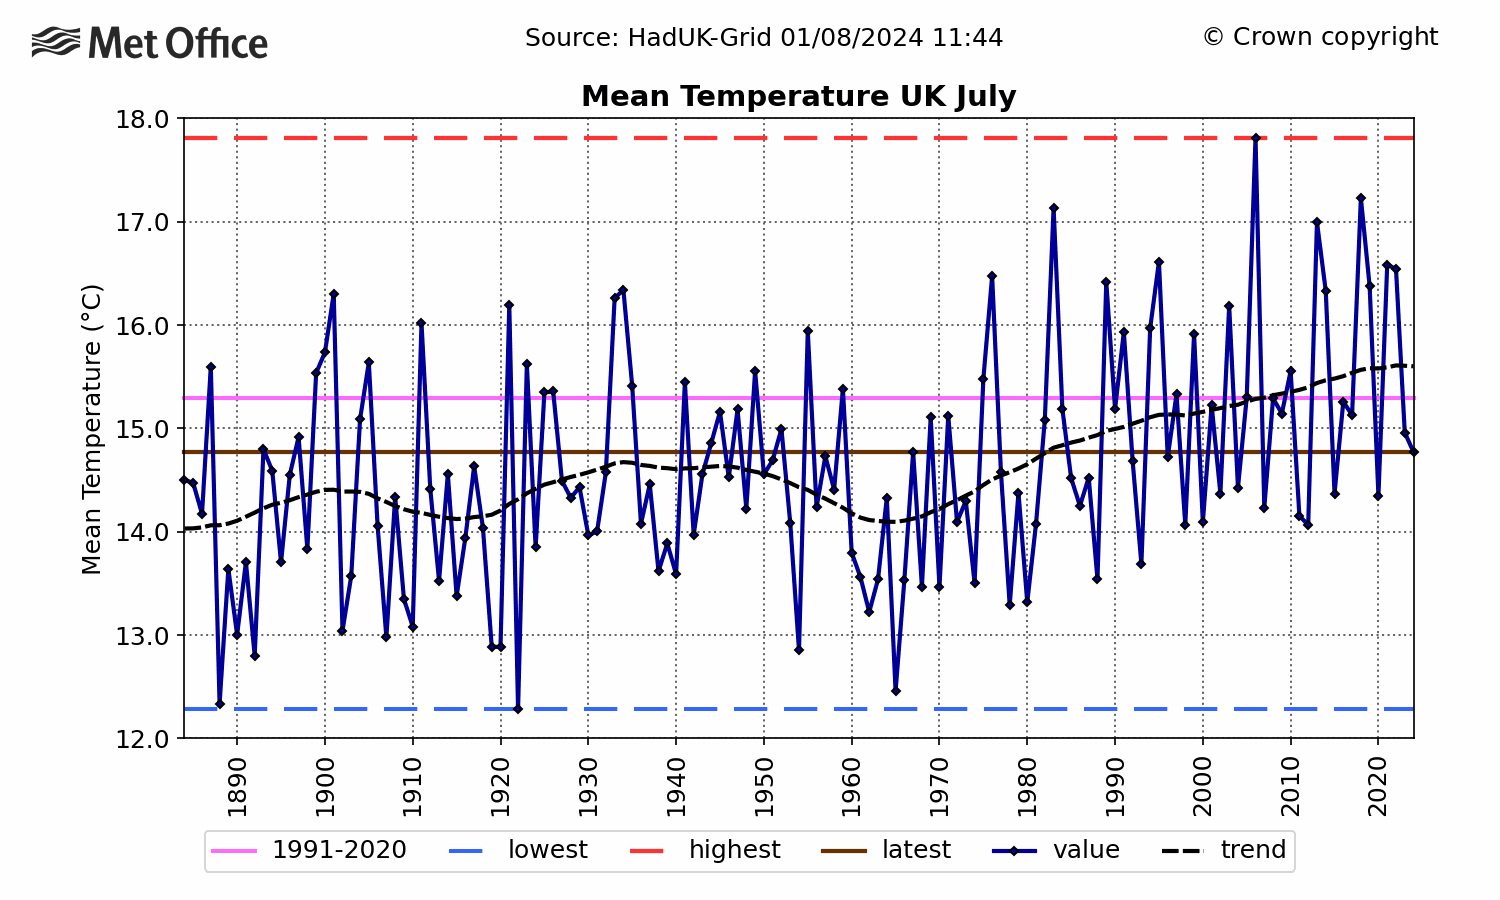
I noted the other day that, according to CET, last month was only the 21st hottest July since 1878. This was based on daily max temperatures; using daily mean temperatures, it was the 32nd warmest since the start of records in 1659.
I was therefore astonished when the Met Office grandly announced it was in fact the 5th hottest July on record for the UK as a whole. Of course, it may be that other parts of the UK were relatively hotter than central England. However, when we look at the Met Office series for the Midland region, which is a similar area to that covered by CET, we find that it was still ranked the 7th warmest, (in a tie with 1976).
The Met Office UK series only goes back to 1884, but according to CET last month was still only the 14th hottest since 1884.
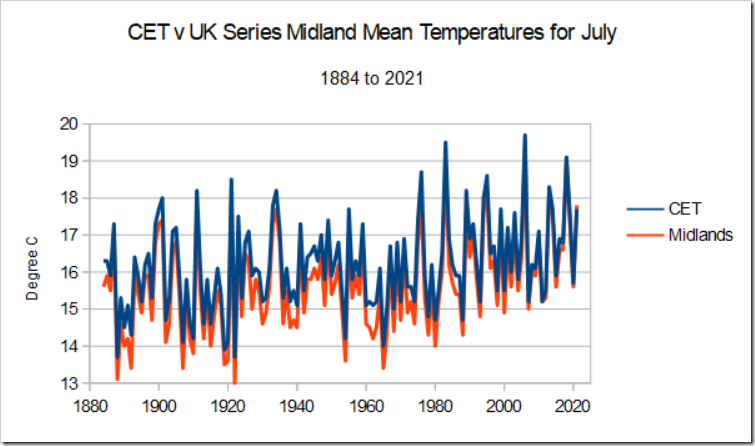
Clearly something does not stack up. Below is a chart comparing July mean temperatures for the two series:
https://www.metoffice.gov.uk/research/climate/maps-and-data/uk-and-regional-series
https://www.metoffice.gov.uk/hadobs/hadcet/data/download.html
You can see that Midland temperatures tended to be below CET, but gradually have closed the gap. We can see this more clearly below:
Although there has been variability from year to year, there has been a clear upsurge in the Midland temperatures relative to CET since around 1990. Up until then, the average difference was minus 0.6C. This year, the Midlands temperatures are 0.1C higher.
In other words, the Midlands appear to be warming about 0.7C faster the CET. Two possible reasons may explain this:
1) UHI
2) A change in station mix.
We know that the Met Office’s UK temperature series includes garbage like Heathrow and many totally unsuitable urban sites. In contrast, the CET is based on rural stations, with careful homogenisation when station changes take place.
The CET is only based on three stations, but as the Met Office Hadley Centre states:
These daily and monthly temperatures are representative of a roughly triangular area of the United Kingdom enclosed by Lancashire, London and Bristol
Representative being the key word.
The Met Office would argue that their series gives a better reflection of area temperatures, because it uses many more stations. However it is not the “actual” area temperature which matters, this is of purely academic interest. What matters is the time trends. There is consequently a very real risk that urbanisation and changing station mix is corrupting their series.
This, of course, is not the first time we have seen a large discrepancy like this between the UK series and CET. According to the Met Office, the summer of 2018 was the hottest on record, both for the UK as a whole and for the Midlands. The CET came to a very different conclusion – it was only the 5th warmest and a full half a degree cooler than 1976.
It is plain that the Met Office UK series is now running at least half a degree too hot, in summer at least, and that this discrepancy is not just a one off blip.
The comparison with July 1921 is particularly pertinent one. CET says that month was 0.8C hotter than last month. Yet according to the Met Office Midland series, it was only 0.1C hotter. We have a useful crosscheck at Radcliffe Observatory in Oxford University, where it was 0.65C warmer back in 1921. This would seem to provide added weight to the suspicion that the UK series is now unfit for purpose.
For confidence to be restored in its UK series, the Met Office should immediately exclude all data from Heathrow and all other unsuitable urban and airfield sites.
But, of course, it won’t do that, because that would rather ruin their agenda.
via NOT A LOT OF PEOPLE KNOW THAT
August 5, 2021 at 09:33AM


