 A recent rigorous analysis was published, creating discussion among those concerned with global warming/climate change science. The paper is World Atmospheric CO2, Its 14C Specific Activity, Non-fossil Component, Anthropogenic Fossil Component, and Emissions (1750–2018) by Kenneth Skrable,; George Chabot,; and Clayton French at University of Massachusetts Lowell.
The analysis employs ratios of carbon isotopes to calculate the relative proportions of atmospheric CO2 from natural sources and from fossil fuel emissions. The results are welcomed by skeptics and repulsed by warmists. Excerpts in italics with my bolds.
The specific activity of 14C in the atmosphere gets reduced by a dilution effect when fossil CO2, which is devoid of 14C, enters the atmosphere. We have used the results of this effect to quantify the two components: the anthropogenic fossil component and the non-fossil component. All results covering the period from 1750 through 2018 are listed in a table and plotted in figures.
These results negate claims that the increase in total atmospheric CO2 concentration C(t) since 1800 has been dominated by the increase of the anthropogenic fossil component. We determined that in 2018, atmospheric anthropogenic fossil CO2 represented 23% of the total emissions since 1750 with the remaining 77% in the exchange reservoirs. Our results show that the percentage of the total CO2 due to the use of fossil fuels from 1750 to 2018 increased from 0% in 1750 to 12% in 2018, much too low to be the cause of global warming.
Synopsis of Analytics
Readers will find in the the linked paper a complete description of the assumptions, definitions, data sources and equations leading to the above findings. This post attempts to explain the logic of the analysis for a general audience, with excerpts in italics with my bolds.
Carbon-14 is a radioactive isotope of carbon having a half-life of 5,730 y. Carbon-14 atoms are produced in the atmosphere by interactions of cosmic rays, and they have reached an essentially constant steady state activity, i.e., disintegration rate, in the total world environment (Eisenbud and Gesell 1997). The age of fossil fuels is much longer than the 5,730 y half-life of the 14C radioactive isotope; consequently, fossil fuels are devoid of the 14C isotope. The units used in this paper are disintegrations per minute per gram of carbon abbreviated as dpm (gC)−1, the common units used in 14C dating.
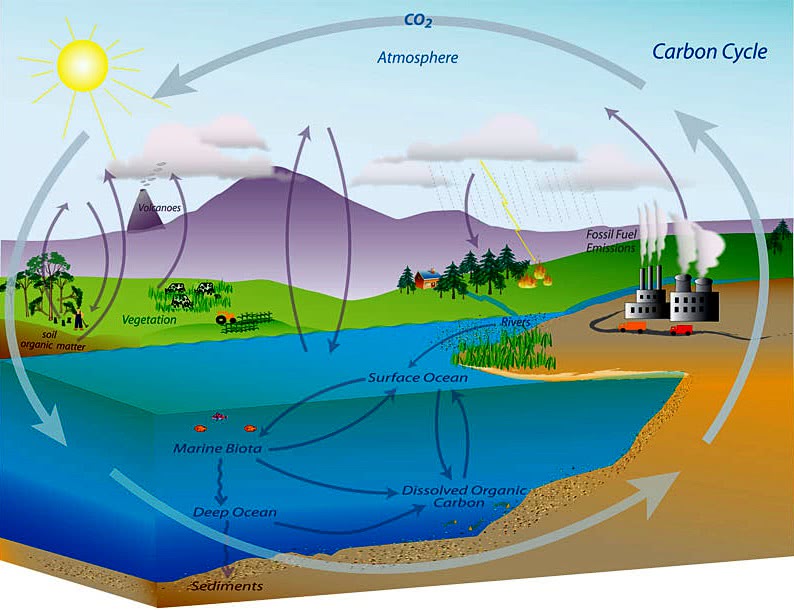
The global carbon cycle for CO2 is described by the Energy Information Administration (EIA 2020). Natural, two-way exchanges of CO2 occur between the atmosphere and its two exchange reservoirs, the oceans and terrestrial biosphere. Two-way exchanges with the atmosphere also occur from changes in land use. The ocean is the largest reservoir of CO2, and it contains 50 times that for the atmosphere and 19 times that for the terrestrial biosphere (Water Encyclopedia 2005). All of the two way exchanges are considered in this paper to be comprised of both the non-fossil component and the anthropogenic fossil component. Annual changes, DCNF(t) in CNF(t), in the atmosphere relative to the 1750 initial value, C(0), can be positive or negative depending on the net flow of CO2 between the atmosphere and its exchange reservoirs as well as on land use changes.
A one-way pathway of anthropogenic fossil CO2 into the atmosphere from fossil fuel combustion and industrial fuel processes since 1750 is represented by annual emissions, DE(t), of anthropogenic fossil CO2 to the atmosphere, which have been increasing each year since 1750. These emissions over time t result in increasing annual mean anthropogenic fossil concentrations, CF(t), that result in values of 14C in C(t) that are increasingly lower than the initial value.
During the last long glacial period, the oceans absorbed a large amount of CO2 from the atmosphere. It appears in the figure that Earth is still in the Holocene interglacial period that started 11,500 y ago. Its peak temperature change over the 11,500 years, thus far in 1950, appears to be significantly less than those over the three previous interglacial periods. Its peak CO2 appears less than 300 ppm and less than the peak value in the previous interglacial period. Thus, the increase in CO2 that Earth has been experiencing since 1800 appears to have started more than 5,000 years ago.
A Wikipedia link for14C describes the increase in the concentration of 14CO2 in the atmosphere that resulted from high altitude nuclear bomb tests, circa 1955–1963. Based on the figure in the Wikipedia link, 14CO2 from the atmospheric bomb tests during this period would be significant in 1955 to about 2005. For the purpose of estimating the anthropogenic fossil and non-fossil components of CO2, measurements of 14C specific activities of atmospheric CO2 during this period should be corrected for the contribution from bomb tests. Outside of this period, no correction would be required.
The methodology used to calculate fossil concentrations CF(t) and non-fossil CNF(t) relies on two accepted facts:
(1) the initial total mole fraction C(0) of (280 ± 10) ppm before 1750 has been essentially constant for several thousand years (Prentice et al. 2018) and
(2) the production rate of 14C atoms in the atmosphere has been essentially constant for at least 15,000 years (Eisenbud 1997).
Therefore, the steady-state activity of 14C per unit volume of the atmosphere also would have been constant except for the redistribution of CO2 in the atmosphere in each year with its exchange reservoirs. The product is proportional to the activity per unit volume of the atmosphere, which varies each year depending on whether there is a net input or output, DCNF(t), of non-anthropogenic fossil CO2 in the atmosphere. The change in the product each year is independent of the value of CF(t) in the atmosphere because it contains no activity of 14C . Also, except for the dilution of S(0) by the anthropogenic fossil component, C(t), present in the atmosphere each year, the 14C would have remained constant at our chosen initial value, S(0), of 16.33 dpm (gC)−1 in 1750.

Based on a molecular weight of 44.01 g mole−1 for CO, the total mass of anthropogenic fossil CO2 present in the atmosphere in 2018 is calculated as 3.664 × 10¹⁷ g. The Table 2 value of 1,589.86 billion metric tons of anthropogenic fossil-derived CO2 emitted into the atmosphere in 1751 through 2018 (EIA 2020a and 2020b) represents 1.590 × 10¹⁸ g. The inference is that the quantity of anthropogenic fossil CO2 in the atmosphere in 2018 represents about 23% of the total amount of anthropogenic fossil-derived CO2 that had been released to the atmosphere since 1750.
Therefore, 77% of the total anthropogenic fossil emissions of CO2 then would be present in the atmosphere’s exchange reservoirs in 2018. These results differ significantly from those reported by others:
The assumption that the increase in CO2 since 1800 is dominated by or equal to the increase in the anthropogenic component is not settled science. Unsupported conclusions of the dominance of the anthropogenic fossil component of CO2 and concerns of its effect on climate change and global warming have severe potential societal implications that press the need for very costly remedial actions that may be misdirected, presently unnecessary, and ineffective in curbing global warming.
Footnote On Elements and Isodopes
The study above, along with the foibles of the current US administration, reminds me of this announcement of a newly discovered element.
The new element is Governmentium (Gv). It has one neutron, 25 assistant neutrons, 88 deputy neutrons and 198 assistant deputy neutrons, giving it an atomic mass of 312, the heaviest of all. These 312 particles are held together by forces called morons, which are surrounded by vast quantities of lefton-like particles called peons.
Since Governmentium has no electrons or protons, it is inert. However, it can be detected, because it impedes every reaction with which it comes into contact. A tiny amount of Governmentium can cause a reaction normally taking less than a second to take from four days to four years to complete.
Governmentium has a normal half-life of 3-6 years. It does not decay but instead undergoes a reorganization in which a portion of the assistant neutrons and deputy neutrons exchange places. In fact, Governmentium’s mass will actually increase over time, since each reorganization will cause more morons to become neutrons, forming isodopes.
This characteristic of moron promotion leads some scientists to believe that Governmentium is formed whenever morons reach a critical concentration. This hypothetical quantity is referred to as critical morass.
When catalyzed with money, Governmentium becomes Administratium, an element that radiates just as much energy as Governmentium since it has half as many peons but twice as many morons. All of the money is consumed in the exchange, and no other byproducts are produced. It tends to concentrate at certain points such as government agencies, large corporations, and universities. Usually it can be found in the newest, best appointed, and best maintained buildings.
Scientists point out that administratium is known to be toxic at any level of concentration and can easily destroy any productive reaction where it is allowed to accumulate. Attempts are being made to determine how administratium can be controlled to prevent irreversible damage, but results to date are not promising.
Credit: William DeBuvitz, Heaviest Element Discovered
via Science Matters
https://ift.tt/3FGugYz
January 19, 2022 at 11:15AM