
The accuracy of the long-term global instrumental temperature record – especially the data obtained before the 1970s – wholly rests on the assumption that sailors obtained precisely reliable temperature measurements as they pulled wooden or canvas buckets out of the water from ships at random depths, locations, and times of day. They didn’t.
It has long been known that pulling a bucket out of the water from a ship is rooted in serious error, rendering the sea surface temperature (SST) data obtained nearly useless. Ashford (1948) summarized some of the more salient reliability problems with this method of measurement.
• The initial temperature of the bucket is generally different from that of the sea.
• The water in the bucket may change its temperature before the reading is taken owing to the processes of heat exchange and evaporation.
• The initial temperature of the thermometer is generally different from that of the sample.
• The thermometer is liable to scale errors.
• Owing to thermal lag, the thermometer may take an appreciable time to indicate the true temperature of the sample.
• If the thermometer is removed from the bucket when taking the reading, it may no longer indicate the true water temperature.
• The temperature may be read incorrectly.
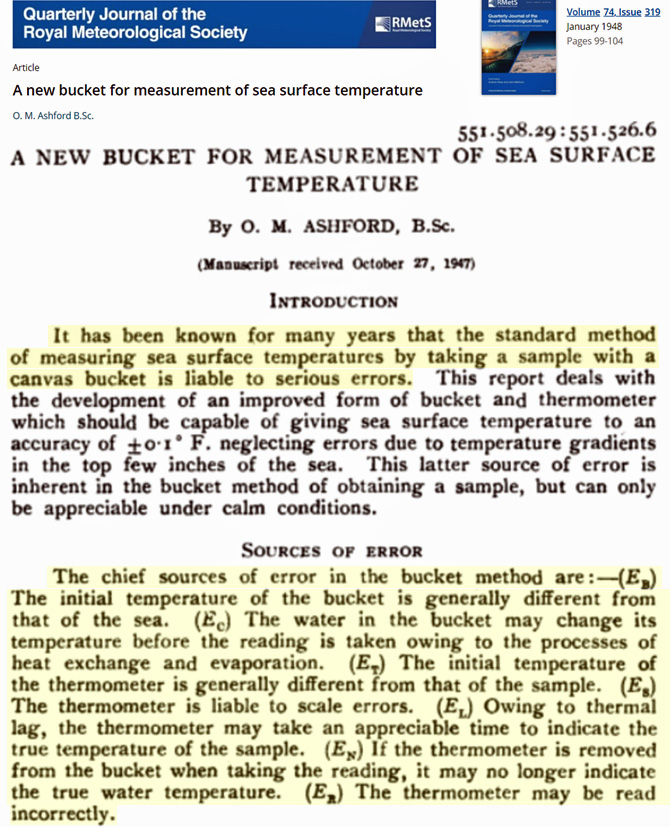
Image Source: Ashford, 1948
Pervasive systematic observational errors
There are “pervasive systematic observational errors” associated with using buckets that “affect the whole observational system and change over time” (Kennedy, 2014). The data collection errors in even one measurement from one location are much larger than the alleged long-term tenths-of-a-degree “global” SST changes over decades.
“A single SST measurement from a ship has typical combined random and systematic error uncertainty of around 1 K to 1.5 K.”
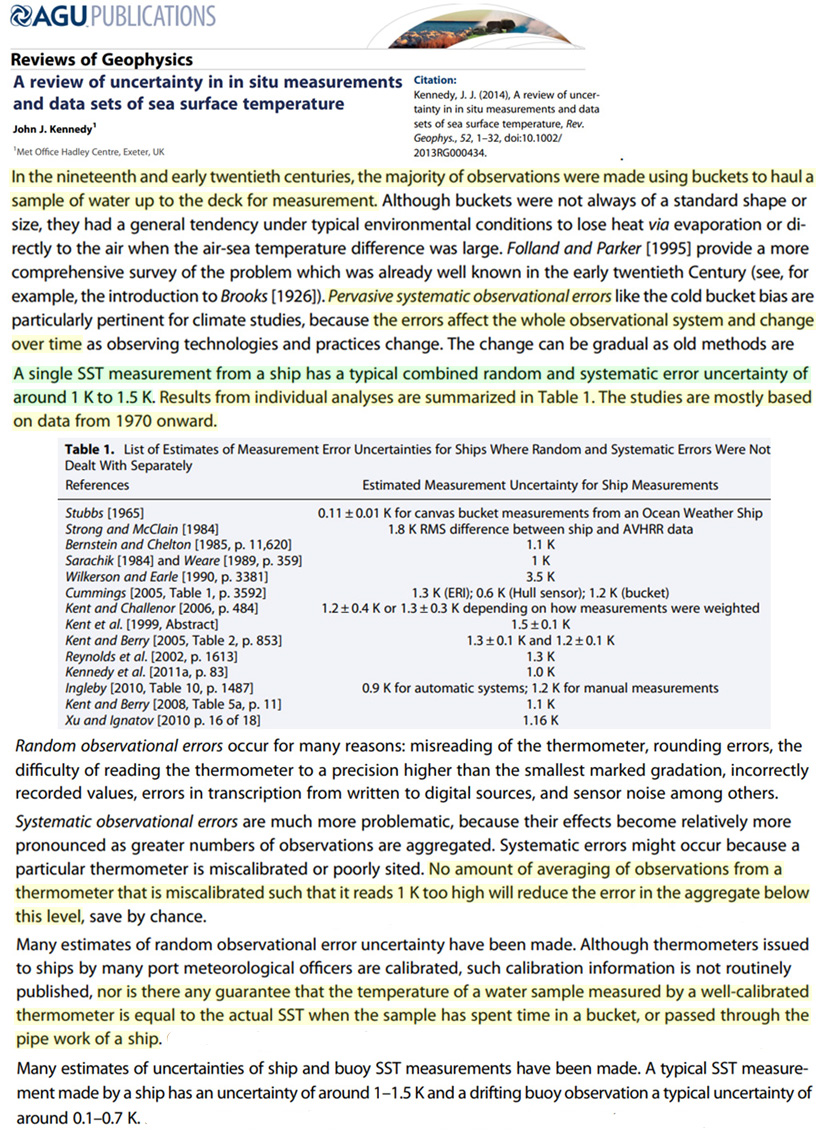
Image Source: Kennedy, 2014
Depth sampling errors
In the ocean, water temperature varies by multiple degrees according to depth, as there are “measurable temperature gradients within the depth range of ship SST measurements” (Kennedy, 2014). The temperature at 1 meter depth could be 2°C warmer than the temperature at 10 meters. There was no uniform systematic method governing how deep the buckets needed to be as they were lowered into the ocean.
When pulling the bucket out of the water, there was no way to isolate a specific depth measurement anyway, as it was all mixed together as the bucket was lifted to the surface. To control for depth variations, sailors would have needed to regularly measure near-surface waters at a range of depths at specific times of the day and evening. They didn’t do this, of course.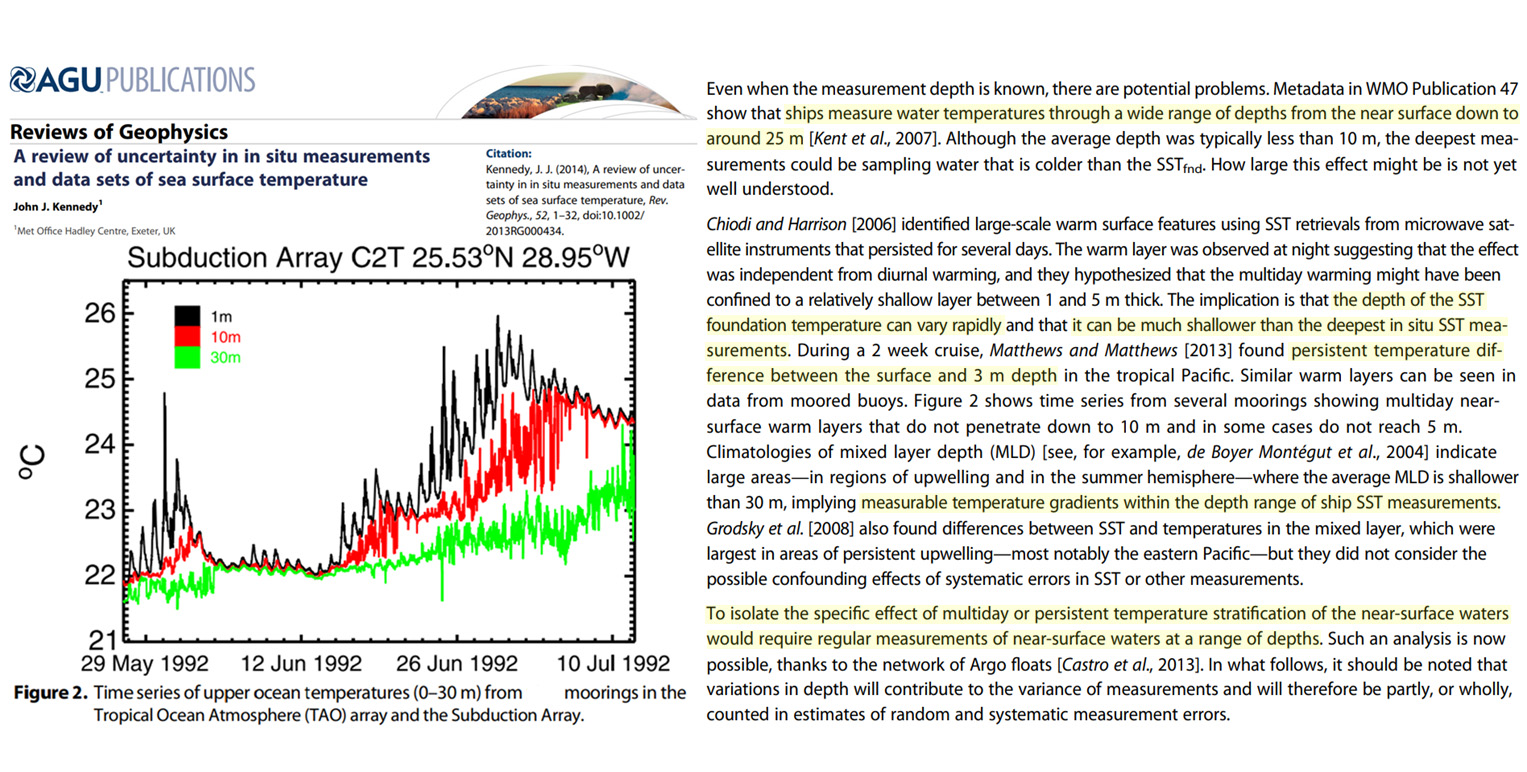
Image Source: Kennedy, 2014
Diurnal variation errors
Over the span of just 10 to 12 hours the temperature of near-surface sea water can vary by 5°C (Kawai and Wada, 2007) due to the degree of sunshine duration and intensity (clear-sky vs. overcast). In tropical locations, SSTs can change by as much as 8°C within hours, depending on the time of day (Randall et al., 2020).
Therefore, to accurately record SST measurements requires obtaining maximum and minimum temperature readings. This would mean sailors needed to be lowering buckets into the water at uniform and standardized times of the day, or perpetually measuring temperatures throughout the day and night to control for diurnal variability. They didn’t do this, of course.
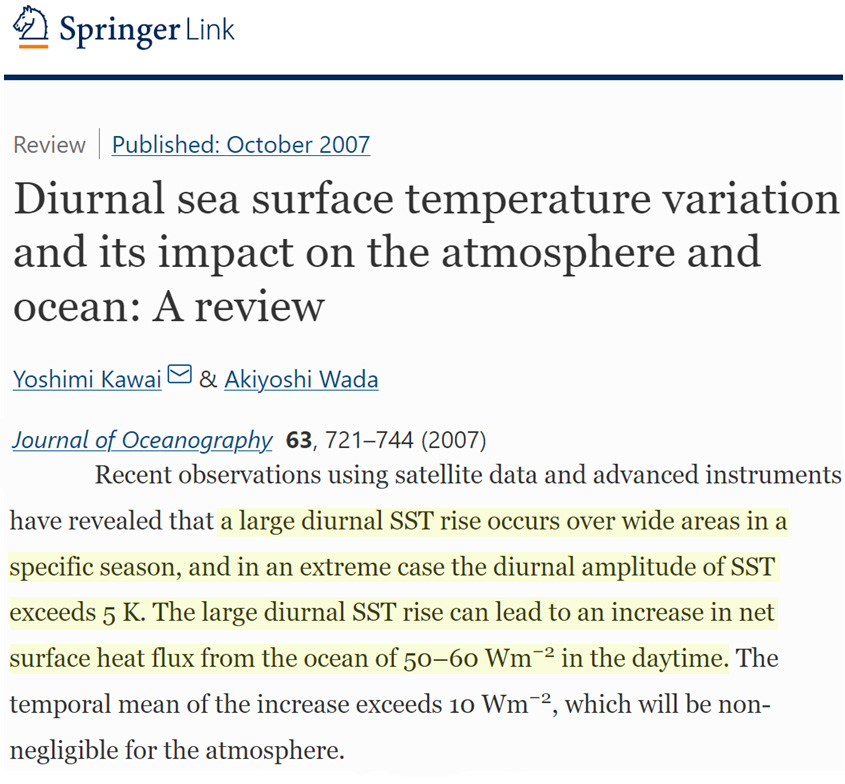
Image Source: Kawai and Wada, 2007
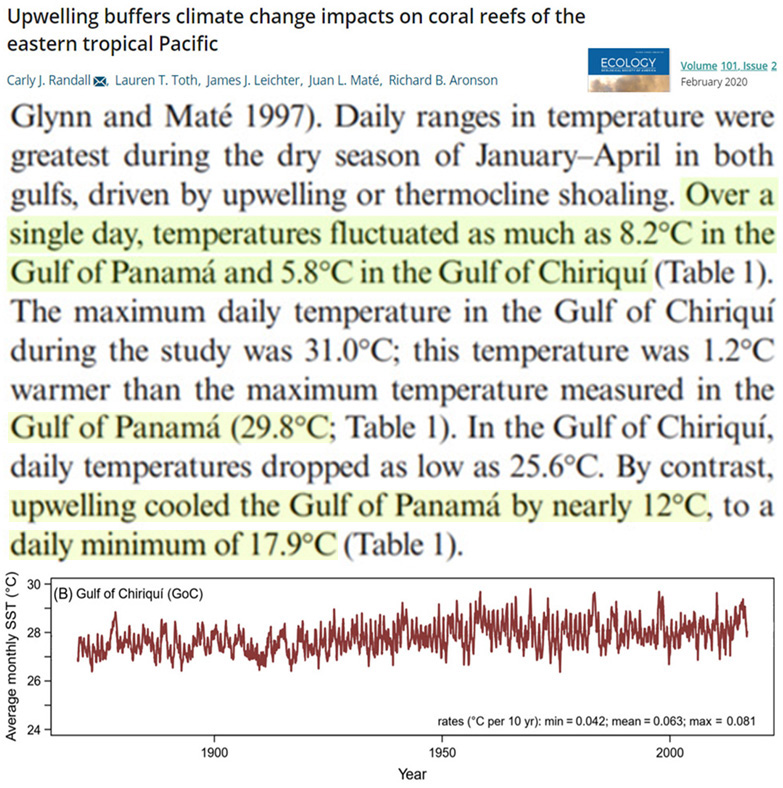
Image Source: Randall et al., 2020
“Largely missing” observational coverage means modeled extrapolations are needed
Perhaps the most underreported problem with obtaining reliable SST measurements prior to recent decades has been the ridiculously non-global nature of the coverage. Most pre-1970s SST measurements came from coastal waters in the North Atlantic, Mediterranean, and Indian Oceans.
Per Folland and Parker (1995), there has long been “sparse coverage of the Pacific,” and “even in recent decades [1970s and 1980s], the Southern Ocean south of 45°S is largely missing.” If we have “largely missing” SST data from 45°S to the coasts of Antarctica up until the 1980s, we effectively cannot say we have a pre-1980s global temperature record, as this represents nearly 20% of the Earth’s surface.
And because the coverage is so poor, the utilization of modeled interpolations of what the SSTs might have been has become the accepted standard in temperature derivation.
In 5° grid boxes, for example, monthly anomalies have been found to be “differing by more than 2.25 degC from the averages of surrounding values,” and “biases occasionally exceed 1 degC in individual months” (Folland and Parker, 1995). Consequently, the anomalies are “replaced by values interpolated from surrounding squares and from adjacent months.”
So they’re not actual measurements of SST, but interpolations of what they might have been using modeled assumptions.
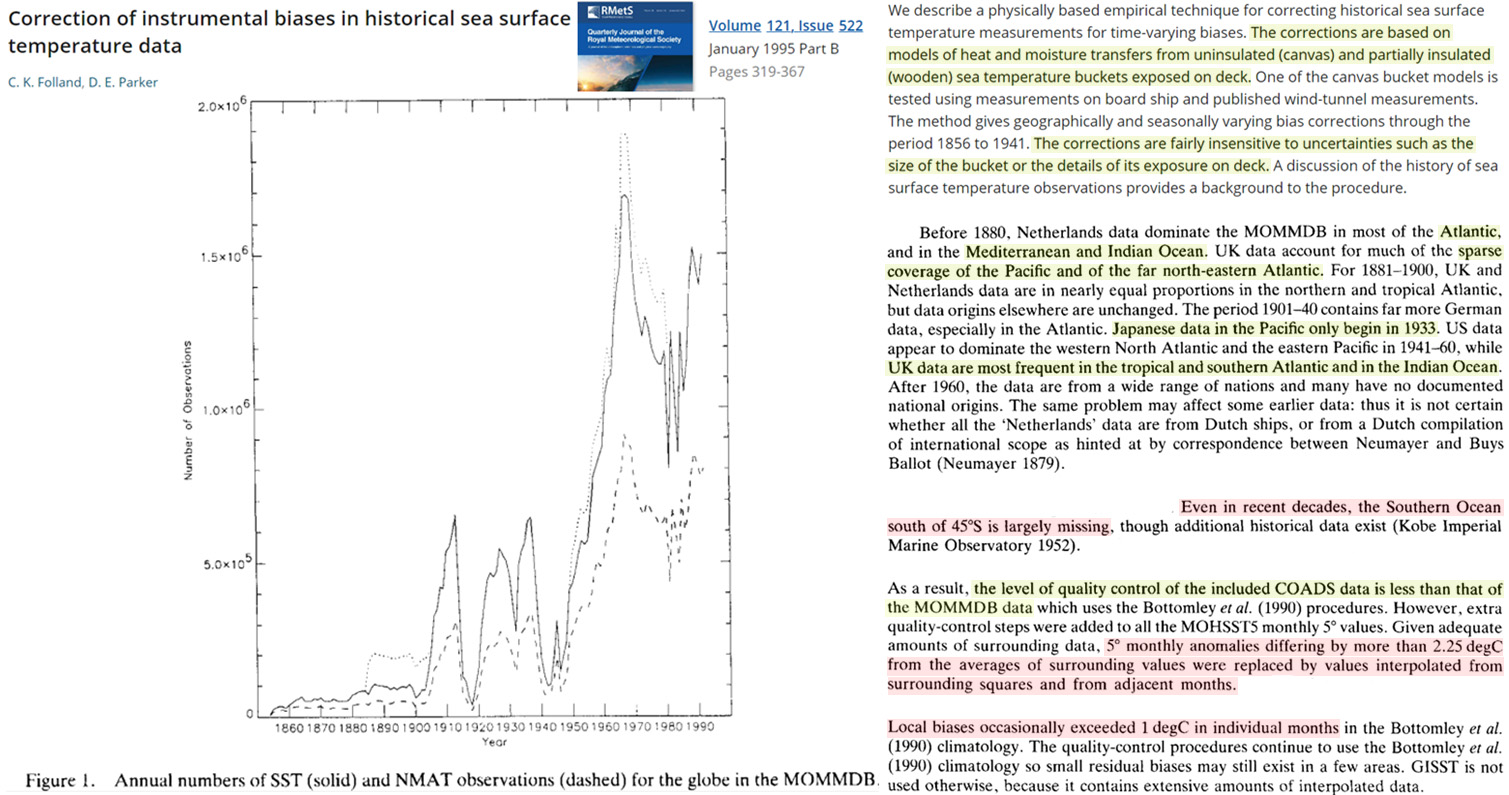
Image Source: Folland and Parker, 1995
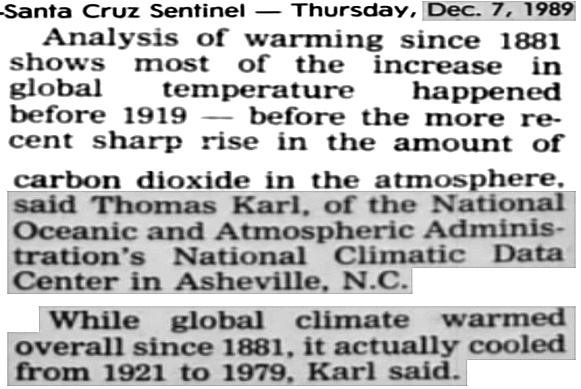
NOAA’s Thomas Karl experienced some notoriety a few years ago as the author of a “pause-buster” paper because he replaced buoy data (that showed little warming) with “unreliable data from ship intakes” so as to eliminate the problematic global warming hiatus.
But back in 1989, Karl not only reported there had been no global warming from 1921 to 1979, but that there are “large geographic areas of the oceans that have not been adequately sampled” (Karl et al., 1989), especially the tropical Pacific and south of 40°S.
Specifically, for every year from about 1850 to 1950, under 10% of the global ocean’s 2° grid boxes averaged 10 or more sea surface observations (from pulling buckets out of the water) per month. That’s the extent of the instrumental “global” record for 71% of the Earth’s surface.
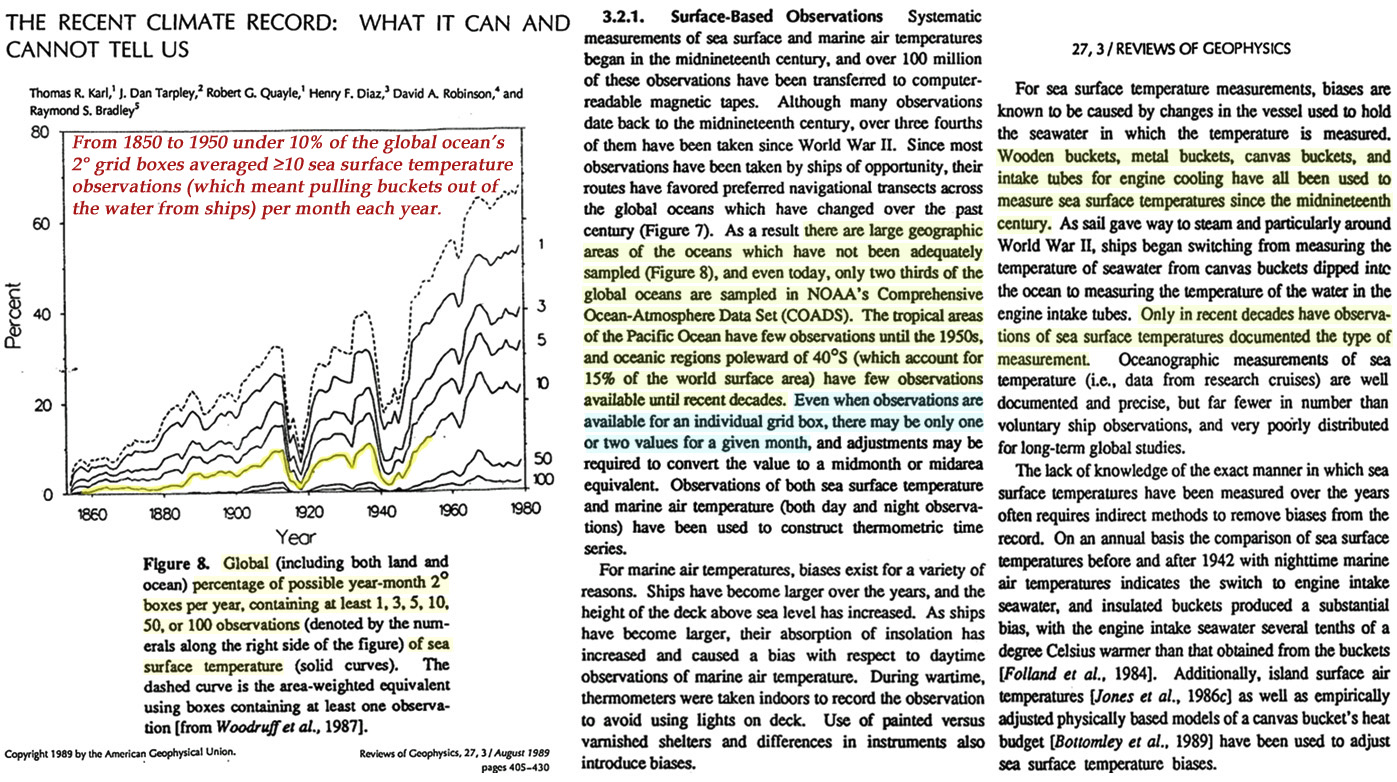
Image Source: Karl et al., 1989
Given the pervasive systematic errors, depth temperature variability, diurnal temperature variability, need for modeled interpolations, and shamefully poor non-global sampling coverage associated with sailors pulling buckets out of the water at random times of the day or night in the derivation of a “global” sea surface temperature record, it’s not surprising that temperature data set overseers privately admit to one another that SST data are “mostly made up.”
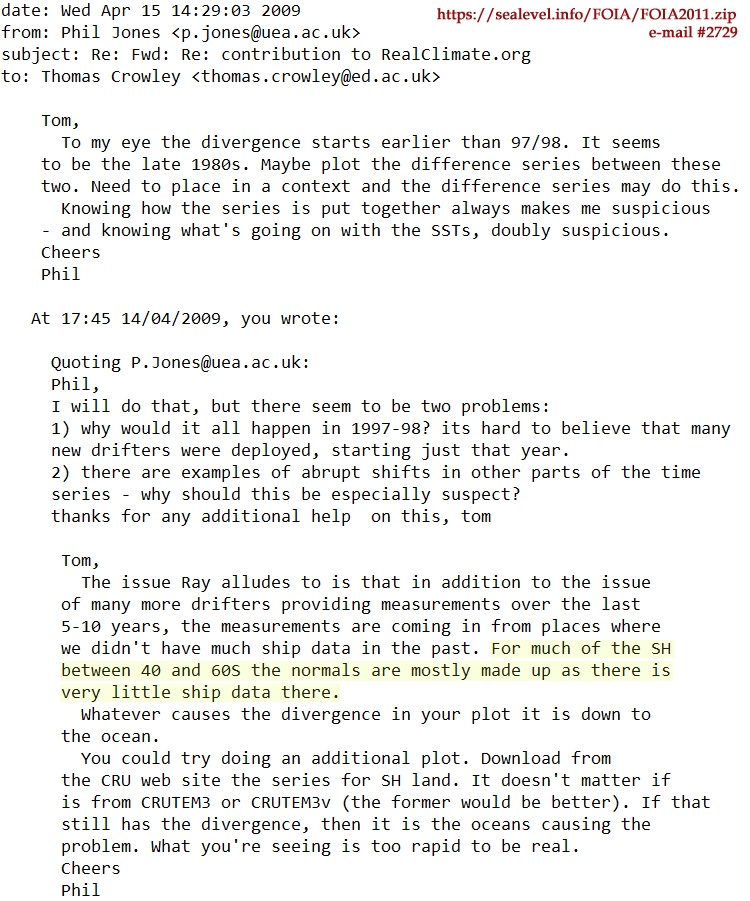
Image Source: FOIA, e-mail #2729
via NoTricksZone
September 8, 2022 at 11:50AM
