Month: January 2023

Climate change makes heat waves, storms and droughts worse–Say weather attribution models

By Paul Homewood

This new report is making the rounds:


 image

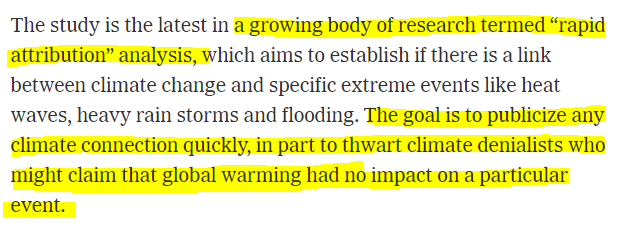
Climate change is causing the weather around the world to get more extreme, and scientists are increasingly able to pinpoint exactly how the weather is changing as the Earth heats up.

A sweeping new report by top climate scientists and meteorologists describes how climate change drove unprecedented heat waves, floods and droughts in recent years. The annual report from the American Meteorological Society (AMS) compiles the leading science about the role of climate change in extreme weather.

"It’s a reminder that the risk of extreme events is growing, and they’re affecting every corner of the world," says Sarah Kapnick, the chief scientist at the National Oceanographic and Atmospheric Administration (NOAA).

The Earth is already about 2 degrees Fahrenheit hotter than it was in the late 1800s, and scientists warn that humans must cut greenhouse gas emissions in half this decade to avoid catastrophic warming later this century.

One way to understand and predict the effects of a hotter Earth is to look for the fingerprints of climate change on extreme weather events such as floods, heat waves and droughts. The last decade has seen huge leaps forward for the field known as extreme-event attribution science, which uses statistics and climate models to detect global warming’s impact on weather disasters. The extreme drought in California and Nevada in 2021, for example, was six times more likely because of climate change.

One of the big takeaways from the new report is that heat waves that used to be virtually impossible are increasingly likely.

"Extreme heat events are more extreme than ever," says Stephanie Herring, one of the authors of the report and a scientist at NOAA. "Research is showing they’re likely to become the new normal in the not so distant future."

https://www.npr.org/2023/01/09/1147805696/climate-change-makes-heat-waves-storms-and-droughts-worse-climate-report-confirm


Note that their so-called evidence is climate attribution modelling, which by definition is not evidence at all. Ross McKittrick, Professor of Economics, produced a paper in 2021 which destroyed the credibility of attribution modelling because of fundamental statistical flaws in the modelling.

One day after the IPCC released the AR6 I published a paper in Climate Dynamics showing that their “Optimal Fingerprinting” methodology on which they have long relied for attributing climate change to greenhouse gases is seriously flawed and its results are unreliable and largely meaningless. Some of the errors would be obvious to anyone trained in regression analysis, and the fact that they went unnoticed for 20 years despite the method being so heavily used does not reflect well on climatology as an empirical discipline.

My paper is a critique of “Checking for model consistency in optimal fingerprinting” by Myles Allen and Simon Tett, which was published in Climate Dynamics in 1999 and to which I refer as AT99. Their attribution methodology was instantly embraced and promoted by the IPCC in the 2001 Third Assessment Report (coincident with their embrace and promotion of the Mann hockey stick). The IPCC promotion continues today: see AR6 Section 3.2.1. It has been used in dozens and possibly hundreds of studies over the years. Wherever you begin in the Optimal Fingerprinting literature (example), all paths lead back to AT99, often via Allen and Stott (2003). So its errors and deficiencies matter acutely.

https://judithcurry.com/2021/08/18/the-ipccs-attribution-methodology-is-fundamentally-flawed/

Other scientific experts have been less reticent in their criticism. Professor Roger Pielke Jr for instance:

https://notalotofpeopleknowthat.files.wordpress.com/2021/07/image-63.png

https://twitter.com/RogerPielkeJr/status/1417882876977184768?ref_src=twsrc%5Etfw%7Ctwcamp%5Etweetembed%7Ctwterm%5E1417882876977184768%7Ctwgr%5E%7Ctwcon%5Es1_&ref_url=https%3A%2F%2Fwww.climatedepot.com%2F2021%2F07%2F21%2Fextreme-weather-expert-dr-roger-pielke-jr-rips-event-attribution-science-as-the-relaxing-of-rigor-standards-in-order-to-generate-claims-more-friendly-to-headlines-political-advocacy-eve%2F

And Obama’s Climate Scientist, Steve Koonin, has commented:

Image

It is significant that in this latest paper there is no attempt to use real world data to prove that the events they talk of are actually getting worse. We know, for instance, that the data on hurricanes shows that they are not, a fact which is even acknowledged by official bodies such as NOAA.

Weather attribution has been politicised since its early beginnings, and is undertaken for the express purpose of linking extreme weather to climate change. It should not be confused with real science.

via NOT A LOT OF PEOPLE KNOW THAT

https://ift.tt/n0hmAB1

January 10, 2023 at 11:08AM

Solar Fantasies at the BBC

Early this afternoon, I was pondering a report whose subject need not concern us here. As often happens, my attention wandered. I threw down my pencil stared out at the slate-grey sky. For a moment I wished I could fast-forwards four months to the bright days of May.

Then I made the mistake of clicking on the BBC News website when I should have been getting on with what I was supposed to be getting on with. There it was, in black and white, or black and 10% grey:

Well, my answer was no.

But I compounded my mistake by clicking on the story.

First, we are told that small islands in Indonesia need electricity.

“Those people who don’t have electricity are living on remote islands, so in this situation it’s hard to connect a cable to them and it’s hard to install other expensive solutions such as wind turbines,” says Luofeng Huang, a lecturer in mechanical engineering at Cranfield University.

Something is coming through… wait, I’ve got it! We give the remote islands diesel generators.

Solar power is one option to provide those islands with energy. It has become much cheaper in recent decades – the International Energy Agency (IEA) says that it is becoming the cheapest option for new electricity power plants.

No, I haven’t followed the link to see what rat hole it wriggles down. Solar electricity migh be cheap, but I wouldn’t want to power my house by it, and neither would the BBC reporter. Half the time it is dark.

At any rate, solar does have acknowledged problems: slavery, non-recyclability, sourcing rare earths, etc. And it takes up a lot of room. [Is this something that the BBC has noticed re: solar farms in the UK?]

So scientists and engineers are working on ways to install solar panels on the ocean surface, providing power to those living onshore nearby.

“Floating solar is very convenient because it can just be put on top of the water, and if you need more electricity you can put on more solar panels,” says Mr Huang.

Yes. And if my pint glass is empty, I can sashay to the bar and purchase another beer, albeit at the outrageous cost of about four quid. Science moves on apace. At this stage the BBC reporter acknowledges that waves and sea water are likely to smithereen your attempt at installing solar panels on the ocean surface. But wait! All is not lost! There are answers.

First we have SolarDuck, which is planning to install solar panels in the North Sea, raised above the damaging waves. The Duck farm is going to be attached to a wind farm to share export cables, and is due to begin operations in 2026. Good luck finding a mug who will pay for that. Wait, it’s probably us.

Solarduck via pv-magazine.fr

Meanwhile, we have Ocean Sun, who are making circular floats covered in solar panels (see featured image). It’s a sort of electrified swimming pool cover and flexes with the waves, thereby avoiding being damaged by them.

Huang, the expert from Cranfield dismisses both designs. One will be expensive because it is raised up so high. The other will be bashed to bits. I agree with him. These are two solar fantasies. But Huang has a fantasy of his own, called the Solar2Wave system (where do they get these wonderful names?). Solar2Wave swings into the swell, and has a wavebreak at what will hopefully always be the leading edge. The demonstration project will be floating in the Indian Ocean in 12 months’ time.

Sorry, no. This one is going to fail too. Or am I just being cynical? Perhaps. Would I have willingly boarded the USS Monitor?

A final ecological note:

The pH of open water varies diurnally. During the day, algae fix CO2 and produce O2 as a “waste product.” The consequence is increasing pH. At night, no photosynthesis is possible, only respiration. This results in increasing amounts of dissolved CO2 and, you guessed it, a decrease in pH. Now let’s imagine you cover most of a bay with solar panels. What happens to the pH?

The BBC report ends with:

Solar farms could even be sited far out at sea where they could serve as refuelling points for electric ships.

If you believe that, you will also believe that spaghetti grows on bushes, or that your iPhone can be made waterproof by a software update.

via Climate Scepticism

https://ift.tt/YI08wzO

January 10, 2023 at 10:04AM

Swiss Central Bank Bets on US and Loses

Tyler Durden reports at Zerohedge Massive Hedge Fund, Also Known As Swiss National Bank, Suffers Colossal $143 Billion Loss In 2022.  Excerpts in italics with my bolds.

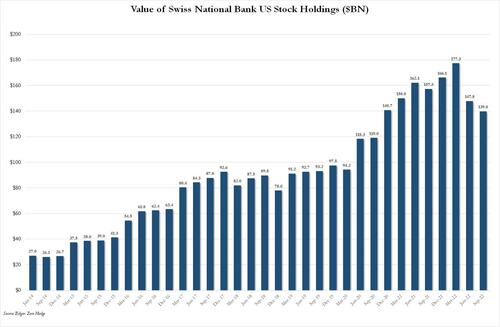
The last time we looked at the massive money-printing (literally) hedge fund that also moonlights as the Swiss National Bank, we were stunned to learn that its US equity holdings had exploded to a record $177 billion at the end of Q1 2022, orders of magnitude more than the mere $27 billion it held as recently as 2014.

But while we wait for the SNB’s year-end 13F which should be published in about a month’s time, we already know the damage suffered by the Swiss hedge fund in 2021 and it is staggering: on Monday, the SNB reported an annual loss of 132 billion Swiss francs, or $143 billion, for fiscal 2022, the biggest loss in its 115-year history as falling stock and fixed-income markets hit the value of its share and bond portfolio. The recent drop in the US Dollar also did not help.

Monday’s provisional figure, which marked a reverse from a 26 billion franc profit in 2021, was far bigger than the previous record loss of 23 billion francs chalked up in 2015, and according to Reuters, it is equivalent to slightly more than the annual GDP of Morocco.

According to the bank, the bulk of the loss, or 131 billion francs, was from its foreign currency positions – a broad term used to describe the more than 800 billion francs in stocks and bonds the SNB bought during a long campaign to weaken the Swiss franc. Indicatively, the amount is also almost precisely the same as the GDP of Switzerland.

The losses accelerated as global stock and bond markets tumbled in unison – 2022 was the first year in over a century when both stock and bond market suffered double digit losses – as central banks around the world, including the SNB, hiked interest rates to combat inflation. Meanwhile, the strong Swiss franc – which rose above parity against the euro in July – also led to exchange rate-related losses.

And while the SNB lost money in pretty much everything there was one solitary asset class that generated a profit (take a wild guess which one): that’s right, the SNB’s gold holdings which stood at 1,040 tonnes at the end of 2021, gained 400 million francs in value during 2022.

The 2022 loss meant the central bank will not make its usual payout
to the Swiss central and regional governments, it said.

Last year the SNB paid out 6 billion francs. In fact, if the SNB followed similar accounting rules and logic as any other bank, it would have been wiped out with a loss that obliterated all of its equity capital. But in the magical world of seigniorage, where central banks are assumed to be able to print – again, literally – their way out of everything, the bank never loses and the SNB will continue its merry existence as if nothing happened.

Still, the loss is unlikely to have an impact on SNB policy. It hiked interest rates three times in 2022 as Chairman Thomas Jordan moved to stem high Swiss inflation, analysts said.

“The SNB’s colossal losses will not change its monetary policy at all,” said Karsten Junius, an economist at J.Safra Sarasin. “The high reputation of the SNB helps that it doesn’t have to change anything.”

Well, it may have a record loss that’s bigger than the GDP of most medium-sized countries, but at least it has its “high reputation” earned courtesy of years of laborious and exhausting… money printing.

And yes, because we live in a kangaroo world in which there are never any adverse consequences for colossal central bank stupidity, the SNB’s monetary policy will most certainly not change at all.

via Science Matters

https://ift.tt/azN9Qg8

January 10, 2023 at 09:23AM

Ocean Temps Warm Slightly December 2022


The best context for understanding decadal temperature changes comes from the world’s sea surface temperatures (SST), for several reasons:

  • The ocean covers 71% of the globe and drives average temperatures;
  • SSTs have a constant water content, (unlike air temperatures), so give a better reading of heat content variations;
  • A major El Nino was the dominant climate feature in recent years.

HadSST is generally regarded as the best of the global SST data sets, and so the temperature story here comes from that source. Previously I used HadSST3 for these reports, but Hadley Centre has made HadSST4 the priority, and v.3 will no longer be updated.  HadSST4 is the same as v.3, except that the older data from ship water intake was re-estimated to be generally lower temperatures than shown in v.3.  The effect is that v.4 has lower average anomalies for the baseline period 1961-1990, thereby showing higher current anomalies than v.3. This analysis concerns more recent time periods and depends on very similar differentials as those from v.3 despite higher absolute anomaly values in v.4.  More on what distinguishes HadSST3 and 4 from other SST products at the end. The user guide for HadSST4 is here.

The Current Context

The chart below shows SST monthly anomalies as reported in HadSST4 starting in 2015 through December 2022.  A global cooling pattern is seen clearly in the Tropics since its peak in 2016, joined by NH and SH cycling downward since 2016. 

Note that in 2015-2016 the Tropics and SH peaked in between two summer NH spikes.  That pattern repeated in 2019-2020 with a lesser Tropics peak and SH bump, but with higher NH spikes. By end of 2020, cooler SSTs in all regions took the Global anomaly well below the mean for this period.  In 2021 the summer NH summer spike was joined by warming in the Tropics but offset by a drop in SH SSTs, which raised the Global anomaly slightly over the mean.

Then in 2022, another strong NH summer spike peaked in August, but this time both the Tropic and SH were countervailing, resulting in only slight Global warming, later receding to the mean.   Oct./Nov. temps dropped  in NH and the Tropics took the Global anomaly below the average for this period. Now in December an uptick in SH has lifted the Global anomaly slightly above the mean.

A longer view of SSTs

To enlarge image open in new tab.

The graph above is noisy, but the density is needed to see the seasonal patterns in the oceanic fluctuations.  Previous posts focused on the rise and fall of the last El Nino starting in 2015.  This post adds a longer view, encompassing the significant 1998 El Nino and since.  The color schemes are retained for Global, Tropics, NH and SH anomalies.  Despite the longer time frame, I have kept the monthly data (rather than yearly averages) because of interesting shifts between January and July.1995 is a reasonable (ENSO neutral) starting point prior to the first El Nino. 

The sharp Tropical rise peaking in 1998 is dominant in the record, starting Jan. ’97 to pull up SSTs uniformly before returning to the same level Jan. ’99. There were strong cool periods before and after the 1998 El Nino event. Then SSTs in all regions returned to the mean in 2001-2. 

SSTS fluctuate around the mean until 2007, when another, smaller ENSO event occurs. There is cooling 2007-8,  a lower peak warming in 2009-10, following by cooling in 2011-12.  Again SSTs are average 2013-14.

Now a different pattern appears.  The Tropics cooled sharply to Jan 11, then rise steadily for 4 years to Jan 15, at which point the most recent major El Nino takes off.  But this time in contrast to ’97-’99, the Northern Hemisphere produces peaks every summer pulling up the Global average.  In fact, these NH peaks appear every July starting in 2003, growing stronger to produce 3 massive highs in 2014, 15 and 16.  NH July 2017 was only slightly lower, and a fifth NH peak still lower in Sept. 2018.

The highest summer NH peaks came in 2019 and 2020, only this time the Tropics and SH were offsetting rather adding to the warming. (Note: these are high anomalies on top of the highest absolute temps in the NH.)  Since 2014 SH has played a moderating role, offsetting the NH warming pulses. After September 2020 temps dropped off down until February 2021.  Now in 2021-22 there are again summer NH spikes, but in 2022 moderated first by cooling Tropics and SH SSTs, now in October and November by deeper cooling in NH and Tropics.

What to make of all this? The patterns suggest that in addition to El Ninos in the Pacific driving the Tropic SSTs, something else is going on in the NH.  The obvious culprit is the North Atlantic, since I have seen this sort of pulsing before.  After reading some papers by David Dilley, I confirmed his observation of Atlantic pulses into the Arctic every 8 to 10 years.

But the peaks coming nearly every summer in HadSST require a different picture.  Let’s look at August, the hottest month in the North Atlantic from the Kaplan dataset.

The AMO Index is from from Kaplan SST v2, the unaltered and not detrended dataset. By definition, the data are monthly average SSTs interpolated to a 5×5 grid over the North Atlantic basically 0 to 70N. The graph shows August warming began after 1992 up to 1998, with a series of matching years since, including 2020, dropping down in 2021.  Because the N. Atlantic has partnered with the Pacific ENSO recently, let’s take a closer look at some AMO years in the last 2 decades.

This graph shows monthly AMO temps for some important years. The Peak years were 1998, 2010 and 2016, with the latter emphasized as the most recent. The other years show lesser warming, with 2007 emphasized as the coolest in the last 20 years. Note the red 2018 line is at the bottom of all these tracks. The heavy blue line shows that 2022 started warm, dropped to the bottom and stayed near the lower tracks.  Note the strength of this summer’s warming pulse, in September peaking to nearly 24 Celsius, a new record for this dataset. In November the SSTs were closer to the middle.

Summary

The oceans are driving the warming this century.  SSTs took a step up with the 1998 El Nino and have stayed there with help from the North Atlantic, and more recently the Pacific northern “Blob.”  The ocean surfaces are releasing a lot of energy, warming the air, but eventually will have a cooling effect.  The decline after 1937 was rapid by comparison, so one wonders: How long can the oceans keep this up? If the pattern of recent years continues, NH SST anomalies will likely decline in coming months, along with ENSO also weakening will probably determine a cooler outcome.

Footnote: Why Rely on HadSST4

HadSST is distinguished from other SST products because HadCRU (Hadley Climatic Research Unit) does not engage in SST interpolation, i.e. infilling estimated anomalies into grid cells lacking sufficient sampling in a given month. From reading the documentation and from queries to Met Office, this is their procedure.

HadSST4 imports data from gridcells containing ocean, excluding land cells. From past records, they have calculated daily and monthly average readings for each grid cell for the period 1961 to 1990. Those temperatures form the baseline from which anomalies are calculated.

In a given month, each gridcell with sufficient sampling is averaged for the month and then the baseline value for that cell and that month is subtracted, resulting in the monthly anomaly for that cell. All cells with monthly anomalies are averaged to produce global, hemispheric and tropical anomalies for the month, based on the cells in those locations. For example, Tropics averages include ocean grid cells lying between latitudes 20N and 20S.

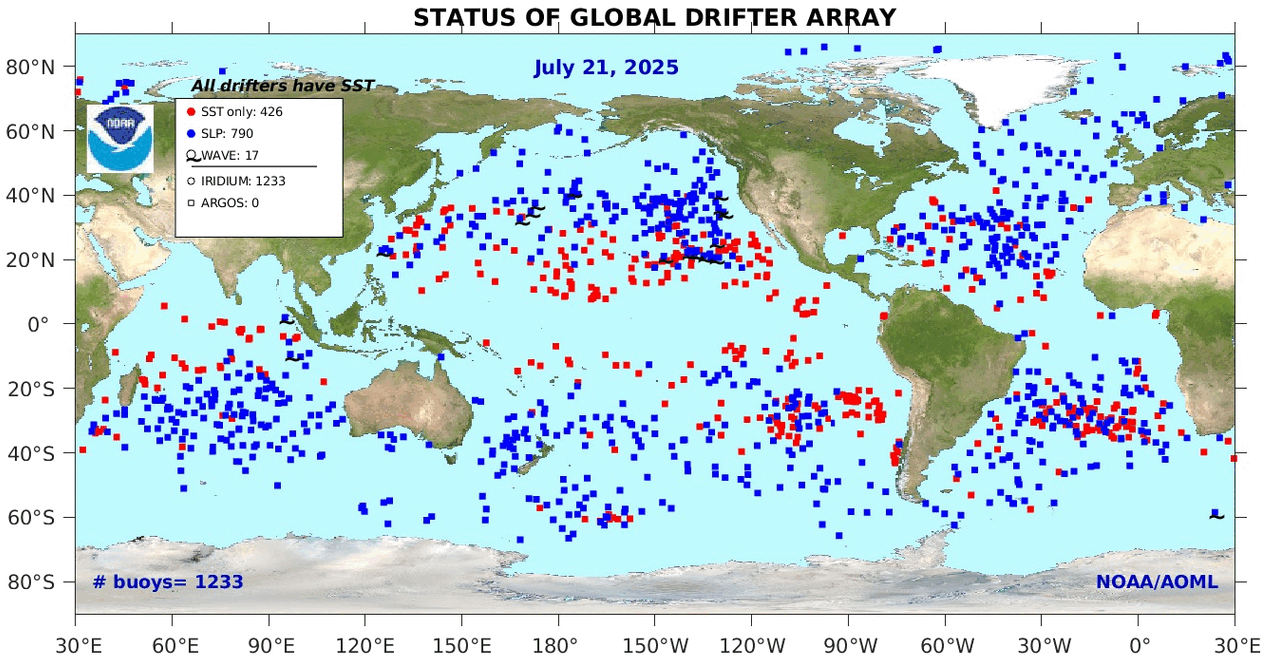
Gridcells lacking sufficient sampling that month are left out of the averaging, and the uncertainty from such missing data is estimated. IMO that is more reasonable than inventing data to infill. And it seems that the Global Drifter Array displayed in the top image is providing more uniform coverage of the oceans than in the past.

uss-pearl-harbor-deploys-global-drifter-buoys-in-pacific-ocean

USS Pearl Harbor deploys Global Drifter Buoys in Pacific Ocean

Footnote Rare Triple Dip La Nina Likely This Winter

Here’s Where a Rare “Triple Dip La Niña” Might Drop the Most Snow This Winter Ski Mag

The unusual weather phenomenon might result in the snowiest season in years for some parts of the country.

The long-range winter forecast could be good news for skiers living in the certain parts of the U.S. and Canada. The National Oceanic and Atmospheric Administration (NOAA) estimates that the chance of a La Niña occurring this fall and early winter is 86 percent, and the main beneficiary is expected to be mountains in the Northwest and Northern Rockies.

If NOAA’s predictions pan out, this will be the third La Niña in a row—a rare phenomenon called a “Triple Dip La Niña.” Between now and 1950, only two Triple Dips have occurred.

Smith also notes that winters on the East Coast are similarly tricky to predict during La Niña years. “In the West, you’re simply looking for above-average precipitation, which typically translates to above-average snowfall, but in the East, you have temperature to worry about as well … that adds another complication.” In other words, increased precip could lead to more rain if the temperatures aren’t cooperative.

The presence of a La Niña doesn’t always translate to higher snowfall in the North, either, as evidenced by last ski season, which saw few powder days.

However, in consecutive La Niña triplets, one winter usually involves above-average snowfall. While this historical pattern isn’t tied to any documented meteorological function, it could mean that the odds of a snowy 2022’-’23 season are higher, given the previous two La Niñas didn’t deliver the goods.


via Science Matters

https://ift.tt/ubPQr6D

January 10, 2023 at 09:04AM