
Tuesday Open Thread
0 out of 10 based on 0 rating
via JoNova
January 23, 2023 at 09:32PM
0 out of 10 based on 0 rating
via JoNova
January 23, 2023 at 09:32PM
By David Wojick
The recent deaths of seven whales off New Jersey, mostly humpbacks, got a lot of attention. The federal NOAA Fisheries agency is responsible for whales. An outrageous statement by their spokesperson got me to do some research on humpback whale deaths.
The results are appalling. The evidence seems clear that offshore wind development is killing whales by the hundreds.
Here is the statement as reported in the press:
“NOAA said it has been studying what it calls “unusual mortality events” involving 174 humpback whales along the East Coast since January 2016. Agency spokesperson Lauren Gaches said that period pre-dates offshore wind preparation activities in the region.” Gaches is NOAA Fisheries press chief.
The “unusual mortality” data is astounding. Basically the humpback death rate roughly tripled starting in 2016 and continued high thereafter. You can see it here:
But the claim that this huge jump in mortality predates offshore wind preparation activities is wildly false. In fact it coincides with the large scale onset of these activities. This strong correlation is strong evidence of causation, especially since no other possible cause has appeared.
To begin with, offshore lease sales really geared up 2015-16, with nine big sales off New Jersey, New York, Delaware and Massachusetts. These sales must have generated a lot of activity, likely including potentially damaging sonar.
In fact 2016 also saw the beginning of what are called geotechnical and site characterization surveys. These surveys are actually licensed by NOAA Fisheries, under what are called Incidental Harassment Authorizations or IHA’s.
There is some seriously misleading jargon here. IHA’s are incidental to some other activity, in this case offshore wind development. They are not incidental to the whales. In fact the term “harassment” specifically includes injuring the whales. That is called “level A harassment”.
To date NOAA has issued an astounding 46 one-year IHA’s for offshore wind sites. Site characterization typically includes the protracted use of what I call “machine gun sonar”. This shipboard device emits an incredibly loud noise several times a second, often for hours at a time, as the ship slowly maps the sea floor.
Mapping often takes many days to complete. A blaster can log hundreds of miles surveying a 10-by-10 mile site. Each IHA is typically for an entire year.
Here is a list of the IHA’s issued to date and those applied for:
There are lots of ways this sonar blasting might cause whales to die. Simply fleeing the incredible noise could cause ship strikes or fish gear entanglements, the two leading causes of whale deaths. Of the whales could be deafened, increasing their chances of being struck by a ship later on. Direct bleeding injury, like getting their ears damaged, is another known risk, possibly leading to death from infection. So there can be a big time difference between blasting and death.
Note also that these deaths need not be in the immediate vicinity of the sonar blasting, so spatial correlation is unlikely. Humpbacks in particular are prodigious travelers. One group was tracked traveling 3,000 miles in just 28 days, over 100 miles a day on average. Another group routinely migrates 5,000 miles. Both are winter-summer migrations which can happen twice a year.
Thus a sonar blasting, site characterization in one place could easily lead to multiple whale deaths hundreds of miles away. If one of these blasters suddenly goes off near a group of whales they might go off in different directions, then slowly die.
The point is that the huge 2016 jump in annual humpback mortality coincides with the huge jump in NOAA Incidental Harassment Authorizations. It is that simple and surely NOAA Fisheries knows this.
Nor is this just about humpbacks. Some of the dead whales off New Jersey are endangered sperm whales. And of course there are the severely endangered North Atlantic Right Whales, on the verge of extinction.
Even worse, the IHA’s are about to make a much bigger jump. There are eleven pending IHA applications and eight of these are for actually constructing 8 different monster wind “farms”.
Driving the hundreds of enormous monopiles that hold up the turbine towers and blades will be far louder than the sonic blasters approved to date, especially with eight sites going at once. These construction sites range from Virginia to Massachusetts, with a concentration off New Jersey and New York.
For more on this noise see my https://www.cfact.org/2022/07/26/threat-to-endangered-whales-gets-louder/
Clearly we need a moratorium on new Incidental Harassment Authorizations until the safety of the whales and other marine species can be assured. Hundreds of whales may have already been killed by offshore wind activities. The evidence is right there.
David Wojick Ph.D. is an independent analyst working at the intersection of science, technology and policy. For origins see http://www.stemed.info/engineer_tackles_confusion.html For over 100 prior articles for CFACT see http://www.cfact.org/author/david-wojick-ph-d/ Available for confidential research and consulting.
via Watts Up With That?
January 23, 2023 at 08:44PM
Cold Greta looking for a fossil fuel powered venue to warm up.
via Real Climate Science
January 23, 2023 at 08:27PM
Available Australian Bureau of Meteorology parallel maximum temperature data for Mildura – temperatures recorded from both a mercury thermometer and a platinum resistant probe on the same day in the same shelter – show no equivalence. They are different. Therefore, it is impossible to reliably compare official temperatures recorded from probes with historical temperatures recorded with mercury thermometers for the town of Mildura on the banks of the Murray River.
This has implications for claims of new record hot days for Mildura. If the issue of non-equivalence extends to all 700 automatic weather stations spread across the landmass of Australia, it was implications for the calculation of the global average temperature by NASA that relies on Bureau data. Indeed, if the instrument change has created a non-equivalence in the record, then no reliability can be placed on any claims by the Bureau and/or other scientists and institutions using Australian data, of record hot days, fewer extreme cold days or a claimed accelerated global warming trend.
I can’t know, because I was only able to secure the data for Mildura and this was following the intervention of then Minister for the Environment Josh Frydenberg back in October 2017. The intervention occurred after then popular 2GB radio broadcaster Alan Jones wrote to the Minister on my behalf asking that this data be made available to me.
It all began for me when on 23 September 2017, the Bureau reported a record hottest September day for the state of Victoria based on an instantaneous reading of 37.7 °C from its uncalibrated purpose-built temperature probe in a weather station at Mildura.
The media then repeated that this was the hottest September day ever recorded back to 1889.
Back in 1889, indeed for the period up until 1 November 1996, the Bureau used a properly calibrated mercury thermometer to measure official temperatures at Mildura.
I was sceptical of the instantaneous reading from the probe as representing a new record hot day. I set about getting access to the parallel data for Mildura that I hoped would allow me to see what the mercury thermometer in the same Stevenson screen had recorded on that day.
A Freedom of Information request, lodged by my husband John Abbot in December 2019, for parallel data for the other 34 official weather stations purported recording temperatures from mercury thermometers and probes in the same shelters has so far been denied by the Bureau.
Boris Kelly-Gerreyn from the Bureau initially claimed provision of the scanned A8 forms too onerous and of no public interest. More recently, and as preposterously, Boris Kelly-Gerreyn has claimed the information does not exist in the form of reports and therefore cannot be provided. On 29th November 2021, Elizabeth Hampton, Acting Freedom of Information Commissioner, absurdly sided with the Bureau. John Abbot lodged a complaint with the Administrative Appeals Tribunal that will be heard on 3rd February in Brisbane.
I received scans of the A8 Forms from Mildura at the direction of Minister Frydenberg as two tranches in October and then December 2017.
My immediate and initial analysis of the first tranche indicated that the probe was recording too cool relative to the mercury. I wrote to the Minister asking for more A8Forms and recommending that the Bureau:
1. Suspend the announcement of new record hot days;
2. Inform the World Meteorological Organisation that its temperature measurements from probes are not comparable with historical measurements from mercury thermometers;
3. Establish an audit mechanism.
I was ignored by the Minister. Australian science writer and blogger href=”https://ift.tt/NpZtFvQ Nova did publish something at her blog. It was most disheartening when Bill Johnson in the same thread set about attacking me.
After receiving the second tranche, and tediously manually transcribing more mercury and probe values from the scanned A8 Forms from Mildura, my analysis confirms that the first probe – recording official temperatures from 1 November 1996 until 3 May 2000 – erroneous recorded temperatures too cool by 0.2 °C, and with a strong seasonal variation. The difference is statistically significant.
On 3 May 2000, the Bureau changed the Stevenson screen to a smaller design, and while there is no record of a change in the type of probe, this almost certainly also occurred based on the very different recording pattern relative to the mercury.
Initially the temperatures as recorded at Mildura from what I am assuming was a new second probe in the new shelter where more consistent with the measurements from the mercury thermometer. But then the temperatures from the probe started to cool relative to the mercury thermometer for the period to 27 June 2012. Cooling was at a rate of nearly 1°C per 100 years.
Then on 27 June 2012 the probe which had now been recording the official temperature at Mildura for 12 years while drifting to record ever cooler, was changed.
The limited available parallel data indicates that this third probe records too hot relative to the same mercury thermometer – often by 0.4 °C.
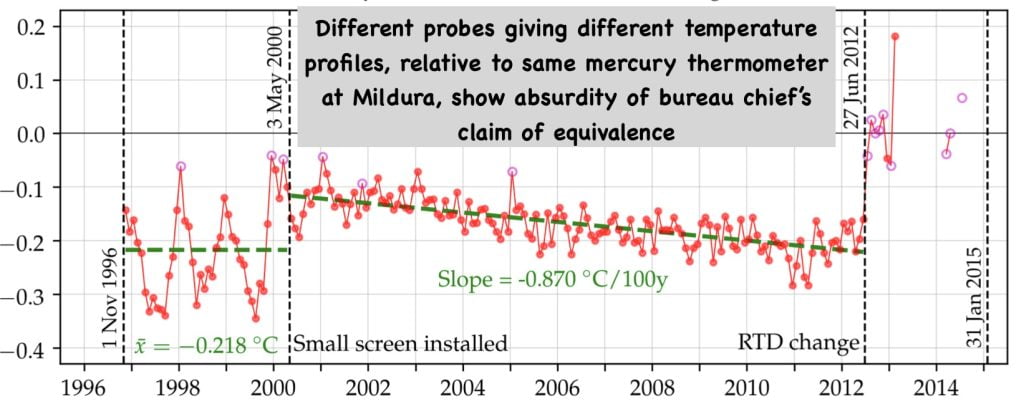
After the 27 June 2012, the Bureau stopped recording parallel data every day, particularly on hotter days. To be clear, on the hottest days from the period 27 June 2012 through until 31 January 2015 there are no recordings from the mercury thermometer and so this data is not normally distributed. I explained all of this in a blog post on 11 February 2018, that again received surprising little attention.
I notified mainstream climate scientists and various journalists but they didn’t seem to want to understand what it all meant. I had been concerned about the issue since 2014, when I wrote to Australia’s Chief Scientist, Alan Finkel. Now I felt I had some more and compelling proof. I was concerned that the entire historical temperature record for Australia was becoming compromised, and I lost interest in my weather forecasting using machine learning so dependent on reliable temperature data.
Meanwhile, these same university professors who showed no interest in any of the quality assurance issues associated with the change in instrumentation that I was alerting them to by email, claimed that it had suddenly got a lot hotter here in Australia.
Sophie C. Lewis and Andrew D. King, for example, publishing in Geophysical Research Letters (volume 42, Issue 18) conclude that it has gotten significantly hotter here in Australia since 2012. They attribute the ‘dramatically increased rate of observed hot record breaking in recent Australian temperatures’ to human-caused global warming.
I wrote to Dr Lewis suggesting the step-up in temperatures could be because of changes in how temperatures are measured, specifically a change over to a third probe design. She never replied.
The World Meteorological Organisation provides a definition of daily maximum temperature: the highest temperature in that 24-hour period that can be read directly from a mercury thermometer, but when using a temperature probe ‘instantaneous’ values must be averaged over one to ten minutes.
Ignoring all of this, the Australian Bureau of Meteorology uses purpose-built probes and takes instantaneous readings. These are then used uncritically to claim catastrophic human-caused global warming – and record new hot days, including at Mildura.
I predict that this is going to all come crashing down one day, including on the careers of Sophie Lewis, Andrew King, Boris Kelly-Gerreyn and Elizabeth Hampton.
It could have started to be put right by Josh Frydenberg back in 2017, but he obfuscated. Much thanks to Alan Jones for at least trying to get something done.
There is still time for the current director of the Bureau, Andrew Johnston, to help me work out the extent of the problem by making all the parallel data public. But so far, he won’t even met with me; all-the-while emailing that the bureau’s purpose designed probes are equivalent to the old mercury thermometers making numerical averaging unnecessary. Except the limited data that I have obtained, transcribed and analysed for Mildura tells a completely different story. A story of incompetence, as much as malfeasance.
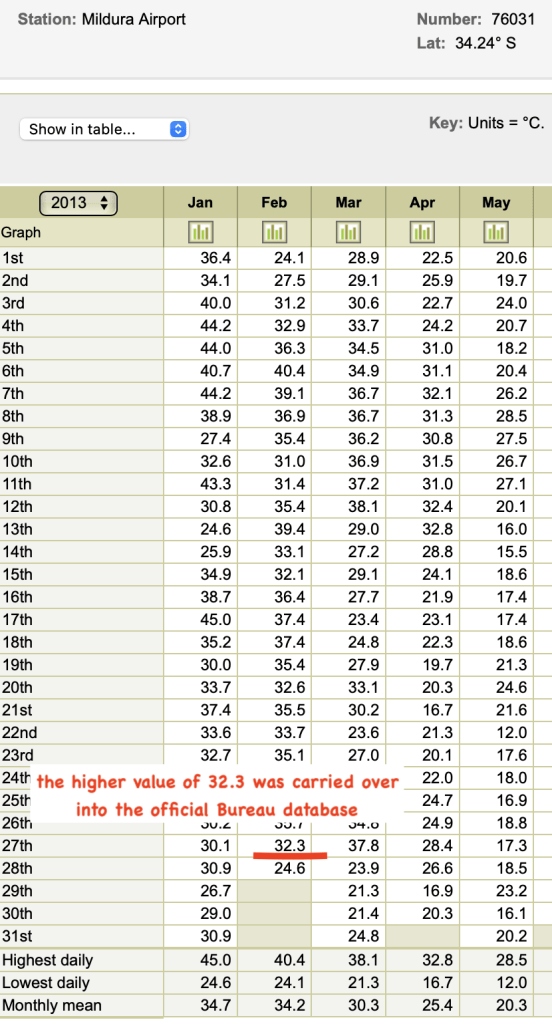
via Jennifer Marohasy
January 23, 2023 at 07:18PM

